Abstract
The in vitro evaluation of histones and their post-translational modifications has drawn substantial interest in the development of epigenetic therapies. The differential expression of histone isoforms may serve as a potential marker in the classification of diseases affected by chromatin abnormalities. In this study, protein profiling by liquid chromatography and mass spectrometry was used to explore differences in histone composition in primary CLL cells. Extensive method validations were performed to determine the experimental variances that would impact histone relative abundance. The resulting data demonstrated that the proposed methodology was suitable for the analysis of histone profiles. In 4 normal individuals and 40 CLL patients, a significant decrease in the relative abundance of histone H2A variants (H2AFL and H2AFA/M*) was observed in primary CLL cells as compared to normal B cells. Protein identities were determined using high mass accuracy mass spectrometry and shotgun proteomics.
Keywords: Chronic lymphocytic leukemia, histone, variant, RPLC-MS
INTRODUCTION
Chronic lymphocytic leukemia (CLL) is the most common type of adult leukemia [1]. Patients with CLL have a humoral immune deficiency that becomes progressively worse as the disease advances. Complications arising from CLL, including infection, autoimmune complications, secondary cancers, and Richter’s transformation, may relate to the immune suppression associated with CLL. Due to the absence of evidence for benefit of early intervention, CLL is generally treated at the time symptoms develop [2]. CLL treatment typically consists of chemotherapy such as fludarabine and/or cyclophosphamide. More recently, the addition of monoclonal antibodies to CLL therapy has improved patient outcomes [3] [4] [5]. However, despite these recent improvements, CLL remains incurable with the possible exception of allogeneic stem cell transplantation (BMT) [6].
Over the past decade, significant effort has been put forth to identify biological markers that at the time of diagnosis may predict early progression and poor response to chemoimmunotherapy. Among the best characterized markers are interphase cytogenetic abnormalities, for which del(17p13.1) and del(11q22.3) are associated with early disease progression and poor outcome. In addition, at least two predominant subtypes of CLL cases have been identified including those with somatically mutated immunoglobulin heavy-chain variable region (IgVH) genes that tend to have a more indolent course and those with unmutated IgVH genes that have a more aggressive disease phenotype [7–11]. Positive expression of ZAP-70 and CD38 are most commonly linked to the IgVH unmutated CLL subtype [12, 13]. Additionally, clonal evolution over the course of the disease is more frequently observed with IgVH unmutated CLL [14, 15]. Relative to initial CLL therapy response, the presence of del (17p13.1) or del (11q22.3) determined by interphase cytogenetics is more predictive of poor treatment outcome than either IgVH mutational analysis or ZAP-70 [16]. However, these factors each have drawbacks that may reduce their impact, especially as single parameters, in treatment decisions. More reliable biomarkers that can reliably predict disease progression and response to different types of treatments are urgently needed. Such methods ideally will have more efficient and accurate screening with improved sensitivity and specificity for “ruling in” a diagnosis and/or potential disease state of a patient.
Aberrant histone modifications are commonly detected in various types of cancer. Alterations in gene expression in the tumor cell can dramatically impact the cell cycle, leading to changes in the expression of histone variants and their subsequent post-translational modifications relative to normal cells. In AML, for example, a common hallmark of patients that possess the AML-ETO translocation is hypoacetylation of histone H4 [17]. Furthermore, multiple reports implicate the global chromatin profile as a potential biomarker for cancer. Fraga et al. determined by mass spectrometry and immunoblotting that loss of acetylation at lysine 16 and loss of trimethylation at lysine 20 on histone H4 were hallmarks of many cancerous cell types [18]. Seligson et al. and Barlesi et al. applied immunohistochemical staining of tissues with highly specific histone antibodies to determine risk of tumor recurrence in primary prostatectomy tissue samples and resected non small cell lung cancer tissue, respectively [19, 20]. Seligson stained 183 primary prostate cancer tissues with antibodies for acetylated H3 K9, K18 and H4 K12 as well as dimethylated H4 R3 and H3 K4. Their evaluation of the data resulted in a panel of modifications (H3 K4Me2 and H3 K18Ac) from which they were able to distinguish, with high statistical confidence, patients who were at elevated risk for tumor recurrence but presented with low-grade tumors by Gleason score [20].
In this study, we characterized an LC-MS based protein profiling strategy for its potential to assess histone isoform distributions in primary tumor cells. We performed extensive method validations to isolate any influences on the LC-MS profile caused by sample preparation, processing time and biological variability within individuals. The resulting data demonstrates that this approach is highly reproducible. We then evaluated a small sample set consisting of normal B cells and CLL cells obtained from patients to ascertain difference in histone abundance. The LC-MS profiles revealed significant difference in the relative abundance of histone H2A variants. In order to assess the potential clinical implications of these results and the ability of relative H2A abundance to serve as either a diagnostic or prognostic biomarker for CLL, sensitivity and specificity values for the LC-MS based protein profiling strategy were calculated and compared to analogous values for other reported CLL biomarkers such as ZAP-70 expression, IgVH and p53 mutational status, and genomic profiling. The data suggest a correlation between global chromatin modifications and the CLL phenotype. Bivariate statistical analysis showed a clear demarcation between primary CLL cells and normal B cells. Identities of these H2A variants were verified by high mass accuracy mass spectrometry and shotgun proteomics.
EXPERIMENTAL
Sample Preparation
Bovine calf thymus histones were used as a single source of standards throughout all experiments. The bovine calf thymus tissue was purchased from Worthington Biochemical Co. (Lakewood, NJ). B cells (typically 1X10⁷ – 1×10⁸ from 40 cc) from CLL patients were procured from peripheral blood as reported previously [17, 21]. CLL was defined by the modified NCI criteria [22]. Normal B cells were obtained from leukocyte reduction filters following blood collection from healthy volunteers as described by Weitkamp and Crowe [23]. For both normal and CLL cells, informed consent as part of an OSU Institutional Review Board-approved protocol was obtained. Peripheral blood mononuclear cells (PBMC) were isolated using density gradient centrifugation (Ficoll-Paque Plus, Pharmacia Biotech, Piscataway, NJ) and washed in plain RPMI (Mediatech Inc., Herndon, VA). B cells were selected by CD19 selection using Magnetic Activated Cell Sorting (MACS, Miltenyi Biotec, Auburn CA). Alternatively, B cells were selected using CD19+ Rosette-Sep according to the manufacturer’s instructions (StemCell Technologies, Vancouver BC).
Liquid Chromatography Mass Spectrometry Profiling (LC-MS)
Histones were extracted with a standard acidic procedure as described [8]. The acid extracted nuclear protein mixture was separated by reversed-phase HPLC (Discovery Bio wide pore C18 column, 1.0 mm i.d., 5 mm, 300 Å, Supelco, USA) and detected by an ESI-TOF mass spectrometer. HPLC separation was carried out using a flow rate of 50 μL/min with a gradient of mobile phase A (0.1% TFA in water) and mobile phase B (0.1% TFA in acetonitrile) where B increased from 30% to 45% in 2 min, 60% in 20 min and was held at 60% for 4 min. Between each run, the column was washed at 100% B for 2 min and equilibrated at 30% B for 30 min. The eluted histones were infused into the ESI LC-TOF MS or ESI LC-Q-TOF MS coupled with an auto-sampling Waters HPLC instrument (Waters 2690, Waters, Milford, MA). ESI was performed at the optimal conditions of 3 kV capillary voltage, 100 °C source temperature and 50 V cone voltage. Data were acquired in continuum mode at the rate of 1 spectrum sec−1. All spectra were obtained in the positive ion mode. NaI was used for external mass calibration over the m/z range 500–2500.
High Mass Accuracy Mass Spectrometry
The acid-extracted nuclear protein mixture derived from CD19-positive cells of three CLL patients and two healthy volunteers was separated as described above. An LTQ Orbitrap hybrid mass spectrometer (Thermo Electron Corp., Bremen, Germany) was used for all high resolution measurements. Ion transmission into the linear trap and further to the Orbitrap was automatically optimized for maximum ion signal over the required m/z range. The number of accumulated ions for the full scan was 5 X 10⁵. The resolving power of the Orbitrap mass analyzer was set to 100,000 (m/Δm50% at m/z 400) which resulted in the acquisition rate of 1 scan every 2 sec. The LTQ Orbitrap spectra of human histones were processed using Xtract (Thermo Electron Corp., Bremen, Germany) to produce monoisotopic mass lists.
RESULTS AND DISCUSSION
Reverse-Phase Liquid Chromatography-Mass Spectrometry (RPLC-MS)
Preliminary LC-MS data on a limited set of CLL patients suggested differences in histone H2A expression between patients and normal volunteers [17]. In order to assess the clinical relevance of this earlier work, primary CLL cells from a larger cohort of patients were examined by LC-MS profiling. A more efficient method for high throughput screening was developed that improved the separation of histones from nuclear extracts [24]. The optimized LC-MS method was used to compare histone profiles from B cells obtained from CLL patients and normal volunteers. The extracted histones were analyzed on either an ESI LC-TOF MS or ESI Quadrupole-TOF MS coupled with a Waters HPLC. The reproducibility in retention time for the H2A variants was better than 5% for the bovine histone standards under continuous analysis over a 48 hour time period.
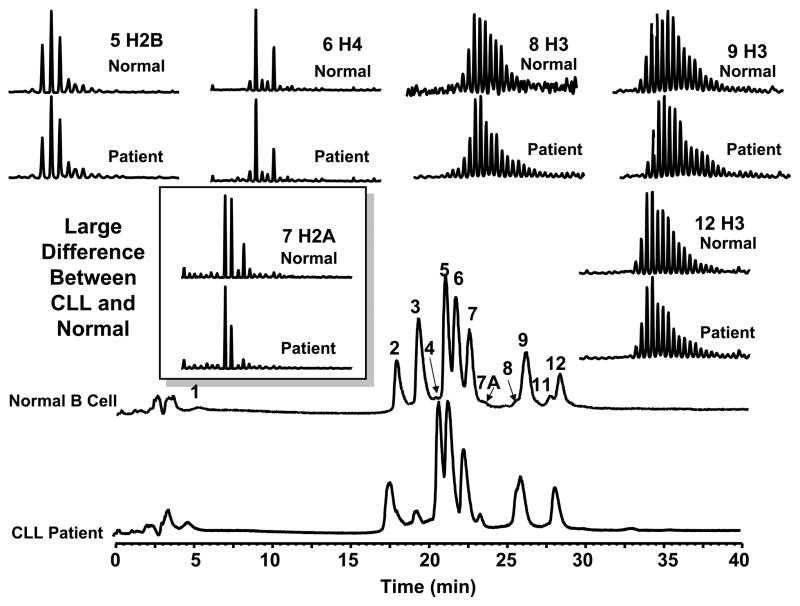
For the cohort of samples (40 patients and 4 normals), we observed a change in H2A abundance of the variants H2AFL (14,016 Da) and H2AFA/M* (14,046 Da) in CLL cells relative to normal B cells. These were initially assumed to be mono-methylated and mono-acetylated isoforms [17]. Subsequent analysis showed that these were in fact histone variants [24–26]. Figure 1 illustrates the comparison of LC-MS profiles of core histones from a CLL patient and normal volunteer. In addition to these specific H2A variants, large changes in the abundance of H3 variants (fractions 8 and 11, increased in CLL) and two as yet unidentified proteins (fractions 3 and 7A) were observed for 90% of the screened patient samples. At present we may lack the chromatographic resolution to fully resolve all these histone variants and make meaningful comparisons. As the technology improves we anticipate that we will be able to detect more significant changes in other histone isoforms/variants. However, for this report we can focus on the major changes associated with the three H2A variants in order to fully validate the current method. Our data suggest a correlation between global chromatin makeup and the CLL phenotype, and our current focus is thus to characterize these H2A variants. It is important to note that the observed changes in abundance could be due to an increase in the H2AFC/D/I/N/P variant. However, because the absolute protein amount is difficult to accurately determine, we instead report the relative changes for variants H2AFA/M* and H2AFL. Protein identification was then verified by high mass accuracy MW detection as well as nano-LC-MS/MS following in-gel tryptic digestion of H2A from RPLC fraction 7 [24].
Figure 1.
LC-MS profile of core histones from a CLL patient and a normal volunteer. The relative level of two histone H2A variants in CLL cells was significantly different than that from normal B-cells. Additional changes in the abundance of two H3 variants (fractions 8 and 11) and two unidentified proteins (fractions 3 and 7A) were also observed.
High Mass Accuracy Identification of H2A Variants
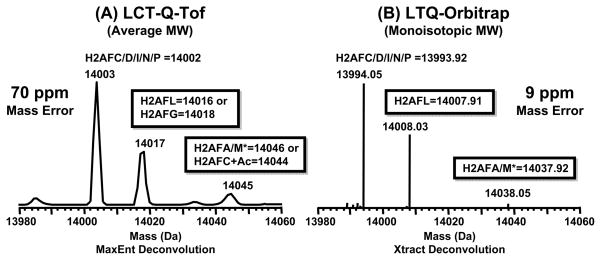
Molecular weights determined by use of LC-ESI-TOF-MS are of insufficient mass accuracy and resolving power to perform direct mass assignment of isobaric histone species. In our study, histone profiles obtained by ESI-LC-TOF-MS showed the presence of two H2A forms (average MW = 14017 and 14045 Da) that were altered in abundance in CLL. However, due to the lower mass accuracy of LC-ESI-TOF-MS the species at 14017 Da could not be directly assigned to either H2AFL (14016 Da), H2AFG (14018 Da) or a mixture of the two exclusively. Likewise, H2AFA/M* (14046 Da) was indistinguishable by mass from the monoacetylated form of H2AFC/D/I/N/P.
The data in Figure 2 demonstrate the importance of high mass accuracy for determining the identities of histone variants in CLL patient cells. The Xtract algorithm (adapted from David Horn’s THRASH algorithm used for mass assignment of FT-ICR MS data [27]) was used to obtain the zero charge monoisotopic masses for the intact proteins separated by LC-MS. The species with a monoisotopic mass of 14008.03 Da was correlated to the H2A variant H2AFL (14007.91 Da) and that of 14038.05 Da to H2AFA/M* (14037.92 Da) within 10 ppm error. The average mass accuracy of LTQ-Orbitrap was 9 ppm (~0.1 Da error in mass for the intact protein), whereas for the ESI-TOF-MS the average mass error was ~70 ppm (~1 Da error). These results are of great importance because these species in question will be evaluated by orthogonal approaches. Thus, these data will greatly aid in the design of antibodies and PCR primers used to probe these variants in vivo.
Figure 2.
Accurate mass determinations of histone variants in human CLL cells. A) H2A mass profile obtained by use of LCT-Q-TOF; B) H2A mass profile obtained by use of the LTQ-Orbitrap.
Our high mass accuracy data show that the three major peaks correspond in mass to variants H2AFC/D/I/N/P (14,002 Da, average), H2AFL (14,016 Da, average) and H2AFA/M* (14,046 Da, average). Using additional approaches, we determined that the peak 14,017 Da was not mono-methylated H2AFC/D/I/N/P and 14,045 Da was not mono-acetylated H2AFC/D/I/N/P [28–30]. The identity of these species was inferred through use of double SILAC labeling and LC-MS/MS [24]. The SILAC mass shifts as well as the level of acetylation (determined by AU-PAGE) and peptides identifications were inconsistent with modified forms of H2AFC/D/I/N/P (see supplementary tables 1–3 and supplementary Figure 3). SILAC allowed us to determine the number of lysine residues and the degree of methylation. The mass shifts we observed were consistent with a variant that contained 13 lysine residues as opposed to the 14 residues in H2AFC/D/I/N/P. We also did not observe an increase in mass due to the incorporation of labeled methyl groups. With AU-PAGE we were able to separate the acetylated isoforms, which were then in-gel digested and characterized by LC-MS/MS [24]. The list of peptides observed is provided as a supplementary table. We cannot conclusively rule out potential confounding influence due to changes in acetylation of H2AFC/D/I/N/P. However, after consideration of the high-mass accuracy, SILAC, AU-PAGE and LC-MS/MS we propose that the majority of signal at 14046 is due to the histone variant H2AFA/M*.
Method Validation
A critical component to all label-free methodologies is the determination of factors that introduce variability in the relative distribution of species in the LC-MS profile. We performed method validations to isolate the influences that can alter LC-MS profile. These factors included: changes in instrumental parameters, sample preparation and biological variations within individual patients over time. The first validation experiment was to determine the variability in the data for sample replicates run on either the same (within) or different (between) LC-MS instruments. These validations were carried out with a well-characterized histone standard purified from bovine thymus tissue using a nearly identical procedure as for the human B-cells. Bovine histone standards (N = 5) from the same preparation were analyzed over a 48 hour time period on the same LC-MS instrument. The samples yielded a coefficient of variance (CV) of 3–5% with regard to the relative abundance of H2A variants discussed above. Likewise, bovine histone standards (N = 5) prepared by different individuals and/or on different days were also analyzed under the same conditions. These samples yielded a CV of 2–5%. In all cases, the relative standard deviation (RSD) was less than 5%. An F-test shows the variance was not statistically different at the 95% confidence interval.
Two mass spectrometers (Micromass LCT and Q-TOF) were used to assess the potential variability introduced by using a different instrument. It should be noted that these instruments were made by the same manufacturer and differ only slightly in design. We also sought to draw comparison between these instruments and the LTQ-FT/Orbitrap. However, the LTQ-FT/Orbitrap data sets showed high levels of TFA adducts. We presume these adducts were due to gentler conditions within the source. We were unable to reduce the presence of these adducts without inducing fragmentation of protein ions. To overcome this limitation we are moving to TFA-free mobile phases that will allow for robust comparisons across instrumental platforms. However, for the current data sets we were restricted to assessing the variability due to MicroMass LCT and Q-TOF MSs. Bovine histone standards were run on the ESI LC-Q-TOF MS (N = 5) and ESI LC-TOF MS (N = 5). An important statistical test for determination of the effect of categorical factors on a response is Analysis of Variance (ANOVA), a standard statistical test to determine if there are significant differences between more than two groups of data. We divided the data into groups and employed a one-way ANOVA to determine if there were significant differences among the samples sets (i.e. the difference in mass spectrometers). These results showed that there were no difference in group means or standard deviations, indicating no difference between these two sample sets.
In order to assess the current method variability over time, a control chart using the historical data of standard histones prepared as above was plotted to show the relative abundance of H2A variants over a time period of 1.5 years (N = 21, Supplementary Figure 1). Control charting is an important tool used in Statistical Quality Control (SQC) and is based on continuous monitoring of process variation. The center line represents the average value corresponding to the in-control state. The three horizontal lines each above and below the central line correspond to 1–3 standard deviations of the mean. The third standard deviation corresponds to the upper control limit (UCL) and the lower control limit (LCL). These limits were chosen in order to show that the experimental process was in control at the 99% confidence level. Standard bovine histones were prepared by different individuals from different tissue lots at different times and analyzed using different instruments. In these experiments, all sample points fall within the control limits, and the method was thus assumed to be in the state of control.
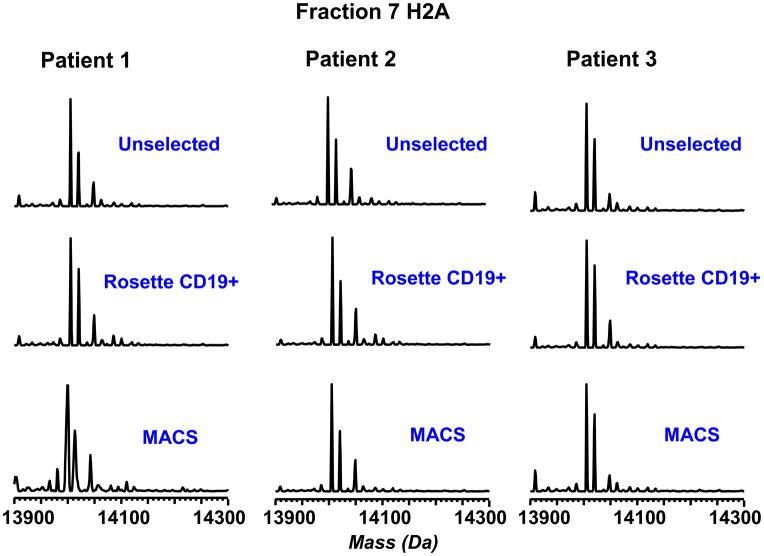
Following assessment of method variability, variability due to procurement of the patient material and purification of CLL cells must be addressed. A homogeneous population of CLL cells is necessary to make a genuine comparison between the normal and disease phenotype. Samples were obtained from CLL patients with greater than 80,000 lymphocytes per microliter, and analyzed using no selection, CD19+ Rosette-Sep selection or CD19+ MACS purification. These three purification approaches gave LC-MS profiles with a RSD less than 3% based on the relative abundance for the H2A variants (Figure 3). In addition, no significant differences were induced by these cell sorting approaches with regards to other core histones H2B, H4 and H3 (Supplementary Figure 2). Thus, the method appears to be fairly insensitive to cell purification, at least in regards to patients with higher peripheral blood CLL cell count. However, to minimize any unforeseen variability due to different sample preparation procedures, Rosette-Sep was used to enrich all CLL cell samples used in the study, regardless of count, due to its ease of use and relatively low cost. It should be noted that this method in our hands typically produces 90–95% CD19-positive cells from CLL patient blood even when CLL peripheral cell counts are much lower (greater than 20,000 cells per microliter).
Figure 3.
Evaluation of the effect of cell selection on histone H2A distribution patterns. B-cells from high-count patients were analyzed without selection and with CD19+ Rosette-Sep and MACS selection. All three approaches gave similar distributions of H2A variants.
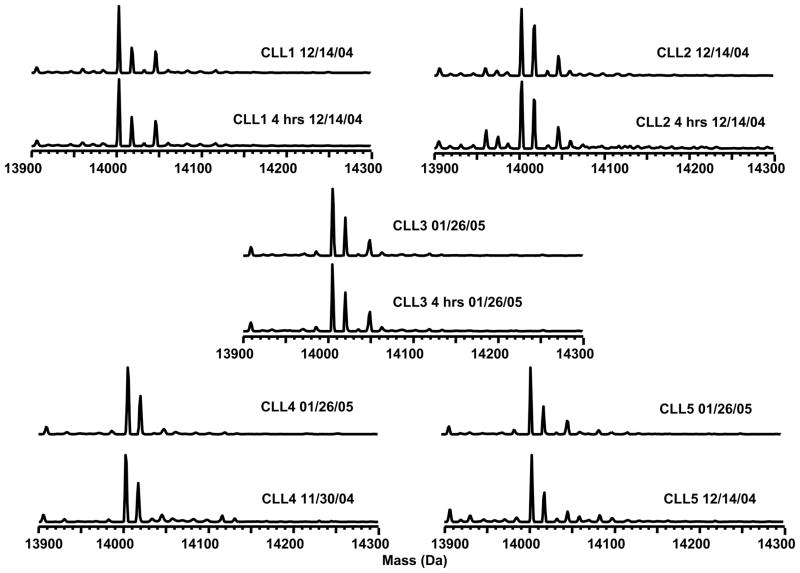
We also evaluated the effects of sample processing delay that may be incurred due to standard difficulties in acquisition and banking of patient blood. Two blood samples from each of three CLL patients were collected on the same day. One sample was immediately processed, and the other was processed after a 4-hour delay. The experimental results are illustrated in Figure 4. The LC-MS analysis yielded a relative standard deviation of < 5% with regards to the H2A relative abundance in the samples from the same CLL patient. A paired t-test (one tail, N1 = N2 = 3) that the processing delay did not significantly alter the histone abundance at 95% confidence interval: texperimental = 2.35 < tcritical = 6.31 for H2AFL and texperimental = 5.82 < tcritical = 6.31 for H2AFA/M*. Biological variability within individuals over time was also addressed in a similar fashion, using samples obtained from the same individual at different times and analyzed on different days. Likewise, a paired t-test at the 95% confidence interval (one tail, N1=N2=3) showed no statistical difference due to biological variability within an individual: texperimental = 2.92 < tcritical = 6.31 for H2AFL and texperimental = 2.82 < tcritical = 6.31 for H2AFA/M*.
Figure 4.
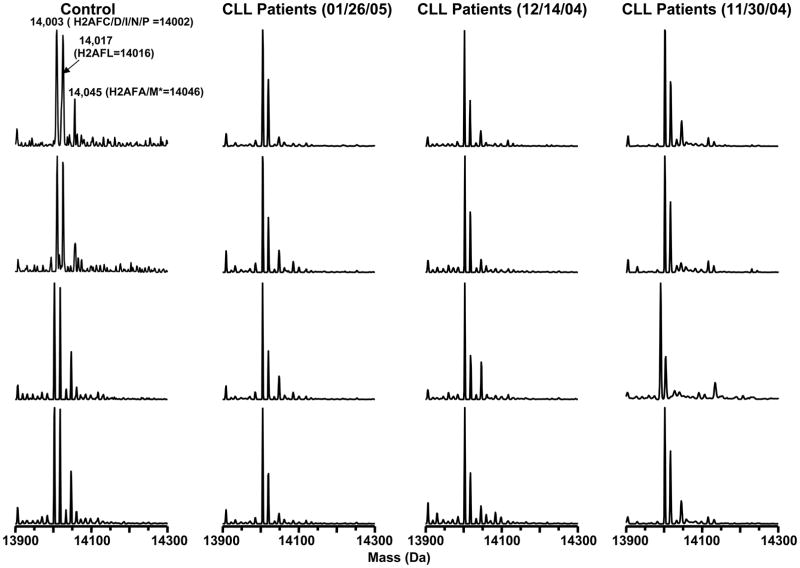
H2A variants from CLL patient cells screened on three different days. Histone H2A distributions were screened by LC-MS for 4 healthy volunteers and three groups of CLL samples (12–14 in each group). Four examples from each group are shown for comparison. Patient samples were run on different days to evaluate the reproducibility of the LC-MS method. Two variants of H2A were consistently present at decreased abundance in the CLL patient cells.
Overall, each of these validations indicate that our developed method is highly robust, and that the observed changes in H2A relative abundance are not due to biases from instrumentation or methodology.
When the developed method was applied to screening CLL samples, we included a characterized histone standard at the start, the end, and after every tenth sample to monitor the quality of data within a given batch analysis. Blanks were also interspersed to insure there was no sample carryover. Histone H2A modification patterns were screened for 4 healthy volunteers and three groups of CLL patients (12–14 patients in each group). Figure 5 shows mass profiles of H2A from the control group and the three CLL patient groups (only 4 spectra are shown here for each group). Patient samples were run on different days (11/30/04, 12/14/04 and 01/26/05). The two H2A variants (H2AFL = 14,016 Da and H2AFA/M* = 14,046 Da) were consistently present at decreased abundance in the CLL patient cells.
Figure 5.
Evaluation of sample processing delay. Each of five patient samples showed consistent H2A subtype distributions when screened on different days or screened with sample processing delays on the same day.
Statistical Evaluation of H2A Isoform Abundance
The ultimate goal of the current study is the development of LC-MS profiling for clinical applications. In order to evaluate the clinical relevance of our results, biostatistical analysis of the data was performed. The relative abundance of H2AFL and H2AFA/M* were calculated according to the following equations (Eq. 1–2), where PI = Peak Intensity.
| (1) |
| (2) |
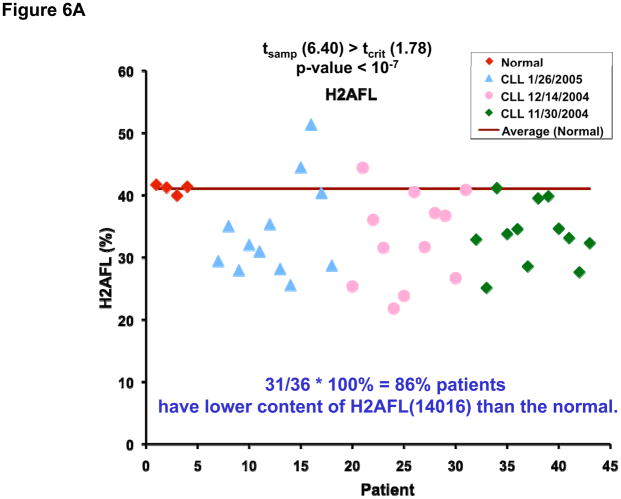
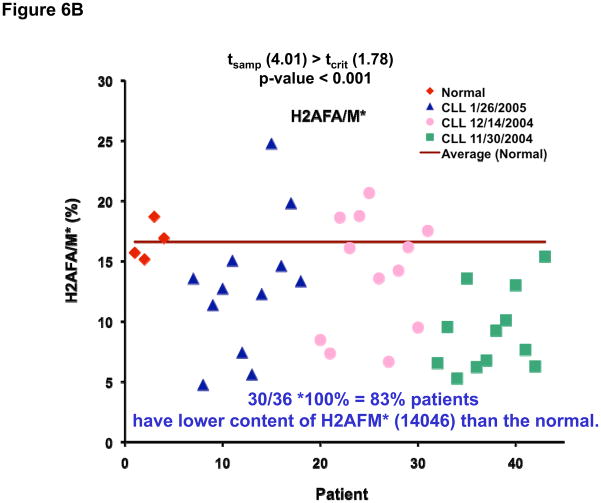
Figure 6 shows the plots of the relative abundance of the H2A variants in the healthy volunteer group (red), and three patient groups analyzed during different months (blue, pink and green). The relative abundance of H2AFL was found decreased in 31 patients and H2AFA/M* decreased in 30 patients as compared to normal B cells. When the univariate t-test was performed at 95% confidence level, the difference between the patients and the normal samples was found to be significant: tsample (6.40) > tcritical (1.78) (p-value < 10−7) for H2AFL (Figure 6A) and tsample (4.01) > tcritical (1.78) (p-value < 0.001) for H2AFA/M* (Figure 6B).
Figure 6.
Plots of the relative abundance of H2A variants in the healthy volunteer group (red), and three CLL patient groups analyzed during different months (blue, pink and green). For the 36 patient samples, the relative abundance of H2AFL was decreased in 31 (6A) and H2AFA/M* was decreased in 30 (6B).
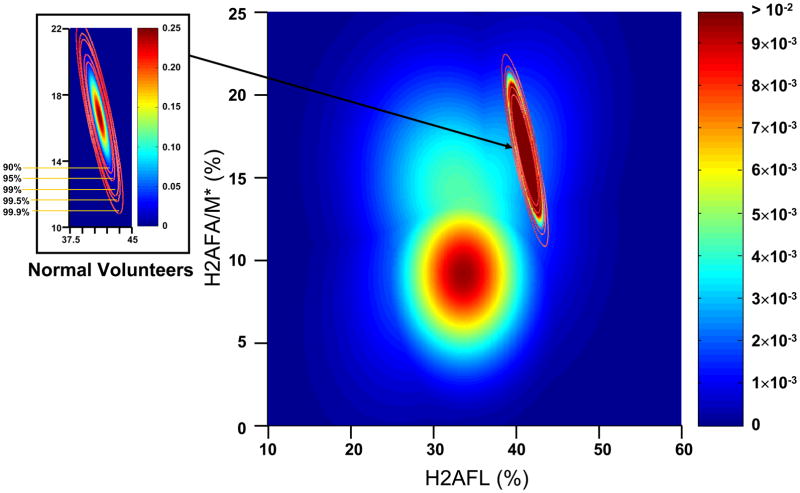
A bivariate statistical analysis was then performed using the relative abundance of H2AFL and H2AFA/M*. Assuming the data follow a bivariate normal distribution, the plots for the calculated probability density for the normal and CLL groups were determined and are shown in Figure 7. The distribution for the normal group was condensed relative to the CLL samples, which indicates the variances in the normal group are much smaller than those in the CLL groups. Additionally, the normal group and CLL groups were well separated.
Figure 7.
Probability density plots for the relative abundance of H2AFL and H2AFA/M* in CLL patient cells and normal B-cells.
The bivariate means were then calculated and compared using a standard Χ2 bivariate hypothesis test for continuous distributions. As shown in Table 1, all calculated p-values were smaller than 0.01, indicating that the means of the relative abundance for the normal group were statistically different from those for the CLL group at a > 99% confidence level. The ability for the bivariate analysis to discriminate the normal group from the CLL group based on H2AFL and H2AFA/M* abundance was determine by calculating the statistical power for given type I errors (Table 2). The power of the test (among 36 patients) was 0.955 given type I errors as low as 0.001. When the type I error was relaxed to 0.005, the power was still 0.965. Even with the limited number of the normal B-cell samples (4), the statistical power was as high as 95.5% (type I error = 0.001). More normal B-cell samples would further improve the statistical reliability.
Table 1.
Comparisons of bivariate means between the normal and CLL group.
| CLL Groups | 01/26/05 | 12/14/04 | 11/30/04 | Combined* |
|---|---|---|---|---|
| p-value | 0.0056 | ≪ 0.0001 | ≪ 0.0001 | ≪ 0.0001 |
“Combined” refers to the hypothesis test performed for all of the CLL patients (total 36).
Table 2.
Power calculation results from bivariate hypothesis tests on H2AFL and H2AFA/M* at different type I errors.
| Type I Error | 0.001 | 0.005 | 0.01 | 0.05 | 0.10 | |
|---|---|---|---|---|---|---|
| Power | CLL (01/26/05) | 0.940 | 0.952 | 0.957 | 0.971 | 0.977 |
| CLL (12/14/04) | 0.954 | 0.964 | 0.968 | 0.979 | 0.983 | |
| CLL (11/30/04) | 0.989 | 0.992 | 0.994 | 0.996 | 0.997 | |
| CLL (Combined)* | 0.955 | 0.965 | 0.969 | 0.979 | 0.983 | |
“Combined” refers to the test performed for all of the CLL patients (total 36).
Evaluation of Clinical Implications
As stated earlier, the potential of LC-MS protein expression profiling, and in particular the relative abundance of H2A variants, to serve as either a diagnostic or prognostic biomarker for CLL was evaluated using comparative sensitivity and specificity analyses. In order to perform such an evaluation, a confusion matrix (stratified into True Positive [TP], True Negative [TN], False Positive [FP], and False Negative [FN] results [31]) was constructed for two experimental outcomes in the context of the study cohort of 40 CLL patients and 4 normal controls: 1) decreased relative abundance of H2AFL variant associated with diagnosis of CLL; and 2) decreased relative abundance of H2AFA/M* variant associated with diagnosis of CLL. In the case of outcome (1), the sensitivity (TP/[TP+FN]), specificity (TN/[TN+FN]) [31], and F-measure (weighted harmonic mean of precision and recall [32]) of relative H2AFL abundance were found to be 77.5%, 30.7%, and 0.873 respectively. In the case of outcome (2), the sensitivity, specificity, and F-measure of relative H2AFA/M* abundance were found to be 75%, 28.5%, and 0.857, respectively. In general, tests with high sensitivities are used to “rule-out” a diagnosis, while tests with high specificities are used to “rule-in” a diagnosis. In addition, tests with high F-measures (e.g., approaching a value of 1) are able to optimize the number of accurate cases (e.g., with or without a specific diagnosis or therapeutic outcome, depending on the hypothesis being posed) retrieved from a given cohort or data set [31]. In comparison to our results, the sensitivities and specificities for other CLL-related biomarkers have been reported as follows: 1) ZAP-70 expression: in a study involving a cohort of 61 CLL patients and 44 normal subjects, the sensitivity and specificity of ZAP-70 expression as a diagnostic biomarker for CLL was found to be 55% and between 76–98%, respectively [33]; 2) combination of IgVH and p53 mutational status: in a study involving a cohort of 205 CLL patients, the sensitivity and specificity of IgVH and p53 mutational status as a diagnostic biomarker for CLL was found to be between 75–94% and between 36–78%, respectively [33]; and 3) genomic profiling: in a study involving a cohort of 107 CLL patients, the sensitivity and specificity of a targeted genomic profiling assay as a diagnostic biomarker for CLL was found to be 100% and >99%, respectively [34]. The sensitivity of relative H2A variant abundance as a biomarker for CLL is at least equivalent and sometimes superior to ZAP-70 expression and equivalent to the combination of IgVH and p53 mutational status. Unfortunately, genomic profiling has limited general applicability due to high associated costs. At the same time, the specificity of relative H2A variant abundance was considerably lower than that of other reported biomarkers for CLL. These findings suggest that relative H2A abundance is clinically applicable as a biomarker for “ruling out” a diagnosis of CLL, and may be most effective when used in combination with other biomarkers in order to maximize both sensitivity and specificity. Future studies should focus on ascertaining the importance of these variants to other genetic features, clinical response and disease progression in CLL.
CONCLUSION
This manuscript describes the necessary method validations required to successfully perform LC-MS based histone profiling in primary lymphocytes and transformed CLL cells. Extensive method validations were carried out to determine the robustness of the approach by isolating potential sources of variances. The validated approach was used to profile histones in a small sample group of normal B cells and CLL patient cells. Within this cohort of samples we observed statistically significant altered expression of histone H2A variants in CLL cells as compared to normal B cells. Additional sensitivity and specificity analyses indicate that relative abundance of H2A variants exhibits equivalent, and in some cases superior, performance as a clinically significant biomarker for “ruling out” diagnoses of CLL relative to established prognostic factors. These findings suggest a potential correlation between chromatin modifications and the CLL phenotype.
Supplementary Material
Acknowledgments
The authors thank Campus Chemical Instrument Center, Dr Kari B. Green-Church and Nan Kleinholz for access to the LC-TOF and assistance with LC-MS experiments. The project was supported by the Ohio State University, the Camille and Henry Dreyfus Foundation, the V-Foundation and the National Institutes of Health (CA101956, CA107106, RR023647, CA102031, CA134232) the Specialized Center of Research funded by the Leukemia and Lymphoma Society. The Leukemia & Lymphoma Society and the D. Warren Brown foundation provided additional support to JCB.
References
- 1.Lucas DM, Davis ME, Parthun MR, Mone AP, et al. Leukemia. 2004;18:1207–1214. doi: 10.1038/sj.leu.2403388. [DOI] [PubMed] [Google Scholar]
- 2.Journal of the National Cancer Institute. 1999;91:861–868. doi: 10.1093/jnci/91.10.861. [DOI] [PubMed] [Google Scholar]
- 3.Byrd JC, Rai K, Peterson BL, Appelbaum FR, et al. Blood. 2005;105:49–53. doi: 10.1182/blood-2004-03-0796. [DOI] [PubMed] [Google Scholar]
- 4.Keating MJ, O’Brien S, Albitar M, Lerner S, et al. J Clin Oncol. 2005;23:4079–4088. doi: 10.1200/JCO.2005.12.051. [DOI] [PubMed] [Google Scholar]
- 5.Kay NE, Geyer SM, Call TG, Shanafelt TD, et al. Blood. 2007;109:405–411. doi: 10.1182/blood-2006-07-033274. [DOI] [PMC free article] [PubMed] [Google Scholar]
- 6.Byrd JC, Shinn C, Ravi R, Willis CR, et al. Blood. 1999;94:1401–1408. [PubMed] [Google Scholar]
- 7.Damle RN, Wasil T, Fais F, Ghiotto F, et al. Blood. 1999;94:1840–1847. [PubMed] [Google Scholar]
- 8.Ghia P, Stamatopoulos K, Belessi C, Moreno C, et al. Blood. 2005;105:1678–1685. doi: 10.1182/blood-2004-07-2606. [DOI] [PubMed] [Google Scholar]
- 9.Hamblin TJ, Davis Z, Gardiner A, Oscier DG, Stevenson FK. Blood. 1999;94:1848–1854. [PubMed] [Google Scholar]
- 10.Hamblin TJ, Orchard JA, Ibbotson RE, Davis Z, et al. Blood. 2002;99:1023–1029. doi: 10.1182/blood.v99.3.1023. [DOI] [PubMed] [Google Scholar]
- 11.Oscier DG, Gardiner AC, Mould SJ, Glide S, et al. Blood. 2002;100:1177–1184. [PubMed] [Google Scholar]
- 12.Chen L, Widhopf G, Huynh L, Rassenti L, et al. Blood. 2002;100:4609–4614. doi: 10.1182/blood-2002-06-1683. [DOI] [PubMed] [Google Scholar]
- 13.Ferrarini M, Chiorazzi N. Semin Hematol. 2004;41:207–223. doi: 10.1053/j.seminhematol.2004.05.003. [DOI] [PubMed] [Google Scholar]
- 14.Stilgenbauer S, Sander S, Bullinger L, Benner A, et al. Haematologica. 2007;92:1242–1245. doi: 10.3324/haematol.10720. [DOI] [PubMed] [Google Scholar]
- 15.Shanafelt TD, Witzig TE, Fink SR, Jenkins RB, et al. J Clin Oncol. 2006;24:4634–4641. doi: 10.1200/JCO.2006.06.9492. [DOI] [PubMed] [Google Scholar]
- 16.Grever MR, Lucas DM, Dewald GW, Neuberg DS, et al. J Clin Oncol. 2007;25:799–804. doi: 10.1200/JCO.2006.08.3089. [DOI] [PubMed] [Google Scholar]
- 17.Zhang L, Freitas MA, Wickham J, Parthun MR, et al. J Am Soc Mass Spectrom. 2004;15:77–86. doi: 10.1016/j.jasms.2003.10.001. [DOI] [PubMed] [Google Scholar]
- 18.Gonzalo S, Jaco I, Fraga MF, Chen T, et al. Nat Cell Biol. 2006;8:416–424. doi: 10.1038/ncb1386. [DOI] [PubMed] [Google Scholar]
- 19.Barlesi F, Giaccone G, Gallegos-Ruiz MI, Loundou A, et al. J Clin Oncol. 2007;25:4358–4364. doi: 10.1200/JCO.2007.11.2599. [DOI] [PubMed] [Google Scholar]
- 20.Seligson DB, Horvath S, Shi T, Yu H, et al. Nature. 2005;435:1262–1266. doi: 10.1038/nature03672. [DOI] [PubMed] [Google Scholar]
- 21.Byrd JC, Shinn C, Ravi R, Willis CR, et al. Blood. 1999;94:1401–1408. [PubMed] [Google Scholar]
- 22.Cheson BD, Bennett JM, Grever M, Kay N, et al. Blood. 1996;87:4990–4997. [PubMed] [Google Scholar]
- 23.Weitkamp JH, Crowe JE., Jr Biotechniques. 2001;31:464–466. doi: 10.2144/01313bm01. [DOI] [PubMed] [Google Scholar]
- 24.Su X, Jacob NK, Amunugama R, Lucas DM, et al. J Chromatogr B Analyt Technol Biomed Life Sci. 2007;850:440–454. doi: 10.1016/j.jchromb.2006.12.037. [DOI] [PMC free article] [PubMed] [Google Scholar]
- 25.Bonenfant D, Coulot M, Towbin H, Schindler P, van Oostrum J. Mol Cell Proteomics. 2005 doi: 10.1074/mcp.M500288-MCP200. [DOI] [PubMed] [Google Scholar]
- 26.Boyne MT, 2nd, Pesavento JJ, Mizzen CA, Kelleher NL. J Proteome Res. 2006;5:248–253. doi: 10.1021/pr050269n. [DOI] [PubMed] [Google Scholar]
- 27.Horn DM, Zubarev RA, McLafferty FW. J Am Soc Mass Spectrom. 2000;11:320–332. doi: 10.1016/s1044-0305(99)00157-9. [DOI] [PubMed] [Google Scholar]
- 28.Ren C, Zhang L, Freitas MA, Ghoshal K, et al. J Am Soc Mass Spectrom. 2005;16:1641–1653. doi: 10.1016/j.jasms.2005.06.001. [DOI] [PMC free article] [PubMed] [Google Scholar]
- 29.Su X, Zhang L, Lucas DM, Davis ME, et al. Anal Biochem. 2007;363:22–34. doi: 10.1016/j.ab.2006.12.031. [DOI] [PMC free article] [PubMed] [Google Scholar]
- 30.Zhang L, Su X, Liu S, Knapp AR, et al. J Proteome Res. 2007;6:81–88. doi: 10.1021/pr060139u. [DOI] [PMC free article] [PubMed] [Google Scholar]
- 31.Peat J, Barton B. Medical Statistics: A Guide to Data Analysis and Critical Appraisal. Blackwell Publishing; Malden, Massachusets: 2005. p. 336. [Google Scholar]
- 32.Hripcsak G, Rothschild A. J Am Med Inform Assoc. 2005;12:296–298. doi: 10.1197/jamia.M1733. [DOI] [PMC free article] [PubMed] [Google Scholar]
- 33.Passam F, Tachynopoulou V, Skoumi D, Tsompanakou A, et al. Ann Hematol. 2006;85:795–805. doi: 10.1007/s00277-006-0159-4. [DOI] [PubMed] [Google Scholar]
- 34.Schwaenen C, Nessling M, Wessenddor S, Salvi T, et al. PNAS. 2003;10:1039–1044. [Google Scholar]
Associated Data
This section collects any data citations, data availability statements, or supplementary materials included in this article.


