Abstract
Our challenge in annotating the 2.91-Mb Adh region of the Drosophila melanogaster genome was to identify genetic and genomic features automatically, completely, and precisely within a 6-week period. To do so, we augmented the MAGPIE microbial genome annotation system to handle eukaryotic genomic sequence data. The new configuration required the integration of eukaryotic gene-finding tools and DNA repeat tools into the automatic data collection module. It also required us to define in MAGPIE new strategies to combine data about eukaryotic exon predictions with functional data to refine the exon predictions. At the heart of the resulting new eukaryotic genome annotation system is a reverse comparison of public protein and complementary DNA sequences against the input genome to identify missing exons and to refine exon boundaries. The software modules that add eukaryotic genome annotation capability to MAGPIE are available as EGRET (Eukaryotic Genome Rapid Evaluation Tool).
The microbial MAGPIE genome annotation system (Gaasterland and Sensen 1996; Deckert et al. 1998; Gaasterland and Ragan 1998; Romine et al. 1999) accepts assembled, unannotated contiguous genome sequence data as input. For finished genome sequence data, the system performs three phases of analysis. Phase 1 identifies coding regions, builds DNA-level and protein-level analysis requests for the coding regions, manages the execution of the requests on remote or local machines, and parses the output data into local relational facts, each of which is connected to supporting text extracted from the original output. Included in the phase 1 data collection are comparisons of each protein sequence encoded in the query genome with the proteins from each available complete genome or chromosome.
In phase 2, MAGPIE generates a functional report for each coding region by synthesizing all overlapping functional evidence into a single view according to user-specified preferences (Gaasterland and Lobo 1997). A series of decision rules generate one or more suggested functions for the gene product of the coding region. Alignments with proteins from other genomes are used to determine potential boundaries between protein domains. Currently, the system suggests one function for the whole protein and notes potential domains. The system also suggests one or more functional categories for the protein based on categories of similar functions in Escherichia coli, yeast, Synechocystis sp., and other complete genomes with assigned function categorization. The system treats enzymes as special cases. It looks for all enzyme numbers in the collected evidence and displays the most frequently occurring enzyme numbers together with their function descriptions. The synthesis of evidence overlays PROSITE (Hofmann et al. 1999), BLOCKS (Henikoff et al. 1999), and PRINTS (Attwood et al. 1999) functional motifs with sequence alignments so that a biologist user can easily see whether motif information is consistent with suggested enzyme functions. In phase 2, biologist users are expected to confirm or edit the annotations of individual gene products through interactive forms. Confirmed annotations are saved for later automatic reformatting into an European Molecular Biology Laboratory (EMBL) or GenBank nucleotide database submission form.
In phase 3, the MAGPIE system generates a series of whole-genome reports. The first is an enzyme report that collects links to coding regions with suggested enzymatic functions into one table. The second is a tRNA report that summarizes which tRNAs have been found and which amino acids have at least one type of codon in an annotated tRNA gene. The third is a pathway report that lists for every pathway in the enzyme and metabolic pathway (EMP) database which enzymes have been confirmed manually or suggested automatically. This phase also generates an executive summary of all predicted genes and their current confirmed or suggested annotation. Finally, this phase generates a summary of the distribution of matching proteins from other genomes in the form of a genomic signature (Gaasterland and Ragan 1998a) [also referred to more recently in the literature as a phylogenetic profile (Marcotte et al. 1999)] for every encoded protein. Genomic signatures of ORFs are included in the enzyme reports, the individual protein function reports, the pathway reports, and the executive summary.
Adapting MAGPIE for Eukaryotic Genome Annotation
Adapting MAGPIE for eukaryotic genome annotation required four steps related to exon identification. First, we had to add a preliminary module to request and parse gene-finding tools. We evaluated several tools based on (1) their ability to find Drosophila exons, (2) whether they could be installed locally or used remotely via an email server, and (3) the difficulty of parsing the output into a relational form. We selected GENSCAN (Burge and Karlin 1998) as the first gene-finding tool to integrate into the system. Second, we had to adapt the visual display and internal relational tables to store coding regions as a series of exons rather than as one ORF. Third, we had to add an automated reverse-similarity feature that extracted the strongest matching proteins for a coding region from the public databases, load those sequences into a search group, and compare the sequences with BLAST (Altschul et al. 1997) to the input genomic sequence data. Fourth, we had to build an exon editing tool that allowed an expert biologist to “tune” exon boundaries based on alignments with complementary DNA (cDNA) and protein sequences from the query organism. Finally, we built a module that assembled the edited exons, translated them into final protein sequences, and generated a new set of requests for final comparison with nonredundant public proteins and all available genomic proteins.
Eukaryotic Annotation Strategy
The steps listed above added the general functionality necessary for MAGPIE to be used as a eukaryotic genome annotation system. To execute the annotation of the 2.91-Mb Adh region of Drosophila, we created a specific configuration of MAGPIE to run the following tools:
REPuter: (Kurtz and Schleiermacher 1999) (input = full genome) to find all forward, reverse, complement, and reverse complement repeats with length >50 bp.
Splitseq: (Gaasterland and Sensen 1996) (input = full genome) to split the input sequence into 65 50,000-base contiguous sequences (contigs) each overlapping with the next by 10,000 bases.
Calypso: (Fields 1999) (input = 65 50-kb subsequences) to identify tandem repeats.
GENSCAN: (Burge and Karlin 1998) (input = 65 50-kb subsequences) to identify exons and assemble them into translatable DNA.
BLASTX: (Altschul et al. 1997) sequence comparison against nonredundant protein databases (input = 65 50-kb subsequences), to identify protein matches both inside and outside predicted exon regions.
BLASTP: against nonredundant protein databases (input = 551 predicted proteins), to find pairwise matching proteins.
BLASTN: against nonredundant GenBank sequences (input = DNA sequences for 551 predicted proteins), to find pairwise matching genes.
BLASTN: against Drosophila EST and cDNA sequences (input = DNA sequences for 551 predicted proteins), to confirm exons.
FASTA: (Pearson 2000) against proteins from each complete genome (input = 551 predicted proteins), to find genomic distribution of matching proteins.
TBLASTN: against the input genome (input = top protein matches for the 184 of 551 proteins that had a match in the nonredundant databases), to find missing exons and extra, overpredicted exons.
BLASTP: against the predicted proteins (input = top protein matches for the 184 of 551 proteins that had a match in the nonredundant databases), to find portions of the known proteins that were not covered by predicted protein sequence.
TBLASTN: against the Drosophila cDNA and EST sequences (input = top protein matches for the 184 of 551 proteins that had a match in the nonredundant databases), to identify whether cDNA and EST sequences matched protein boundaries or internal regions.
BLASTP: against the nonredundant sequence databases (input = 53 predicted proteins whose DNA sequences had exact cDNA matches), to confirm that entire protein domains were matched by the predicted proteins and that intron–exon splice sites were correct.
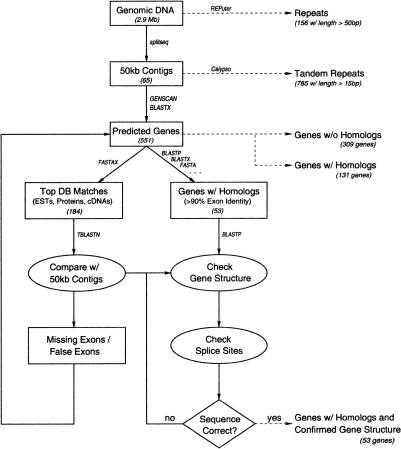
Figure 1 shows the flowchart for executing this analysis strategy. At each stage of the analysis, output at the right of the flowchart was stored in MAGPIE relational tables for further report generation. The REPuter output identified all repeats >50 bp (a threshold that we selected) throughout the 2.91-Mb contig. The Calypso output identified tandem repeats, which we mapped to gene locations together with REPuter repeats in a new repeat report. GENSCAN generated 550 sets of predicted exons, with promoters, terminators, protein sequence translations, and a score indicating confidence that the genes were real. The subsequent BLAST and FASTA analysis of each encoded protein sequence divided the GENSCAN predictions into the following sets: 309 with no evidence beyond GENSCAN prediction; 131 confirmed by protein sequence matches or partial cDNA or EST matches; and 53 confirmed by full-length cDNA sequence matches. These last 53 predicted proteins all matched a full-length Drosophila protein sequence as well, because full-length cDNAs are translated into the public nonredundant protein sequence databases. The best protein matches for the 184 (131 + 53) predicted proteins with evidence were extracted and configured as a group to be compared as queries against the Drosophila genome. This step led to intron–exon boundary adjustments for every encoded protein with evidence.
Figure 1.
Eukaryotic genome analysis strategy.
Example: The Calcium-Ion Channel Region
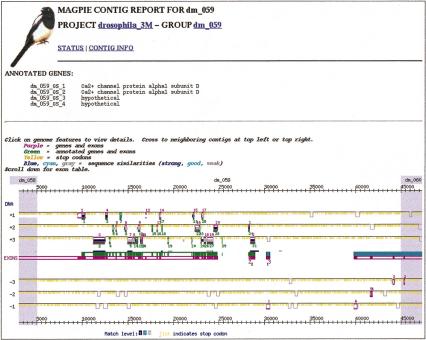
Figure 2 illustrates the results of the annotation process. It shows a visual display of predicted exons and refined exons for a gene encoding a calcium-ion channel protein. The initial GENSCAN predictions are shown in pink starting at the left. The display runs off to the previous 50-kb subsequence because the GENSCAN tool included exons from the previous subsequence in the gene. The refined exons are shown in green. Each exon is displayed both in the middle and in its translation frame, with respect to the in-strand beginning of the 50-kb subsequence. Pink numbers indicate GENSCAN exons in order; green numbers apply to refined exons. Note that GENSCAN predicted an additional gene with two exons downstream of the predicted calcium-ion channel exons, numbered in pink as 2_2. The reverse similarity step of the analysis indicated that these two exons should be joined with the previous set as encoding the carboxy-terminal end of a single amino acid sequence. Two additional coding regions with no evidence beyond GENSCAN prediction are shown on the reverse strand in dark pink, labeled as 1_3 and 6_4 (label not in Fig. 2). The calcium-ion channel coding region was the most complicated in the entire genome in terms of number and size of exons.
Figure 2.
Annotated features in contig 59 of 50-kb subsequences. The 31 exon coding region labeled dm_059_2 encodes a calcium-ion channel protein.
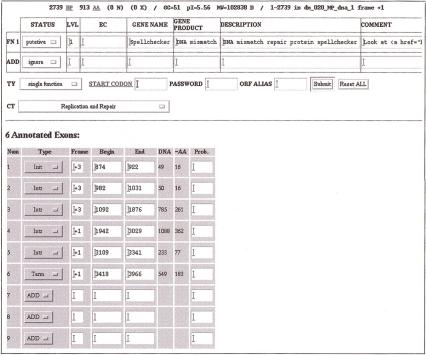
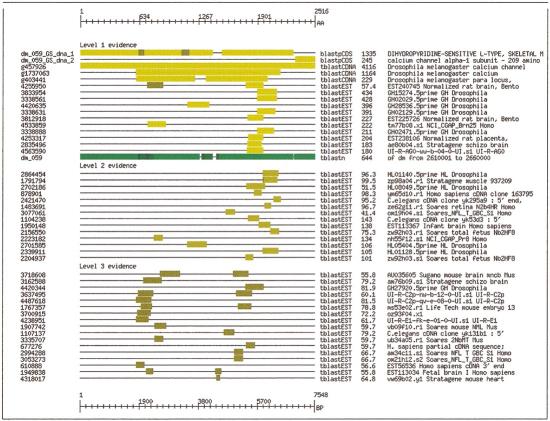
Figure 3 shows the evidence collected when the best matching protein sequence for the calcium-ion channel protein was used as a query against the 2.91-Mb genomic contig, the assembled exons, and the EST and cDNA sequence databases. Portions of the query protein sequence, represented as a ruler across the top of the diagram, failed to match the translated predicted proteins. Matches with the translated proteins are labeled on the left as dm_059_1 and dm_059_2. Notice that this pair of matches indicates that these two GENSCAN predictions should be merged into a single coding region. Comparing the query sequence against the cDNA sequences revealed a full-length match and confirmed that the two sets of exons should be merged. Comparison against the genomic DNA, shown in green, indicates that the full query protein sequence maps completely to the genomic sequence. This match meant that without an automated exon-boundary refinement tool, such as that provided in GeneWise (Birney 1999), the exon boundaries would need to be refined manually, which we did, using the form shown in Figure 5, below. The resulting combined gene corresponds to BG:DS02795.1 (Ca-α1D) (Ashburner et al. 1999).
Figure 3.
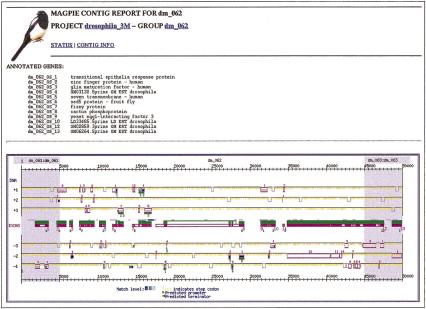
Annotated features in contig 63 of 50-kb subsequences. Of 13 proteins are encoded, 8 are functionally annotated and 4 are confirmed by ESTs. Individual exons are shown in series in the middle of the graphic and in frame top and bottom.
Figure 5.
Screen shot of annotation form. Exon boundaries and multiple functions can be edited and saved on the annotation database for further querying.
Example: A Well-Annotated Region
Figure 4 shows a well-annotated region of the Drosophila genome. The 50-kb subsequence contains 13 predicted coding regions, some on the negative strand, others on the positive strand. The exons for three proteins in the region, labeled as dm_062_6 (6_2), dm_062_7 (7_5), and dm_062_8 (8_6), were confirmed with full-length cDNA sequences and refined via reverse-BLAST against the protein sequences. Four of the remaining proteins were confirmed and functionally annotated through protein sequence similarities. The genes for the remaining four proteins were validated with matches against Drosophila EST sequences. These genes correspond to genes BG:DS02740.12 (Sed5), BG:DS02740.14 (fzy), and BG:DS02740.15 (cact) (Ashburner et al. 1999).
Figure 4.
Evidence shows missing and mispredicted exons for the calcium ion channel protein. The first gap in the first row indicates that exons from the next predicted gene should be merged with the calcium-ion channel gene.
Combining Evidence for Individual Decisions
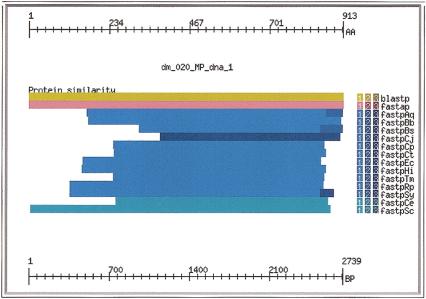
Figure 5 shows an overview of the evidence gathered for the DNA mismatch repair protein predicted in subsequence dm_029 of the input genome, labeled as BG:DS02740.15 and “Spellchecker” by Ashburner et al. (1999). The protein matched a nonredundant protein sequence from beginning to end with both BLASTP (yellow) and FASTA (pink). In addition, it matched proteins from 11 bacterial genomes (Aquifex, Borrellia, Bacillus, Camphylobacter, two Chlamydia, E. coli, Haemophilus, Treponema, Rickettsia, and Synechocystis sp.) and two eukaryotic genomes (Caenorhabditis elegans and Saccaromyces cerevisiae). The query Drosophila sequence matched the yeast sequence nearly entirely. The other genomic matches missed 200 or more of the amino-terminal amino acids. Figure 6 shows the complete display of the high-quality matches for the query sequence, represented at the top of the display with an amino acid sequence ruler.
Figure 6.
Evidence summary for DNA mismatch repair protein showing matches in 11 bacterial genomes (blue) and 2 eukaryotic genomes (cyan).
Genomic Signatures for 53 Confirmed Proteins
We incorporated genomic signatures into the MAGPIE report for the 53 proteins whose exon boundaries were refined using full-length cDNA matches. Figure 8 shows the signatures together with the final protein functional annotations. Only 2 of the 52 proteins had matches only in archaeal and eukaryotic genomes: One was DNA-directed RNA polymerase II, and the other was RNA polymerase I elongation factor, consistent with observations in the yeast (Ragan and Gaasterland 1998) and archaeal genomes (Gaasterland and Ragan 1998) that proteins shared exclusively between archaea and eukaryotes tend to be involved in translation and transcription. Four proteins were conserved across all three phylogenetic domains: glutamic acid decarboxylase, alcohol dehydrogenase, “shuttle craft transcription factor,” and acyl-phosphatase. Note that the latter protein had no eukaryotic match outside Drosophila in C. elegans or yeast. An additional five proteins were shared with bacterial genomes and other eukaryotes. Twenty-six proteins matched a combination of yeast and C. elegans but no archaeal or bacterial genome. Finally, 16 cDNA-confirmed Drosophila proteins matched nothing in any of the 23 target genomes.
Figure 8.
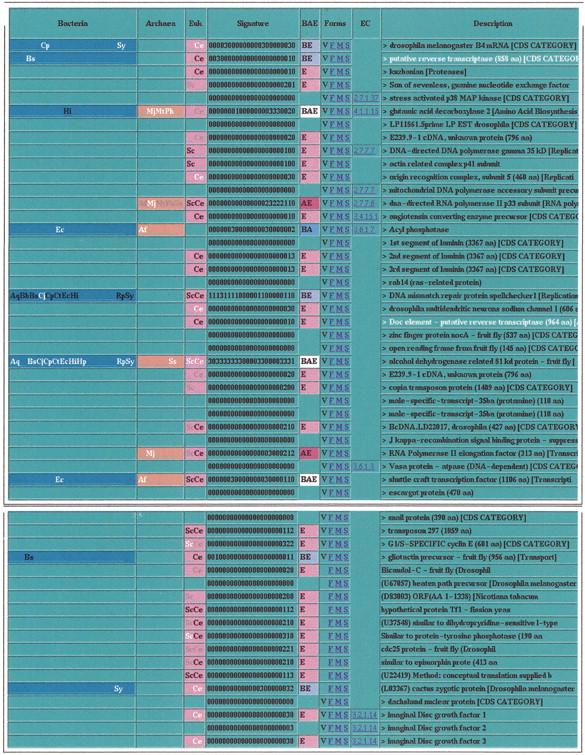
Bacterial, archaeal, eukaryotic genomes matched by each gene product with cDNA or protein sequence verified exon boundaries.
Data Collection and Manual Annotation Time
Table 1 shows the numbers of seconds spent running each tool in the analysis configuration. A total of 1,515,756 CPU seconds (1515756 sec = 25263 min = 421 hr = 17.5 days) were spent collecting and parsing 5483 individual analysis outputs automatically.
Table 1.
Automated Data Collection Run Times for Each Tool and Total
| Tool | Sec/tool | Responses | Total sec |
|---|---|---|---|
| GENSCAN | 1800 | 65 | 117000 |
| BLASTX nr | 8880 | 65 | 577200 |
| BLASTN nt | 960 | 65 | 62400 |
| BLASTN EST | 360 | 65 | 23400 |
| FASTA dmEST | 120 | 65 | 7800 |
| FASTA dmcDNA | 8 | 65 | 520 |
| REPORTS | 120 | 65 | 7800 |
| Subtotal | 455 | 822120 | |
| BLASTX nr | 400 | 841 | 336400 |
| Subtotal | 4205 | 336400 | |
| BLASTNAdh | 8 | 551 | 4408 |
| TBLASTN cDNA | 4 | 551 | 2204 |
| BLASTP CDS | 1 | 551 | 551 |
| FASTAX nr | 480 | 551 | 264480 |
| REPORTS | 60 | 551 | 33060 |
| Subtotal | 2755 | 304703 | |
| TBLASTNAdh | 2 | 184 | 368 |
| BLASTP CDS | 1 | 184 | 184 |
| FASTAP CDS | 1 | 184 | 184 |
| REPORTS | 60 | 184 | 11040 |
| Subtotal | 736 | 11776 | |
| TBLASTN cDNA | 4 | 53 | 106 |
| TBLASTX cDNA | 12 | 53 | 636 |
| BLASTN cDNA | 4 | 53 | 106 |
| BLASTNAdh | 8 | 53 | 212 |
| BLASTP CDS | 1 | 53 | 53 |
| FASTAP nr | 480 | 53 | 25440 |
| FASTA 26 genomes | 8 | 1378 | 11024 |
| REPORTS | 60 | 53 | 3180 |
| Subtotal | 1537 | 40757 | |
| Total | 5483 | 1515756 |
Run times and totals were determined using Ultrasparc 336-mHz CPUs writing to disk via an UltraSCSI fast-and-wide connection.
Table 2 shows the total amount of time spent manually annotating the functions and exon boundaries for proteins predicted by GENSCAN based on the evidence collected above. The full annotation required a total of 1966 person min (1966 min = 33 hours = 5.5 workdays) in addition to the CPU seconds listed above. In practice, the work was distributed over a cluster of 21 Sun Ultrasparc 336 megahertz CPUs with UltraSCSI fast-and-wide connections to local disk arrays, interconnected via gigabit and 100 BaseT ethernet links.
Table 2.
Total Manual Confirmation and Editing Times via MAGPIE Forms
| Activity | Min/CDS | CDSs | Total min |
|---|---|---|---|
| db matches → exon regions | 5 | 184 | 920 |
| Exon regions → splice site | 15 | 53 | 795 |
| db matches → function | 1 | 551 | 551 |
| Total | 788 | 1966 |
(db) Database; (CDS) coding sequence.
DISCUSSION
In the 6 weeks from the opening of the genome annotation competition to the submission deadline, we designed and implemented a new set of modules, called EGRET (for Eukaryotic Genome Rapid Evaluation Tool), to enable the MAGPIE genome annotation system to handle eukaryotic genome sequence data. Once the software modules were in place, we configured the system to collect gene predictions, EST, cDNA and protein sequence similarities, and functional protein sequence patterns. The system executed an automated functional annotation, and our annotation team performed manual exon refinement and a final manual confirmation of function annotations. The new software modules, EGRET, were implemented and run as separate new programs compatible with the original microbial MAGPIE. It remains to integrate the new modules into the entire system so that a full eukaryotic genome can be accepted as input and processed from beginning to end without human intervention. The EGRET modules are available through the Rockefeller University, and the MAGPIE modules are available through Argonne National Laboratory and the National Research Council of Canada.
The integrated EGRET system provides biologists with a useful tool to perform annotation of functional and genomic features of megabases of eukaryotic sequence data. We are currently in the process of designing and implementing a hardware architecture for supporting the timely application of the new eukaryotic genome annotation system, built for this competition, to full eukaryotic genomes.
Figure 7.
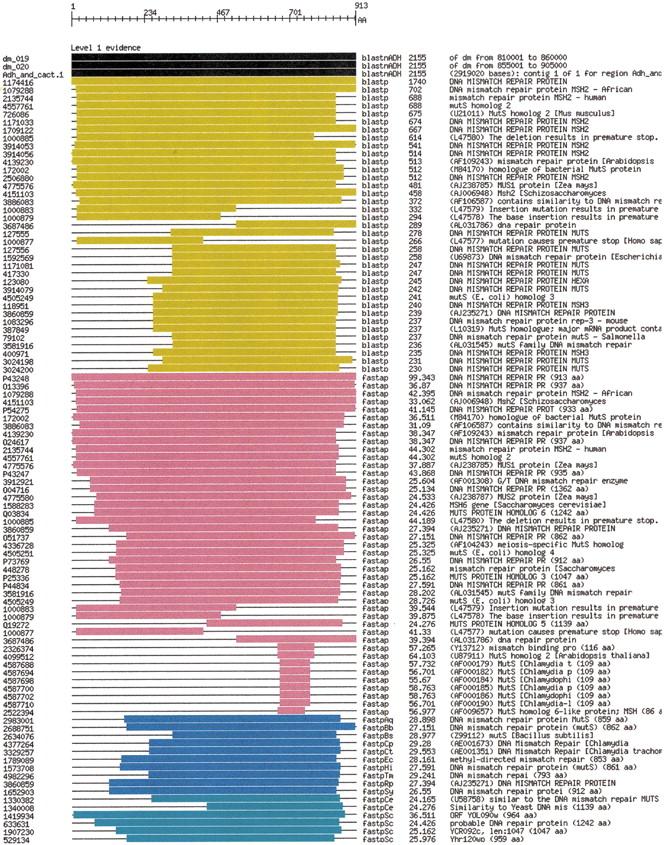
Full evidence view for DNA mismatch repair protein.
Acknowledgments
This is a National Research Council of Canada (NRCC) publication 42319.
Footnotes
E-MAIL gaasterl@genomes.rockefeller.edu; FAX (212) 327-7765.
REFERENCES
- Ashburner M, Misra S, Roote J, Lewis SE, Blazej R, Davis T, Doyle C, Galle R, George R, Harris N. An exploration of the sequence of a 2.9-Mb region of the genome of Drosophila melanogaster: The Adh region. Genetics. 1999;153:179–219. doi: 10.1093/genetics/153.1.179. [DOI] [PMC free article] [PubMed] [Google Scholar]
- Attwood T, Flower D, Lewis A, Mabey J, Morgan S, Scordis P, Selley J, Wright W. {PRINTS} prepares for the new millennium. Nucleic Acids Res. 1999;27:220–225. doi: 10.1093/nar/27.1.220. [DOI] [PMC free article] [PubMed] [Google Scholar]
- Altschul S, Madden T, Schaffer A, Zhang J, Miller W, Lipman D. Gapped BLAST and PSI-BLAST: A new generation of protein database search programs. Nucleic Acids Res. 1997;25:3389–3402. doi: 10.1093/nar/25.17.3389. [DOI] [PMC free article] [PubMed] [Google Scholar]
- Birney, E. 1999. http://www.sanger.ac.uk/software/wise2/.
- Burge C, Karlin S. Finding the genes in genomic DNA. Curr Opin Struct Biol. 1998;8:346–354. doi: 10.1016/s0959-440x(98)80069-9. [DOI] [PubMed] [Google Scholar]
- Deckert G, Warren P, Gaasterland T, Young W, Lenox A, Graham D, Overbeek R, Snead M, Keller M, Aujay M, Huber R, Feldman R, Short J, Olsen G, Swanson R. The complete genome of the hyperthermophilic bacterium Aquifex aeolicus. Nature. 1998;392:353–358. doi: 10.1038/32831. [DOI] [PubMed] [Google Scholar]
- Fields, D. 1999. Calypso tandem repeat finder.
- Gaasterland T, Lobo J. Qualifying answers according to user needs and preferences. Fundamenta informatica. 1997;32:121–137. [Google Scholar]
- Gaasterland T, Ragan M. Constructing multigenome views of whole microbial genomes. J Microbial Comp Genomics. 1998a;3:177–192. doi: 10.1089/omi.1.1998.3.177. [DOI] [PubMed] [Google Scholar]
- ————— Phyletic and functional patterns of distribution among prokaryotes. J Microbial Comp Genomics. 1998b;3:199–217. doi: 10.1089/omi.1.1998.3.199. [DOI] [PubMed] [Google Scholar]
- Gaasterland T, Sensen CW. Fully automated genome analysis that reflects user needs and preferences—A detailed introduction to the magpie system architecture. Biochimie. 1996;78:302–310. doi: 10.1016/0300-9084(96)84761-4. [DOI] [PubMed] [Google Scholar]
- Henikoff J, Henikoff S, Pietrokovski S. New features of the blocks database servers. Nucleic Acids Res. 1999;27:226–228. doi: 10.1093/nar/27.1.226. [DOI] [PMC free article] [PubMed] [Google Scholar]
- Hofmann K, Bucher P, Falquet L, Bairoch A. The PROSITE database, its status in 1999. Nucleic Acids Res. 1999;27:215–219. doi: 10.1093/nar/27.1.215. [DOI] [PMC free article] [PubMed] [Google Scholar]
- Kurtz S, Schleiermacher C. Reputer—Fast computation of maximal repeats in complete genomes. Bioinformatics. 1999;15:426–427. doi: 10.1093/bioinformatics/15.5.426. [DOI] [PubMed] [Google Scholar]
- Marcotte EM, Pellegrini M, Ng H-L, Rice DW, Yeates TO, Eisenberg D. Detecting protein function and protein-protein interactions from genome sequences. Science. 1999;285:751–753. doi: 10.1126/science.285.5428.751. [DOI] [PubMed] [Google Scholar]
- Pearson W. Flexible sequence similarity searching with the fasta3 program package. Methods Molec Biol. 2000;132:185–219. doi: 10.1385/1-59259-192-2:185. [DOI] [PubMed] [Google Scholar]
- Ragan M, Gaasterland T. A prokaryotic view of the yeast genome. J Microbial Comp Genomics. 1998;3:219–235. doi: 10.1089/omi.1.1998.3.219. [DOI] [PubMed] [Google Scholar]
- Romine M, Stilwell L, Wong K-K, Thurston S, Sisk E, Sensen CW, Gaasterland T, Saffer J, Frederickson J. Complete sequence of a 184 kb catabolic plasmid from Sphingomonas aromaticivorans strain F199. J Bacteriol. 1999;181:1585–1602. doi: 10.1128/jb.181.5.1585-1602.1999. [DOI] [PMC free article] [PubMed] [Google Scholar]


