

Abstract
Her4 is a transmembrane receptor tyrosine kinase belonging to the ErbB-EGFR family. It plays a vital role in the cardiovascular and nervous systems, and mutations in Her4 have been found in melanoma and lung cancer. The kinase domain of Her4 forms a dimer complex, called the asymmetric dimer, which results in kinase activation. Although a crystal structure of the Her4 asymmetric dimer is known, the dimer affinity and the effect of the subsequent phosphorylation steps on kinase domain conformation are unknown. We report here the use of carboxyl-group footprinting MS on a recombinant expressed, Her4 kinase-domain construct to address these questions. Carboxyl-group footprinting uses a water-soluble carbodiimide, 1-ethyl-3-(3-dimethylaminopropyl)carbodiimide, in the presence of glycine ethyl ester, to modify accessible carboxyl groups on glutamate and aspartate residues. Comparisons of Her4 kinase-domain monomers versus dimers and of unphosphorylated versus phosphorylated dimers were made to map the dimerization interface and to determine phosphorylation induced-conformational changes. We detected 37 glutamate and aspartate residues that were modified, and we quantified their extents of modification by liquid chromatography MS. Five residues showed changes in carboxyl-group modification. Three of these residues are at the predicted dimer interface, as shown by the crystal structure, and the remaining two residues are on loops that likely have altered conformation in the kinase dimer. Incubating the Her4 kinase dimers with ATP resulted in dramatic increase in Tyr-850 phosphorylation, located on the activation loop, and this resulted in a conformational change in this loop, as evidenced by reduction in carboxyl-group modification. The kinase monomer-dimer equilibrium was measured using a titration format in which the extent of carboxyl-group footprinting was mathematically modeled to give the dimer association constant (1.5–6.8 × 10¹² dm2/mol). This suggests that the kinase-domain makes a significant contribution to the overall dimerization affinity of the full-length Her4 protein.
Her4 (also called ErbB-4) is a transmembrane receptor tyrosine kinase belonging to the ErbB-Epidermal Growth Factor Receptor (EGFR) family; it plays a vital role in the cardiovascular system, nervous system, and other tissues (1, 2). Genetic knock-out of Her4 in mice results in embryonic lethality because of malformations of the heart and hindbrain (3). Cancer-associated mutations in Her4 were found in malignant melanoma and lung adenocarcinomas (4, 5).
The structure of Her4 consists of an extracellular domain that mediates ligand binding, a transmembrane domain, a short intracellular juxtamembrane domain, a tyrosine kinase domain and a C-terminal-tail domain that contains multiple autophosphorylation sites (6). As with other receptor tyrosine kinases, ligand binding stimulates Her4 dimerization, which results in activation of its tyrosine-kinase domain and autophosphorylation of multiple Tyr residues (6–8). Biophysical and protein crystallography studies demonstrate that residues in both the extracellular domain and in the intracellular portion (kinase domain and juxtamembrane domain) contribute to full-length ErbB protein dimerization (9–14). Studies of the isolated extracellular domain provide the extracellular domain dimerization affinity (10), but analogous studies on the intracellular portions of Her4 are lacking.
A critical question in the ErbB-EGFR field is how receptor dimerization translates into activation of the tyrosine kinase domain. A landmark study on EGFR showed that the isolated EGFR kinase domain can form dimers that activate the tyrosine kinase by an allosteric mechanism (9). This model of ErbB-EGFR kinase activation, which is called the Asymmetric Dimer model, applies in vivo to the entire ErbB family, including Her4 (11, 12, 15, 16). The kinase dimers are called asymmetric dimers because they are formed by a contact between surfaces on the C-lobe of one kinase monomer (termed the donor) and the N-lobe of the other kinase monomer (termed the acceptor). Several important questions remain about this model including, (1) what is the dimerization affinity of the asymmetric kinase dimer, (2) what is the conformation of these kinase dimers on the surface of a lipid membrane, (3) how do these conformations change when different ErbB-EGFR family members form heterodimers, and (4) how does the subsequent phosphorylation step affect the conformation of the Her4 kinase domain? In this paper, we combined a reconstituted, in vitro model system with MS-based footprinting to address these questions.
Protein footprinting has rapidly developed over the past 20 years (17). Notable approaches include acetylation (18), amide hydrogen/deuterium exchange (H/DX) (19), and hydroxyl radical footprinting (20). MS-based footprinting methods have been successful for monitoring protein folding and unfolding dynamics (21), characterizing protein-ligand interaction (22, 23), and protein oligomerization (24). For probing complicated systems, such as membrane-associated proteins, H/DX suffers limitations because of significant back exchange accompanying the demanding postlabeling purification. For hydroxyl radical based footprinting, an extra purification step (e.g. SDS-PAGE) may lead to false readouts induced by post footprinting oxidations(25). Nevertheless, improvements in H/DX (26) and hydroxyl radical based footprinting (27, 28) show promise in probing membrane proteins.
One alternative to H/DX and hydroxyl-radical footprinting is the labeling of carboxyl side chains by 1-ethyl-3-(3-dimethylaminopropyl)carbodiimide (EDC)-mediated incorporation of glycine ethyl ester (GEE) (see Fig. 1A)(29). The coupling reaction is efficient in biologically relevant buffer systems (30), biological mixtures can be directly modified without preseparation of the proteins affording an opportunity to probe proteins in their native state, and irreversibly modified products can survive intensive postlabeling purification. We previously applied this carboxyl-group footprinting method to determine the orientation of the FMO antenna protein within the native photosynthesis complex of a green sulfur bacterium (31).
Fig. 1.

A, Footprinting by carboxylic-acid, side-chain modification. Carbodiimide (EDC) modifies acid side chain of proteins in physiological relevant buffer. In the presence of nucleophiles (glycine ethyl ester), reaction occur to give mass shifts 85.0522 Da and 57.0209 Da (hydrolysis product of ester). B, Work flow of MS based carboxyl group protein footprint (1) Modification (2) ESI-MS analysis of modified protein (3) In-gel separation and proteolytic digestion (4) LC-MS analysis of peptides (5) LC-MS/MS analysis of peptides (6) calculation of modification extent.
In this article, we show that carboxyl-group footprinting can be used to study the conformational changes of recombinantly expressed Her4 kinase-domain (residues 677–1004) upon dimerization or phosphorylation. We take advantage of a previously developed, in vitro model system to study the activation mechanism of Her4's tyrosine kinase activity (15). In this model, the isolated Her4 kinase-domain contains an N-terminal polyhistidine (His6) tag and is incubated with liposomes that contain a synthetic lipid with a nickel-chelating headgroup. This provides orientated binding of the kinase-domain protein construct on the liposome surface (32, 33). The surface binding also increases the local concentration of the Her4 kinase-domain to allow dimer formation, which mimics the behavior of full-length Her4 in vivo after ligand binding (15). This model system was previously applied to the isolated EGFR kinase domain to produce EGFR kinase dimers in vitro and provided critical data to support the Asymmetric Dimer model (9).
Specifically, we seek to identify the acidic residues at the binding interface of the Her4 kinase domain dimer by using the Her4 in vitro model system and carboxyl-group footprinting. To our knowledge, the “solution” structure of the isolated Her4 kinase-domain dimer has not yet been probed. Although the crystal structure of the Her4 kinase-domain dimer is known (11), it relies upon crystal-packing (solid-state) interactions among kinase monomers to infer the dimer structure. The relevance of the inferred crystallographic dimer remains to be established. Furthermore, growing MS evidence demonstrates that EGFR-ErbB kinases can be phosphorylated in vivo and in vitro on their activation loops (8, 34–39), but no crystal structures of the activation loop phosphorylated EGFR-ErbB kinases exist. Applying carboxyl-group footprinting, we can probe the conformational changes induced by Her4 activation loop phosphorylation at Tyr-850.
We also seek to determine the affinity of protein dimerization on a lipid membrane surface, which is a challenging biophysical problem. Through a novel modification of our SIMSTEX method (Self-association Interactions using Mass spectrometry, Self-Titration and H/D Exchange)(24), we are able to use a self-titration platform whereby the extent of carboxyl-group footprinting as a function of concentration can be modeled to give the dimerization affinity of the isolated Her4 kinase-domain dimer. This dimer association constant is an important gauge of the Her4 kinase-domain's contribution to the overall dimerization of the full-length Her4 protein.
EXPERIMENTAL PROCEDURES
Chemicals and Reagents
Dioleoyl-phosphatidylcholine (DOPC) and nickel-1,2-dioleoyl-sn-glycero-3-([N-(5-amino-1-carboxypentyl)iminodi acetic acid]succinyl)-nickel salt (Ni-NTA-DOGS) were purchased from Avanti Polar Lipids (Alabaster, AL). Water, acetonitrile, formic acid, glycine ethyl ester, EDC1 (1-ethyl-3-(3-dimethylaminopropyl) carbodiimide hydrochloride, ammonia acetate, trypsin from porcine pancreas were from Sigma-Aldrich (St. Louis, MO). The peptides LLEGDEKEYNADGGK and LLEGDEKEY(Phos)NADGGK were synthesized by GenScript USA Inc. (Piscataway, NJ).
Protein Expression and Liposome Preparation
The protocols for Her4 kinase-domain protein expression using baculoviral vectors and Sf9 cells and for liposome preparation using the extrusion method were previously reported by us (15). Briefly, the Her4 kinase-domain (residues 677–1004) was cloned into pFastBacHT vector, and the recombinant baculovirus was made following the Bac-to-Bac protocol (Invitrogen). Sf9 cells were infected with this baculovirus at one multiplicity of infection and were harvested after 48 h. The His6-tagged Her4 kinase-domain was purified in two steps using Ni-NTA-beads followed by gel-filtration chromatography. Her4 residue numbering is based on the mature, full length protein minus its signal peptide and matches the numbering used by Qiu et al. (11).
Liposomes were prepared by the reverse-phase method of Papahadjopoulos (40) followed by extrusion through a mini-extruder (Avanti Polar Lipids) with 200-nm polycarbonate membranes. This generated small unilamellar vesicles (SUV) whose diameter was 180–190 nm (measured by dynamic light scattering). Nickel-liposomes were SUV's containing 95 mol% DOPC and 5 mol% Ni-NTA-DOGS, whereas control liposomes were SUV's containing 100 mol% DOPC.
Protein Dimerization and Phosphorylation
Protein stock solutions contained 20 mm Tris-HCl, 150 mm NaCl, 1 mm dithiotreitol (DTT) (pH 8.0). Dimerization experiments were started by equilibrating protein with nickel liposomes for 15 min on ice. Protein phosphorylation was initiated by adding ATP and MgCl2 to the dimer solution (final concentration 100 μm ATP and 10 mm MgCl2). After 5 min incubation on ice, phosphorylation samples were taken for GEE modification.
Carboxyl-Group Modification Reaction
A Her4 sample (10 μl of 2.5 μm) in 20 mm Tris-HCl, 100 mm NaCl, pH 7.5 in 0.5 ml Eppendorf protein LoBind tube (Eppendorf North America, Hauppauge, NY) were prepared for the modification reaction. GEE stock solutions (2 m in 0.5 μl of water) with 0.5 μl EDC stock solution (50 mm in water) were mixed to initiate the reaction. The reaction was quenched at 10 min by adding an equal volume of 1 m ammonium acetate. Synthetic peptides (5 nm) in 20 mm Tris-HCl, 100 mm NaCl, pH 7.5 were as above. In titration experiments, Her4 samples with protein concentrations (from 0.0375 to 1.25 μm) were used.
Gel Separation and In-Gel Trypsin Digestion
Immediately after quenching the carboxyl-group modification by adding ammonium acetate, 5× SDS-PAGE sample-loading buffer, containing DTT as the reducing reagent, was mixed with each sample, and the mixture was boiled for 3 min. The samples were loaded onto 10% SDS-PAGE gel and detected by SimplyBlue SafeStain (Invitrogen, Carlsbad, CA). In-gel digestion was performed as per Shevchenko et al. (41) with modification of the peptide extraction steps. Extraction buffer A (5% formic acid, 0.1% trifluoroacetic acid, and 50% acetonitrile in water) was added to each tube (solution:gel = 2:1 v/v), the tube shaken in a Thermomixer (Eppendorf North America) at room temperature for 10 min, and supernatant collected in an Eppendorf protein LoBind tubes. A second extraction was similar, using extraction buffer B (5% formic acid and 0.1% trifluoroacetic acid in acetonitrile). The supernatants were combined and dried with a speed vacuum.
ESI-MS of Her4 Protein
ESI mass spectra were acquired in the positive-ion mode on a Waters (MicroMass) Q-TOF Ultima (Manchester, U.K.) equipped with a Z-spray ESI source. The Instrument parameter setup and the trap-column desalting were reported previously (18).
Circular Dichroism
Samples of Her4 for which the carboxyl group was either unmodified or modified were dialyzed into CD Buffer (10 mm NaPO4, pH = 7.2, 5 mm NaCl) by using Amicon Ultra 10k spin-concentrators and centrifuging the samples to ∼100 μl and filling the concentrator with CD Buffer three times. The samples, ∼2 μm, were transferred to a 1-mm path-length quartz cell. CD spectra were measured at room temperature from 195 to 260 nm wavelengths at 1-nm intervals by a JASCO J715 CD spectrometer (JASCO Analytical Instruments, Tokyo, Japan). Three scans were taken and averaged, then corrected with a buffer blank. The protein concentration was determined by the Bradford assay using BSA as a standard.
LC-ESI-MS/MS of Her4 Tryptic Peptides
Peptide samples from the in-gel digestion were reconstituted with 20 μl water containing 0.1% trifluoroacetic acid. C18 zip tips (Millipore Co., Billerica, MA) were used to remove salts. The peptide sample was extracted with 75% aqueous acetonitrile containing 0.1% trifluoroacetic acid and dried by speed vacuum. The tryptic-peptide residue was reconstituted with 15 μl solvent A (water, 0.1% formic acid). An aliquot (5 μl) was injected by Eksigent NanoLC-Ultra 1D (Eksigent Technologies, Inc. Livermore, CA) into a custom-packed nano column. This reverse-phase nano column was custom-built by packing C18 material (Magic, 5 μm, 120 Å, Michrom Bioresources, Inc., Auburn, CA) into silica capillary tubing with a PicoFrit tip (75 μm × 200 mm, New Objective, Inc., Woburn, MA). The gradient was from 2% to 60% solvent B (acetonitrile, 0.1% formic acid) over 60 min at 260 nL/min. The gradient was followed by a 10 min 80% solvent B wash and a 12 min re-equilibration with 100% solvent A. A PicoView Nanospray Source (PV550, New Objective, Inc., Woburn, MA) was used with an LTQ Orbitrap (Thermo-Scientific, San Jose, CA). The nano electro-spray parameters were tuned by direct infusion of an Angiotensin II solution (10 μg/ml, 70% solvent A, 30% solvent B). Liquid chromatography MS (LC-MS) data were acquired in standard data-dependent mode controlled by Xcalibur 2.0.7 software. Peptide mass spectra (m/z range: 350–2000) were acquired at high mass resolving power (60,000 for ions of m/z 400). The six most abundant ions were fragmented by collision-induced dissociation (CID) in the linear ion trap (isolation width, 2 Da; activation time, 30 ms; normalized collision energy, 35%; minimum ion counts, 1000). The mass calibration was checked and repeated frequently by using a standard calibration mixture of caffeine, short peptide MRFA, and Ultramark 1621.
Database Searching of LC-MS/MS Results
Each product-ion mass spectrum was extracted from the raw data file by DTA creator of Rosetta Elucidator (v3.3.0.0.220, Rosetta Biosoftware, Seattle, WA). The combined dta files were searched by using Mascot (version 2.2.06, Matrix Science, London, UK) against a custom-built database containing His6-tagged Her4 kinase-domain sequence. The custom-built database was established by adding all analysis targets of our lab (30–40 entries) into the E. coli database (∼39,000 entries from NCBI nr database). Custom-built modification profiles (all carboxyl-group modification products), phosphorylation (tyrosine, threonine and serine) and oxidation (methionine, tryptophan and histidine) were used as variable modifications. Carbamidomethylation of cysteine was considered in the database searching as a fixed modification. The other parameters in Mascot searching were: enzyme, trypsin; maximum number of missed cleavage, one; peptide mass tolerance, 15 ppm; 13C isotopic peak consideration, one; product-ion mass tolerance, 0.8 Da; instrument type, ESI-trap.
Data Processing
Raw format data were loaded onto the Rosetta Elucidator (v3.3.0.0.220, Rosetta Biosoftware, Seattle, WA). The alignment retention times and peak areas were determined by using the Elucidator PeakTeller algorithm (parameters were default). Dynamic background subtraction and smoothing across the alignment window (both in retention time and m/z dimensions) were used. All features were assigned a feature ID; a product-ion mass spectrum was associated with a feature by judging the retention time and precursor m/z; the outcome of Elucidator was further processed by using an Excel macro written in our lab. Modification extents were calculated using the peak areas of all extracted ion chromatogram features.
Equilibria Modeling
The inference of the Her4 dimerization association constant on the surface of the liposome relied on a bulk-solution model, which was later reinterpreted to give the desired surface-binding constants. Specific binding (the law of mass action applies) and the principle of microscopic reversibility (42, 43) were assumed in the model. The strategy for model calculation was an extension from one dimension to two dimensions of the strategy employed by Zhu (44, 45).
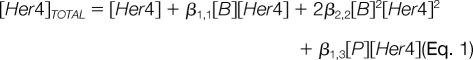
The equilibrium is described by mass conservation. The mass conservation law for the Her4 is shown in Eq. 1 where [Her4]TOTAL is the analytical concentration of Her4, and [Her4] is the solution concentration of the free monomer Her4.
 |
The overall Adair binding constant for attachment of the Her4 monomer to the liposome is given by β1,1 (β1,1 = K11; the term K11 was used in the results section); the overall Adair binding constant for the dimerization of the Her4 on the liposome surface is β2,2. The equivalent bulk concentration of the free nickel binding sites on the liposome surface is [B]. The model incorporated a provisional collection of parasitic binding sites for the Her4; these sites competed with the liposome binding and removed Her4 from the detection path. The equivalent bulk solution concentration of the free form of these sites is [P]. The total nickel binding sites on the liposomes has an equivalent bulk solution binding concentration of BMAX as shown in Eq. 2 for the corresponding mass conservation law for the nickel binding.
The parasitic binding sites also have an equivalent total bulk solution concentration PMAX and a corresponding mass conservation law as shown in Eq. 3.
The concentrations of the various bound species are given by their corresponding product terms in the above equations, and, their evaluation at each titration point requires knowledge of the free concentrations [Her4], [B], and [P]. There is no aspect of the experiment results that permits a simple inference of the free concentrations.
This situation is resolved in each trial of a nonlinear least squares search where unknown model parameters are posed. An indirect but constructive method was used to infer what the free concentrations at each titration point would have been given the posed model parameters. In each trial, a model titration curve is computed and compared with the experiment titration curve.
The method for calculating the free concentrations is based on the fact that the derivatives of the needed unknown function can be readily calculated in the situation of each trial. The method description begins by viewing Eqs 1 and 2 as components of the vector Eq 4, which expresses [Her4]TOTAL and BMAX as a function of [Her4] and [B].
 |
Calculation of free concentrations was achieved by evaluating the inverse function F⃗−1 in Eq 5, which expresses [Her4] and [B] as a function of [Her4]TOTAL and BMAX.
 |
The evaluation follows the trajectory of the titration experiment as it moves along a path l⃗(τ) in the [Her4]TOTAL × BMAX domain as described in Eq. 6.
 |
A total derivative with respect to the path variable τ, which marks off the progress of the titration, gives Eq. 7.
By the inverse function theorem (46, 47),
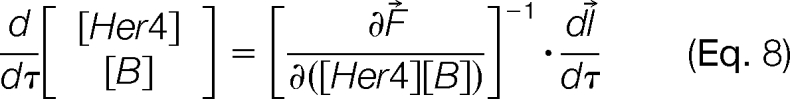 |
which can be viewed as a first-order, ordinary differential equation of a dynamical system, was solved with the “Rkadapt” function in Mathcad 14 (Parametric Technology Corporation, Needham, MA). The first leg of the path, which accounted for the addition of the binding sites on the liposomes to the system, moved from (0,0) to (0,BMAX) for the value of ([Her4]TOTAL,BMAX) for which the solution of ([Her4],[B]) moved trivially from the initial value of (0,0) to (0,BMAX). The more consequential second leg, which accounted for the titration with Her4, was given by (τ,BMAX), where τ varied over the domain interval of [Her4]TOTAL from zero to 17.3 μm. Rkadapt was set to record the solution for the second leg in a table of triples (τ,[Her4],[B]) for 5000 equal length intervals. The accuracy of the solution was checked by recalculating [Her4]TOTAL by Eq. 1 and BMAX by Eq. 2 from values for [Her4] and [B] extracted from the table. For the table triples, the relative error of the recalculated [Her4]TOTAL was typically less than 2 × 10⁻¹², and the relative error of the recalculated [B] was less than 1 × 10⁻¹³. For linear interpolations between consecutive table entries, the relative error of the recalculated [Her4]TOTAL typically varied from 2 × 10⁻³ at low concentrations to 1 × 10⁻⁶ at high concentrations for Her4 and the relative error of the recalculated [B] typically varied from 7 × 10⁻⁶ at low concentrations to 4 × 10⁻⁷ at high concentrations for Her4.
The signal function Fracmodified (Eq. 9) was constructed to represent the transfer function of the mass spectrometer and the following spectrum analysis.
 |
It was assumed that the spectral signals varied in proportion to the concentrations of their corresponding solution species. The numerator in Eq. 9 gives the concentrations of those species that were assumed to be modified by GEE. The factor f allows for a fraction of the Her4 dimer population to be modified despite the supposed protection. The remaining product term in the denominator represents the concentration of those Her4 molecules existing as dimers that were not modified. A relative sensitivity factor G accounts for the different sensitivities of the mass spectrometer to various peptides and their modified counterparts.
The inference of the Her4 dimerization association constant was accomplished by performing a nonlinear-least-square fit of a Fracmodified curve to the experimentally determined extents of modification plotted as the curve of the Her4 titration experiment. The search minimizes the root mean square of the residuals (Residual RMS). In each trial of the search for the fit, Eq. 8, was solved by using “known” fixed parameter values or trial parameter values posed by the Quasi-Newton algorithm of the “Minimize” function in Mathcad and a Fracmodified curve was calculated. Fixed parameters were K11, BMAX, and G,. The parameters K11 and BMAX were selected as described in the Results section. The parameter G was determined to have value of 1.1236 by using Arg 15N labeled Her4 as standard. The searched parameters were f, β2,2, β1,3, and PMAX. The equivalent bulk solution dimerization association constant K22 was computed by evaluating Eq. 10 after the fit by Fracmodified.
In Eq. 10, association constant K22 has units of M−1. The isolated Her4 kinase-domain dimerization, however, is occurring on the liposome surface and is formally expressed in units of protein surface density (moles of kinase per dm2 of liposome surface). We use mol/dm2 because it is the two-dimensional equivalent of M, which is mol/dm3 (16). If we can assume the equivalent bulk-solution concentrations of liposome-bound species is the product of surface concentrations and the liposome surface area per liter of solution, then the surface dimer association constant is the product of equivalent bulk-solution dimer association constant and the liposome surface area per liter of solution. This assumption is based on mass conservation on the macroscopic scale. The bulk lipid concentration was 0.5 mg/ml in our experiments; thus, liposome surface area was 1.5 × 10⁴ dm2/L. This calculation is based on the molecular weight of DOPC (786.113 g/mole), the surface area of one molecule of DOPC taken to be 72 Å2 (48), and the mole ratio of DOPC molecules on the liposome inner leaflet to the liposome outer leaflet of ∼0.9 (49). The apparent bulk solution dimerization association constant K22 is 1 × 10⁸ to 4.5 × 10⁸ m−1, and using the liposome surface area of 1.5 × 10⁴ dm2/L, the Her4 kinase-domain dimer surface association constant is between 1.5 × 10¹² and 6.8 × 10¹² dm2/mol.
RESULTS
Carboxyl-Group Footprinting Method
In this MS-based footprinting, protein samples are modified by a coupling reaction between the carboxyl side chain of proteins and the primary amine of GEE, a reaction driven by EDC (Fig. 1A). This reaction is performed at physiological pH and salt concentration and yields products of +85.0522 Da or +57.0209 Da. The modified protein can be directly analyzed by ESI-MS using a C18 trap column to desalt the sample, or can be digested by trypsin and analyzed by LC-ESI-MS/MS to quantify the site of modification. With accurate mass measurement, the percentage of modification (the modification extent) is determined with little ambiguity on the basis of the peak area of the modified peptide divided by the peak areas of all forms of that peptide. The site of carboxyl-group modification is located from the product-ion spectrum (Fig. 1B).
Global Information of Modified Her4 Protein
Multiply charged protein ions were observed upon ESI of the recombinantly expressed Her4 kinase-domain construct (Fig. 2A). The most abundant charge state was +51. Deconvolution (“de-charging”) of the spectrum gave a protein molecular weight (MW) of 42,167 ± 3 Da, which is in good agreement with the theoretical MW provided that the protein N terminus is acetylated (MW = 42,166 Da). A second series of multiple charged ions was clearly observed with extended view of charge state +51 (Fig. 2B). The MWs of the species corresponding to the second and third peaks are incremented by +80 Da, indicating low levels of basal phosphorylation of the isolated Her4 kinase-domain. This basal phosphorylation of Her4 is assessed in Fig. 4.
Fig. 2.

A, ESI-MS spectra of Her4 kinase-domain protein. B, Magnified view of +51 charge state with different reaction times. The ion of m/z 827.9 represents the unmodified protein. Two peaks separated by 80 Da (corrected by +51 charge state) were observed. C, CD spectrum of protein with and without carboxyl group modification.
Fig. 4.

A, Normalized phosphorylation levels based on MS signals corresponding to all six phosphorylated residues detected in LC-MS/MS experiment. B, Carboxyl group modification extents of residues in activation loop. A total of four modified residues were detected by LC-MS/MS. The distinction between modification of unphosphorylated tryptic peptide and phosphorylated tryptic peptide was based on mass difference and product-ion spectrum of each peptide ion. C, Activation loop in Her4 kinase-domain (crystal structure, PDB id: 3BCE). The loop is labeled in rainbow colors. Three Glu residues and the phosphorylated residue Tyr-850 are highlighted in stick mode. The Asp residue Asp-853 is not seen in the crystal structure. D, Phosphorylation effects on carboxyl group modification. Two synthetic peptides (unphosphorylated versus phosphorylated form) with same sequence as the Tyr-850-containing tryptic peptide were used as a control to check the effects of phosphorylation on carboxyl group modification.
To limit the overall modification of the protein, we measured the time course of the reaction of the isolated Her4 kinase-domain by comparing the ESI mass spectra of modified proteins at different reaction times. In the extended view of charge state +51 (Fig. 2B), the relative abundance of the ions of m/z = 829.4 and 831.0 increased with increasing modification time. These ions are consistent with addition of +85 Da to the carboxylic acid side chains. The relatively lower abundances in the mass spectrum at zero time likely represent basal phosphorylation of the protein, as discussed above. The mass shifts induced by ethyl ester groups (+85 Da) and by phosphorylation (+80 Da) are similar and at the +51 charge state, this 5 Da nominal mass difference corresponds to an m/z difference of 0.098.
In our prior experience, the duration of carboxyl-group labeling needs to be optimized for each protein to ensure that the labeling does not disrupt overall protein conformation or cause unfolding (31, 50). To ensure there was no protein unfolding or major conformational change, one could aim conduct the reaction under “one-hit” conditions. Although this is difficult to control, Fig. 2B shows that the protein, even after 2 min, is not extensively modified (∼25% single modification, ∼18% double, and ∼15% triple and quadruple). Moreover, we obtained circular dichroism (CD) spectra before and after carboxyl-group modification. The CD spectra (Fig. 2C) showed no difference between modified and unmodified Her4, demonstrating that carboxyl-group modification caused no large conformation change in the protein. An additional concern is that the carbodiimide can function as a cross linker, leading to a coupling reaction to give a covalent dimer. By adding GEE prior to the EDC, any intermolecular coupling was avoided as determined from a gel assay (see supplemental Fig. S1).
LC-MS/MS of Her4 Kinase-domain Digest
Digestion gave 98% sequence coverage over the Her4 kinase-domain sequence. The two missing regions correspond to two small peptides, each of which contained three or four amino acids. Besides common protein oxidation (on methionine, tryptophan, and histidine), six phosphorylated residues (three on tyrosine, two on serine, and one on threonine) were detected (supplementary Fig. S2), and their significance is addressed below.
We found that 37 carboxyl groups were modified: 20 on Glu and 17 on Asp. The Her4 kinase-domain protein sequence contains a total of 47 Asp/Glu sites, and the conditions employed here modified 79% of those residues. We verified all sites of carboxyl-group modification reported here by manually inspecting the product-ion spectra. The modification assignments are problematic when applied for low-abundance ions (<10,000 counts in the product-ion spectrum). Peaks corresponding to those low-abundance ions were not used for quantitative analysis. Modification-extent data represent mean and standard deviation of three independent samples.
Footprinting Between Her4 Monomer and Dimer
We generated isolated Her4 kinase-domain dimers by binding the His6-tagged isolated Her4 kinase-domain protein to a liposome containing the nickel chelating lipid Ni-NTA-DOGS, as described in Monsey et al. (15). The binding of the His6-tagged Her4 to these “nickel liposomes” results in a high local concentration of Her4 that allows the dimers to form nearly spontaneously. The His6-tagged isolated Her4 kinase-domain protein is predominantly a monomer in solution, as demonstrated by gel filtration analysis (data not shown). As an additional control, we tested isolated Her4 kinase-domain incubated with control liposomes that lack the nickel-chelating lipid to evaluate for any nonspecific effects from the liposomes on the carboxyl-group modification reaction. These three conditions (i.e. Her4 monomer in solution, Her4 monomer plus control liposomes, and Her4 dimer on nickel liposomes) were reacted with GEE in the presence of EDC in an identical way and analyzed by in-gel trypsin digestion and LC-MS/MS. Modification extents for the 37 Asp/Glu of Her4 kinase-domain protein were compared (Fig. 3A and supplemental Table S1). Decreased modification extents of isolated Her4 kinase-domain dimers compared with monomers were observed for several residues: two N-lobe residues, Glu-690, Glu-692, one activation loop residue, Asp-853, and one C-lobe residue, Glu-912. Based on the crystal structure of the Her4 kinase-domain dimer (11), the C-lobe of one monomer (the donor) contacts the N-lobe of the other monomer (the acceptor) to form an asymmetric dimer (Fig. 3B). Glu-690, Glu-692, and Glu-912 are all located in the dimer interface (Fig. 3B). Given that Glu-690 is located 5.5 Å from Lys-910 and Glu-912 is 2.7 Å from Lys-689 (Fig. 3B inset), these two pairs of residues are likely to form salt bridges that stabilize the kinase dimer structure and reduce the modification extents of Glu-690 and Glu-912.
Fig. 3.

A, Carboxyl group modification extents for Her4 kinase-domain protein. Her4 residue numbering is based on the mature, full length protein minus its signal peptide and matches the numbering used in Qiu et al. (11). The residues involved in dimer interface in crystal structure are labeled in red. The residues from activation loop are labeled in blue. Data represent mean and standard deviation of three independent samples. B, Her4 kinase-domain asymmetry dimer. Based on carboxyl group footprinting results, two residues E690 and E912 are labeled in red. (PDB ID: 3BCE).
Asp-853, which also showed reduced carboxyl-group modification, is not located near the dimerization interface but rather is on a flexible activation loop that can adopt several different conformations (11, 51). In fact, Asp-853 and its neighboring amino acids were not visualized on the Her4 crystal structure (11), further supporting the flexibility of this loop. The N-terminal portion of the activation loop packs up against the αC-helix of Her4 kinase-domain and the opposite surface of the αC-helix is directly involved in the dimer interface (supplemental Fig. S3). Indeed, in protein kinase A (PKA), which was the first kinase to be crystallized, a coupling between the conformation of the αC-helix and the activation loop was also described (51). Therefore, the dimerization-induced movement of the αC-helix alters the conformation of the activation loop and changes the degree of carboxyl-group modification of Asp-853. The change in carboxyl-group modification of Asp-853 is likely to be an indirect, or allosteric, effect of kinase domain dimerization.
Only Asp-897 showed increased carboxyl-group modification upon dimerization; this residue (Fig. 3A) is located on the C-lobe but away from dimer interface (> 15 Å). Asp-897 is located on the loop between the αF and αG helices (Fig. 3B inset). The C-terminal end of the αG-helix contains Glu-912 and is part of the kinase-dimer interface. Analogous to the interpretation of Asp-853 modification behavior above, the dimerization-induced movement of the αG-helix affects the conformation of the loop between αF and αG helices, and its increased modification extent is also likely because of an indirect, or allosteric, effect of dimerization.
Footprinting on Her4 Dimer Autophosphorylation
A growing body of MS evidence has demonstrated that EGFR-ErbB family kinases are phosphorylated on their activation loop both in vivo and in vitro (8, 34–39). A previous study of full-length Her4 demonstrated phosphorylation of Tyr-850 in the Her4 activation loop (8). For a closely related kinase, Her2/neu, we showed that the homologous activation loop Tyr residue (Tyr-877) is also phosphorylated in cells (35). To study the conformation changes induced by phosphorylation, we first incubated Her4 monomers and Her4 dimers with ATP and MgCl2. Although a low-level phosphorylation of six residues was detected prior to ATP addition, particularly at Ser-828 and Ser-972 (Fig. 4A), we interpret this as basal phosphorylation of the isolated Her4 kinase. This phosphorylation likely occurred during recombinant protein expression in the insect cell, as was observed in other studies (52). Consistent with our previous report (15), phosphorylation levels of isolated Her4 kinase-domain monomer showed only small changes when incubated with 100 μm ATP for 5 min at 4 °C, whereas a dramatic increase in phosphorylation at Tyr-850 occurred when isolated Her4 kinase-domain dimers were incubated with ATP under the same conditions. Her4 is known to contain additional autophosphorylation sites in its C-terminal tail domain, but that domain is not included in this isolated Her4 kinase-domain construct. Phosphorylation extents were calculated in the same way as for the carboxyl-group modification. Although these extents do not represent the absolute stoichiometry of phosphorylation in the sample, they do provide a reliable relative change in phosphorylation among samples.
We next compared the modification extent of the Tyr-850 phosphorylated isolated Her4 kinase-domain dimers to the dimers that had not been incubated with ATP. Given that the phosphorylation of Tyr-850 did not reach 100%, the isolated Her4 kinase-domain dimer that was incubated with ATP represents a mixture of Tyr-850 phosphorylated and unphosphorylated proteins. In a bottom-up approach, phosphorylated and unphosphorylated peptides can be separated by a LC and identified by MS based on the mass shift induced by phosphorylation, and their carboxyl-group modification extents can be calculated separately. Measuring the modification extent for the unphosphorylated Tyr-850 containing peptides can be viewed as another control experiment. We found that, of the five possible modification sites in the peptide containing Tyr-850, four were modified (Fig. 4B and Table I). The modification extents were significantly decreased for Glu-847, Glu-849, and Asp-853 in the Tyr-850 phosphorylated state of Her4 as compared with the state for which Tyr-850 is unphosphorylated (Fig. 4C).
Table I. LC-MS results of modified residues in the activation loop.
| Peptide | Sequence | MS2 ID'd Modification* | Theoretical Mass | Mass Centroid | Error (ppm) | Net Mass Change | Peak Retention Time (min) |
|---|---|---|---|---|---|---|---|
| 842–848 | LLEGDEK | E847 | 859.429 | 859.429 | −0.1 | 57.0215 | 16.51 |
| 842–848 | LLEGDEK | E847 | 887.46 | 887.459 | −0.8 | 85.0528 | 21.56 |
| 842–856 | LLEGDEKEYNADGGK | E847 | 1693.78 | 1693.78 | −1.1 | 57.0215 | 20.94 |
| 842–856 | LLEGDEKEYNADGGK | E844 | 1721.81 | 1721.81 | −2.6 | 85.0528 | 23.69 |
| 849–856 | EYNADGGK | E849 | 909.383 | 909.381 | −1.5 | 57.0214 | 10.4 |
| 849–856 | EYNADGGK | E849 | 937.414 | 937.412 | −2.2 | 85.0527 | 17.58 |
| 849–860 | EYNADGGKMPIK | M857 | 1337.63 | 1337.63 | −0.7 | 15.9949 | 16.59 |
| 849–860 | EYNADGGKMPIK | D853, M857 | 1394.65 | 1394.65 | −0.4 | 73.0164 | 16.6 |
| 849–860 | EYNADGGKMPIK | D853 | 1378.66 | 1378.65 | −1.5 | 57.0215 | 21.06 |
* Note: +15.9949 Da, methionine oxidation; +57.0215 Da, ester hydrolysis product of carboxyl group footprinting reaction; +73.0164 Da, methionine oxidation and carboxyl group modification, +85.0527 Da, ethyl ester product of carboxyl group footprinting reaction. The unmodified peptide peak usually has similar retention time with the +57.0215 Da modified peptide.
To rule out that decreases in the carboxyl-group modification are due simply to the proximity of the acidic phosphotyrosine group, we synthesized the tryptic peptide containing Tyr-850 in both its phosphorylated and unphosphorylated forms, and submitted them to carboxyl-group modification, both in solution and in the presence of control liposomes or nickel-liposomes. The carboxyl-group modification extents of the synthetic peptides were similar regardless of whether the Tyr-850 was phosphorylated or unphosphorylated (Fig. 4D). Further, the addition of either control liposomes or nickel-liposomes had no impact on the carboxyl-group labeling. This indicates that the decrease in Glu-847, Glu-849, and Asp-853 modification extents upon activation-loop phosphorylation of dimeric Her4 is because of a conformational change in this loop.
Titration of Her4 Kinase-Domain
To gain a more quantitative view of Her4 kinase-domain dimerization, we modified the protocol of our previously reported H/D exchange method (SIMSTEX) (24) and used carboxyl-group modification instead of H/DX to determine the isolated Her4 kinase-domain dimer association constant. We started the titration experiment by equilibrating nickel liposomes with different concentrations of the isolated Her4 kinase-domain protein. After reaching equilibrium, the samples were modified by EDC and GEE in an identical manner for each. By following the modification extent versus protein concentration, we obtained titration curves and fit them with mathematical models to afford the Her4 dimer association constant. The decreases in modification extents are in agreement with results of carboxyl-group modification between isolated Her4 kinase-domain dimers and monomers (Fig. 3A and supplemental Fig. S4). The titration curve of Glu-847 in the presence of nickel liposomes (Fig. 5A) was used in the dimerization modeling. As a control, we performed a similar titration experiment in the absence of liposomes and found that the modification extent did not vary with Her4 concentration (data not shown). Therefore, the titration curve (Fig. 5A) is a measure of the dimerization equilibrium on the nickel liposome surface.
Fig. 5.

A, Titration curve of Glu-847. The Her4 kinase-domain protein solution concentration is listed on the X axis. The black dots are modification extents of Glu-847 on different protein concentrations. Glu-847 titration curve modeling by Her4 dimer on Ni liposome with parasitic binding site model. Black line is the curve generated by the best fit model. B, Her4 kinase-domain exists in four possible states: free monomer in solution, monomer on liposome surface, dimers on liposome surface, and binding of Her4 to plastic walls or other surfaces. C, The root mean square of the residuals from the model fits as a function of monomer-to-liposome association constant (K11) and liposome binding capacity (Bmax). Results for Bmax equal to 1 × 10⁻⁶ m are not shown because the model curves clearly show bias and the RMS is greater than 0.034 for these fits. The association constants K11 are given in M−1. D, Her4 dimer association equilibrium constant (K22) versus monomer-to-liposome association constant (K11) and liposome binding capacity (Bmax). The right-most vertical axis shows K22 in protein surface density units (dm2/mol) and the left-most vertical axis shows K22 in bulk phase molar units (M−1). As in C, the results for Bmax equal to 1 × 10⁻⁶ m are not shown because the model curves clearly show bias, with the RMS of the residuals being greater than 0.034 and the K22 values becoming very large (>109 m−1).
We generated liposome-bound isolated Her4 kinase-domain dimers by binding the recombinant, His6-tagged Her4 kinase-domain protein to the nickel-liposome.(15). This creates an equilibrium between Her4 monomers and dimers on the liposome surface (Fig. 5B). We first assumed that all of the Her4 kinase-domain was bound to the liposome, either as monomer or dimer. Testing this, we found a clear bias in the model; the fitted parameters G and f are clearly unreasonable (supplemental Fig. S5). To adjust, we made a simple increment in model complexity that resulted in the removal of model bias. The increment incorporated four states for the isolated Her4 kinase-domain (Fig. 5B): free monomer in solution, monomer on liposome surface, dimers on liposome surface, and Her 4 binding to plastic walls or other surfaces in our sample vessels. The latter state, which is termed “parasitic-binding sites” in the method section, removes Her4 from MS analysis. With this model, an equation giving the carboxyl-group modification extents (Fig. 5A) was established as Fracmodified in Eq. 9.
We chose the two parameters, K11 and BMAX, based on the following considerations. Changes in K11, the affinity of His6-tagged isolated Her4 kinase-domain to nickel-liposome produced little change in the shape of the fitted model curve (Fig. 5C). Fits were calculated for K11 values of 3.3 × 10⁵, 1 × 10⁶, 3.3 × 10⁶, and 1 × 10⁷ m−1, which is a reasonable range for the association of Her4 to nickel-binding sites on the liposome surface (10, 15). Although the value for BMAX could not be determined with precision, it was not likely to be greater than the value 4.2 × 10⁻⁶ m−1 that was determined in experiments performed under the same conditions by Monsey et al. (15). The minimum residual RMS for each K11 occurs along the left heavy line on the surface for which BMAX ranges from 1.75 × 10⁻⁶ at the back to 1.28 × 10⁻⁶ m at the front of the surface (Fig. 5C). Below these respective values, the model curves clearly exhibited bias with the curves turning up rapidly at the high end of the titration curve.
The association constant for the isolated Her4 kinase-domain dimer can either be expressed in bulk phase molar units or in units of protein surface density (moles of kinase per dm2 of liposome surface). Although the use of molar units is more familar, the kinase-domain dimerization is occurring on a surface and, therefore, should formally be expressed in protein surface density units. Based on this modeling, the isolated Her4 kinase-domain dimer association constant (K22) is between 1.5 × 10¹² and 6.8 × 10¹² dm2/mol, which corresponds to an apparent bulk phase association constant of 1 × 10⁸ to 4.5 × 10⁸ m−1 (Fig. 5D). The right-most vertical axis on Fig. 5D provides the association constant (K22) in protein surface density units, and the left-most vertical axis shows it in bulk phase molar units. Equilibrium constants in this range are not sensitive to changes in the liposome binding capacity (BMAX) or the binding constant of Her4 to liposome (K11) as shown in Figs. 5C and 5D.
DISCUSSION
Benefits of Carboxyl-group Footprinting
Carboxyl-group footprinting may become generally applicable for characterization of protein conformational changes because it is informative and easily implemented. We initially tested it on a small, soluble protein, calmodulin, and then applied it to characterize a photosynthetic protein in a native-membrane environment (31, 50). Here we used it to characterize the dimerization and phosphorylation-induced conformational changes of a recombinantly expressed, membrane-associated protein kinase. Carboxyl-group labeling is performed under physiologic conditions (aqueous buffers, neutral pH and 50–150 mm salt), requires no special equipment, and is readily performed. The use of a standard SDS-PAGE followed by in-gel digestion protocol for protein separation, clean-up, and digestion make sample preparation relatively simple and readily implemented in other labs.
The compatibility of carboxyl-group footprinting with SDS-PAGE yields several advantages. Lipids, detergents, and salts can be removed during the gel electrophoresis, and separation of multiple proteins prior to MS analysis is easily performed. Commonly used MS-based H/DX and hydroxyl radical labeling schemes are not compatible with SDS-PAGE because the protein undergoes back-exchange in H/DX or additional protein oxidation in hydroxyl-radical footprinting occur during electrophoresis. The advantages of carboxyl-group footprinting MS are particularly well-suited for the study of membrane proteins, as there are very few MS-based studies of protein structure and only a limited number of protein crystal structures for this class of proteins (26, 27, 53).
The extents of modification of Asp and Glu residues depend on extrinsic factors including reaction temperature, time, and reactant concentration, all of which are constant in the experiment, and intrinsic factors including steric effects, solvent accessibility, electrostatic interactions, and local pH (17). By comparing the extent of modification of the same residue in two or more states of a protein, we can measure the effects of conformational changes or protein-protein interactions on this residue. An important caution for carboxyl-group footprinting is the potential of the modification to directly alter protein conformation. For this reason, we kept the reaction time short to ensure that the extents of modification were low but still detectable. Further, the CD spectrum of Her4 after carboxyl-group labeling showed that the labeling reaction did not globally perturb the protein structure. Whenever this approach is applied to a new protein or experimental system, we recommend carrying out this reaction-time optimization and testing of protein conformation. Other limitations of carboxyl-group footprinting include the relatively long labeling times (∼ minutes), making it unsuitable for studying fast processes, and the labeling of only acidic residues, which does not provide information on the other 18 amino acids. Nevertheless, carboxyl-group footprinting complements H/DX, which provides information on the backbone amides, and hydroxyl radical footprinting, which gives provides information on aromatic, sulfur-containing and aliphatic amino acid side chains. The complementarity of H/DX and hydroxyl radical footprinting was already demonstrated (54).
In comparison to protein crystallography, all MS-based footprinting approaches can be performed with very small amounts of protein, can be repeated under multiple states of the protein, and are done in solution. They assess dynamic changes in proteins, whereas protein crystallography represents a “snap-shot” of a single conformation. Additionally, MS-based methods provide information on flexible regions of proteins, which often lack electron density in crystal structures or cause failure to crystallize. Footprinting, however, does not provide direct structural characterization at the atomic level. Although footprinting results, including those involving carboxyl groups, can be interpreted in the absence of a crystal structure, data interpretation is greatly aided if the 3D structure of the protein or a homolog is known. Furthermore, crystal structures can be re-interpreted based on functional or dynamic data that MS-based methods provide (55, 56).
Application to Her4
Footprinting of a reconstituted, in vitro model system of Her4 offers several advantages including conducting experiments that would be very difficult in intact cells. It complements the traditional approach of using recombinant protein expression of isolated kinase domains to study protein kinase structure and enzymology (7, 9, 51). Indeed, the activation mechanism for ErbB kinase activity was established using isolated kinase-domain constructs attached to liposomes. This activation mechanism, termed the asymmetric dimer model, was supported by subsequent mutation studies on the full-length proteins (9, 15, 57). Biophysical determinations of the affinity of kinase-domain dimerization can be made in vitro to assess the role of the kinase domain in full length Her4 dimerization. Studies of an isolated kinase domain, however, do have inherent limitations. For example, the interactions between the kinase domain and the juxtamembrane domain or C-terminal-tail domain cannot be tested, and the missing domains could modify the kinase domain's function. Unfortunately, attempts to purify the full-length EGFR protein have been hampered by low yields and purity, the need for detergents, and the proteolysis of the C-terminal tail domain of EGFR (39, 58). Because detailed biochemical or structural studies on purified full-length ErbB proteins are not yet available, footprinting of isolated ErbB domains offer a tractable experimental system from which to draw cautious conclusions.
The classical model of ErbB receptor tyrosine kinase function holds that these receptors exist as autoinhibited monomers that undergo dimerization after ligand binding (7). There is evidence, however, that EGFR can exist in preformed dimers on the cell surface. These preformed dimers may be in an inactive conformation that is converted to an active conformation upon ligand binding (59, 60). Given that the Her4 kinase-dimer interface is essential for Her4 signal transduction (11), we conclude that if the preformed dimer model is correct, it still requires formation of the asymmetric kinase dimer. An additional property of full-length Her4 is that after ligand binding, it can undergo cleavage by two membrane-associated proteases, α- and γ-secretase, to yield an m80 fragment or a s80 fragment (61–63). The m80 fragment is membrane-associated and contains the transmembrane, juxtamembrane, kinase, and C-terminal-tail domains. The s80 Her4 fragment lacks the transmembrane domain and is a soluble protein that localizes to the cytosol or translocates into the nucleus. The kinase activities of the m80 and s80 Her4 fragments are preserved (62), and our footprinting studies of the isolated Her4 kinase-domain provide data on the possible behavior of these Her4 fragments.
Our current understanding of the Her4 kinase dimerization interface is based on protein crystallography. Although these crystal structures provide an excellent starting point, they also have several limitations. In particular, the Her4 asymmetric dimer structure is inferred from the crystal packing of the kinase monomers and had to be validated by mutational studies (11). These limitations motivate a direct test of the Her4 kinase-dimer structure. By attaching it to a lipid membrane, we mimic the environment and orientation that the Her4 kinase-domain experiences in vivo. We observed that four residues show a decrease and one residue shows an increase in modification extent in the Her4 kinase dimer as compared with the monomer. Of these residues, three are directly located at the crystallographic kinase-dimer interface, and the two remaining are in loops whose movement is likely to be directly influenced by dimerization. Asp-853 is at the activation loop, whose movement is coupled to the αC-helix, and the αC-helix forms part of the dimer interface. Asp-897 is located on the loop between αF- and αG-helices and the C-terminal end of the αG-helix also forms part of the dimer interface. The changes in modification extents of these five residues indicate that the solid-state structure of the Her4 kinase dimer is relevant to solution.
The Her4 kinase-domain crystal structures provide less information about the activation loop. In one crystal structure (PDB accession number:3BCE), residues 853 and 854 lack electron density, and in another (PDB accession number:3BBT, termed the inactive conformation) a much larger section of the activation loop, residues 844 to 857, lacks electron density (11). Further, there is growing MS evidence that EGFR (34, 38, 39), Her2 (35–37), and Her4 (8) are phosphorylated on a conserved tyrosine located on the activation loop, but no crystal structure of this activation loop phosphorylated ErbB kinase is available. The modification extents for isolated Her4 kinase dimers attached to liposomes show that activation-loop residues Glu-847, Glu-849 and Asp-853 are significantly decreased in the phosphorylated dimer as compared with the unphosphorylated dimer. A control experiment on a synthetic peptide shows that this decrease in carboxyl-group modification is because of a conformational change of the activation loop and not because of a chemical effect of the nearby phosphotyrosine group. These results are analogous to those from H/DX on the Ser/Thr kinases, PKA, ERK2 MAP kinase and p38α MAP kinase, all of which show reduced H/DX of the phosphorylated activation loop as compared with the unphosphorylated state (55, 64, 65). Many protein kinases are known to be regulated by activation loop phosphorylation (51). However, based on mutational studies and crystallography studies on EGFR, activation loop phosphorylation of EGFR was thought not to be required and this conclusion was extended to the rest of the ErbB tyrosine kinase family (9, 66, 67). The results presented here suggest that Her4 activation-loop phosphorylation causes a conformational change in this loop. Given the MS evidence documenting EGFR, Her2, and Her4 activation loop phosphorylation, additional biological experiments on the effects of activation loop phosphorylation are required.
Although footprinting provides evidence for phosphorylation-induced conformation change in the activation loop, delineating the conformation is more difficult. We considered three possible conformations that are consistent with the footprinting results. First, the activation loop could form a hydrogen-bonding or electrostatic-interaction network between the phosphorylated residues and nearby basic residues, thereby reducing loop flexibility. This has been observed in several protein kinases, including insulin receptor kinase and ERK2 (68, 69). In fact, a molecular dynamics simulation of activation loop phosphorylation of Her2 suggests that the Her2 residue homologous to Glu-849 interacts electrostatically with an Arg residue (70). This reduction in flexibility and formation of new electrostatic interactions should reduce the modification extent in the phosphorylated Her4 kinase-domain. Second, the activation loop could adopt a conformation whereby the carboxyl groups lose solvent accessibility. Solvent-accessible surface area calculations on the phosphorylated and unphosphorylated ERK2 (PDB accession numbers: 2ERK and 1ERK) indicate that several Asp residues in the activation loop have reduced solvent accessibility in phosphorylated ERK2 (55, 69, 71). Third, the activation loop of one monomer could insert into its dimer partner. Although this activation loop exhange is a more radical conformational change, it was demonstrated for checkpoint kinase 2 (CHK2), Ste20-like kinase (SLK), Ser/Thr kinase 10 (STK10) and death-associated protein kinase 3 (DAPK3, also named ZIPK) (72, 73). Although there is no other evidence for activation loop exchange in tyrosine kinase structures, this is an intriguing possibility that could also explain these footprinting results.
Affinity of dimerization
The isolated ErbB kinase-domain constructs are monomers in solution. Therefore, the contribution of the kinase domain to the dimerization of the full-length ErbB protein is assumed to be small. Crystallographic studies, however, showed that EGFR and Her4 kinase dimers have a buried surface area of 2019 Å2 and 2252 Å2, respectively (9, 11). In comparison, the buried surface area of the isolated EGFR extracellular domain dimer is 2553 Å2 (13, 74). The magnitudes of these areas suggest that the kinase domain can make significant contributions to the dimerization affinity of the full-length ErbB protein. In keeping with this, MacDonald and Pike (16) showed that the EGFR Leu-680 to Asn substitution, which is in the kinase domain and at the asymmetric dimer interface, results in a three-orders-of-magnitude decrease in the dimerization of full-length EGFR. Although the dimerization affinity of the isolated EGFR kinase domain is ∼250 nm (10), the dimerization affinity of the isolated kinase domains has not been measured, to our knowledge. Therefore, we incorporated carboxyl-group footprinting in a titration experiment to measure the isolated Her4 kinase-domain dimerization affinity. This approach has advantages over traditional methods of determining binding constants, such as isothermal titration calorimetry and surface plasmon resonance, because it measures directly the reduction in labeling because of dimerization without the confounding effects of the affinity and free energy change of the His6-tagged protein binding to the nickel-liposomes (given by equilibrium constant K11 in Fig. 5B).
Our approach models the modification extent of the isolated Her4 kinase-domain as a function of the bulk solution concentration of Her4. We did not use the estimated local surface density of Her4 kinase-domain on the nickel-liposomes in the initial steps of our model because of difficulty in precisely determining Her4's local surface density. Instead, we converted the solution association constant to surface density units in the final step of our model. The outcome, 1.5–6.8 × 10¹² dm2/mol, is comparable to previously reported dimerization association constants for the full-length EGFR (16). We acknowledge that the use of the bulk Her4 solution concentration is a limitation in our modeling. We further acknowledge that independent approaches to verify this association constant are needed. Nevertheless, the result suggests that the kinase domain makes a significant contribution to the dimerization of the full-length ErbB protein.
We can reconcile the observation that isolated ErbB kinase domains are monomers in solution, even at high concentrations, with the finding of strong dimerization affinity of the isolated kinase domains on the surface of the nickel-liposomes by considering that the nickel-liposome surface concentrates the Her4 kinase domain construct and raises the local concentration of available kinase domain monomers. Because the apparent bulk phase association constant for dimerization is proportional to the square of the free monomer concentration, a thousand fold increase in the Her4 kinase monomer concentration on the liposome surface will result in a million-fold increase in the apparent association constant on the liposome surface. This means that an apparent bulk phase association constant of 108 m−1 on the liposome surface would translate to a 102 m−1 in solution. If the apparent association constant is 102 m−1 in solution, then Her4 kinase domain construct would remain predominantly as monomers in solutions, even at concentrations up to 10 mg/ml (0.25 mm). This local concentrating effect on the lipid membrane surface also occurs inside cells, because the full-length Her4 protein is a transmembrane protein and localizes to the plasma membrane in vivo.
CONCLUSIONS
The changes in carboxyl-group footprinting of the Her4 kinase-domain dimer, as compared with the monomer, are consistent with the crystallographic asymmetric dimer, thus providing corroborating evidence that the isolated Her4 kinase-domain dimer on a lipid membrane surface adopts a similar conformation to that observed in the crystal structure. Furthermore, the Her4 kinase-domain autophosphorylates itself on Tyr-850 in vitro, altering the activation loop conformation, and this is detected by carboxyl-group footprinting. Finally, mathematical modeling of the carboxyl group footprinting titration curve suggests that the kinase domain makes a significant contribution to the dimerization of the full-length Her4 protein.
An exciting future application of carboxyl-group footprinting MS is to study ErbB tyrosine kinase heterodimerization. In addition to forming homodimers, the full-length Her4 protein can dimerize with EGFR or Her2 to form heterodimers (75). In fact, the ErbB family member, Her3, is thought to require heterodimerization for its normal, physiological functioning because Her3 has a defective kinase domain and, therefore, cannot initiate signaling on its own. Recent crystal structures of the Her3 kinase domain show that its N-lobe is markedly altered as compared with Her4 and EGFR (76, 77). This means that Her3 cannot function as an acceptor monomer in the asymmetric dimer and is restricted to being a donor monomer (9, 76). Carboxyl-group footprinting offers a promising method for studying these heterodimers and other membrane protein complexes.
Acknowledgments
We thank Drs. Henry Rohrs and Reid Townsend for advice and help.
Footnotes
The data associated with this manuscript may be downloaded from ProteomeCommons.org Tranche using the following hash: utGd6Y8e/5efg+/z6QIRclQltJhheAkHzDCUlkTqV2Wvl98b0ldNDckx8jzKOqEy3UALknnbuMQ5dyT/ql9NMbO+9ToAAAAAAAA+Pg==
The hash may be used to prove exactly what files were published as part of this manuscript's data set, and the hash may also be used to check that the data has not changed since publication.
* This work was supported by National Center for Research Resources of the NIH (2P41RR000954) to MLG and NIH grant K22CA128951 to RB. Additional support was provided by Merck; MLG is a consultant for Merck.
 This article contains supplemental Figs. S1 to S5 and Table S1.
1 The abbreviations used are:
- EDC
- 1-ethyl-3-(3-dimethylaminopropyl)carbodiimide
- EGFR
- epidermal growth factor receptor
- GEE
- glycine ethyl ester
- LC-MS/MS
- liquid chromatography coupled tandem mass spectrometry
- H/DX
- hydrogen deuterium exchange
- MS
- mass spectrometry
- SDS-PAGE
- sodium dodecyl sulfate polyacrylamide gel electrophoresis
- DOPC
- dioleoyl-phosphatidylcholine
- Ni-NTA-DOGS
- nickel-1,2-dioleoyl-sn-glycero-3-([N-(5-amino-1-carboxypentyl)iminodi acetic acid]succinyl)-nickel salt
- DTT
- dithiothreitol
- ATP
- adenosine triphosphate
- Q-TOF
- quadrupole time of flight
- ESI
- electrospray ionization
- CD
- circular dichroism
- BSA
- bovine serum albumin
- CID
- collision-induced dissociation
- NCBI
- national center for biotechnology information
- MW
- molecular weight
- SIMSTEX
- self-association interactions using mass spectrometry, self-titration and H/D exchange
- SUV
- small unilamellar vesicles.
REFERENCES
- 1. Birchmeier C. (2009) ErbB receptors and the development of the nervous system. Exp. Cell Res. 315, 611–618 [DOI] [PubMed] [Google Scholar]
- 2. Pentassuglia L., Sawyer D. B. (2009) The role of Neuregulin-1beta/ErbB signaling in the heart. Exp. Cell Res. 315, 627–637 [DOI] [PMC free article] [PubMed] [Google Scholar]
- 3. Gassmann M., Casagranda F., Orioli D., Simon H., Lai C., Klein R., Lemke G. (1995) Aberrant neural and cardiac development in mice lacking the ErbB4 neuregulin receptor. Nature 378, 390–394 [DOI] [PubMed] [Google Scholar]
- 4. Ding L., Getz G., Wheeler D. A., Mardis E. R., McLellan M. D., Cibulskis K., Sougnez C., Greulich H., Muzny D. M., Morgan M. B., Fulton L., Fulton R. S., Zhang Q., Wendl M. C., Lawrence M. S., Larson D. E., Chen K., Dooling D. J., Sabo A., Hawes A. C., Shen H., Jhangiani S. N., Lewis L. R., Hall O., Zhu Y., Mathew T., Ren Y., Yao J., Scherer S. E., Clerc K., Metcalf G. A., Ng B., Milosavljevic A., Gonzalez-Garay M. L., Osborne J. R., Meyer R., Shi X., Tang Y., Koboldt D. C., Lin L., Abbott R., Miner T. L., Pohl C., Fewell G., Haipek C., Schmidt H., Dunford-Shore B. H., Kraja A., Crosby S. D., Sawyer C. S., Vickery T., Sander S., Robinson J., Winckler W., Baldwin J., Chirieac L. R., Dutt A., Fennell T., Hanna M., Johnson B. E., Onofrio R. C., Thomas R. K., Tonon G., Weir B. A., Zhao X., Ziaugra L., Zody M. C., Giordano T., Orringer M. B., Roth J. A., Spitz M. R., Wistuba II, Ozenberger B., Good P. J., Chang A. C., Beer D. G., Watson M. A., Ladanyi M., Broderick S., Yoshizawa A., Travis W. D., Pao W., Province M. A., Weinstock G. M., Varmus H. E., Gabriel S. B., Lander E. S., Gibbs R. A., Meyerson M., Wilson R. K. (2008) Somatic mutations affect key pathways in lung adenocarcinoma. Nature 455, 1069–1075 [DOI] [PMC free article] [PubMed] [Google Scholar]
- 5. Prickett T. D., Agrawal N. S., Wei X., Yates K. E., Lin J. C., Wunderlich J. R., Cronin J. C., Cruz P., Rosenberg S. A., Samuels Y. (2009) Analysis of the tyrosine kinome in melanoma reveals recurrent mutations in ERBB4. Nat. Genet. 41, 1127–1132 [DOI] [PMC free article] [PubMed] [Google Scholar]
- 6. Carpenter G. (2003) ErbB-4: mechanism of action and biology. Exp. Cell Res. 284, 66–77 [DOI] [PubMed] [Google Scholar]
- 7. Lemmon M. A., Schlessinger J. (2010) Cell signaling by receptor tyrosine kinases. Cell 141, 1117–1134 [DOI] [PMC free article] [PubMed] [Google Scholar]
- 8. Kaushansky A., Gordus A., Budnik B. A., Lane W. S., Rush J., MacBeath G. (2008) System-wide investigation of ErbB4 reveals 19 sites of Tyr phosphorylation that are unusually selective in their recruitment properties. Chem. Biol. 15, 808–817 [DOI] [PMC free article] [PubMed] [Google Scholar]
- 9. Zhang X., Gureasko J., Shen K., Cole P. A., Kuriyan J. (2006) An allosteric mechanism for activation of the kinase domain of epidermal growth factor receptor. Cell 125, 1137–1149 [DOI] [PubMed] [Google Scholar]
- 10. Ferguson K. M., Darling P. J., Mohan M. J., Macatee T. L., Lemmon M. A. (2000) Extracellular domains drive homo- but not hetero-dimerization of erbB receptors. EMBO J. 19, 4632–4643 [DOI] [PMC free article] [PubMed] [Google Scholar]
- 11. Qiu C., Tarrant M. K., Choi S. H., Sathyamurthy A., Bose R., Banjade S., Pal A., Bornmann W. G., Lemmon M. A., Cole P. A., Leahy D. J. (2008) Mechanism of activation and inhibition of the HER4/ErbB4 kinase. Structure 16, 460–467 [DOI] [PMC free article] [PubMed] [Google Scholar]
- 12. Red Brewer M., Choi S. H., Alvarado D., Moravcevic K., Pozzi A., Lemmon M. A., Carpenter G. (2009) The juxtamembrane region of the EGF receptor functions as an activation domain. Mol. Cell 34, 641–651 [DOI] [PMC free article] [PubMed] [Google Scholar]
- 13. Alvarado D., Klein D. E., Lemmon M. A. (2010) Structural basis for negative cooperativity in growth factor binding to an EGF receptor. Cell 142, 568–579 [DOI] [PMC free article] [PubMed] [Google Scholar]
- 14. Jura N., Endres N. F., Engel K., Deindl S., Das R., Lamers M. H., Wemmer D. E., Zhang X., Kuriyan J. (2009) Mechanism for activation of the EGF receptor catalytic domain by the juxtamembrane segment. Cell 137, 1293–1307 [DOI] [PMC free article] [PubMed] [Google Scholar]
- 15. Monsey J., Shen W., Schlesinger P., Bose R. (2010) Her4 and Her2/neu tyrosine kinase domains dimerize and activate in a reconstituted in vitro system. J. Biol. Chem. 285, 7035–7044 [DOI] [PMC free article] [PubMed] [Google Scholar]
- 16. Macdonald J. L., Pike L. J. (2008) Heterogeneity in EGF-binding affinities arises from negative cooperativity in an aggregating system. Proc. Natl. Acad. Sci. U.S.A. 105, 112–117 [DOI] [PMC free article] [PubMed] [Google Scholar]
- 17. Mendoza V. L., Vachet R. W. (2009) Probing protein structure by amino acid-specific covalent labeling and mass spectrometry. Mass Spectrom Rev 28, 785–815 [DOI] [PMC free article] [PubMed] [Google Scholar]
- 18. Sperry J. B., Shi X., Rempel D. L., Nishimura Y., Akashi S., Gross M. L. (2008) A mass spectrometric approach to the study of DNA-binding proteins: interaction of human TRF2 with telomeric DNA. Biochemistry 47, 1797–1807 [DOI] [PubMed] [Google Scholar]
- 19. Wales T. E., Engen J. R. (2006) Hydrogen exchange mass spectrometry for the analysis of protein dynamics. Mass Spectrom. Rev. 25, 158–170 [DOI] [PubMed] [Google Scholar]
- 20. Xu G., Chance M. R. (2007) Hydroxyl radical-mediated modification of proteins as probes for structural proteomics. Chem. Rev. 107, 3514–3543 [DOI] [PubMed] [Google Scholar]
- 21. Konermann L., Tong X., Pan Y. (2008) Protein structure and dynamics studied by mass spectrometry: H/D exchange, hydroxyl radical labeling, and related approaches. J. Mass Spectrom. 43, 1021–1036 [DOI] [PubMed] [Google Scholar]
- 22. Roulhac P. L., Powell K. D., Dhungana S., Weaver K. D., Mietzner T. A., Crumbliss A. L., Fitzgerald M. C. (2004) SUPREX (Stability of Unpurified Proteins from Rates of H/D Exchange) analysis of the thermodynamics of synergistic anion binding by ferric-binding protein (FbpA), a bacterial transferrin. Biochemistry 43, 15767–15774 [DOI] [PubMed] [Google Scholar]
- 23. Zhang J., Adrián F. J., Jahnke W., Cowan-Jacob S. W., Li A. G., Iacob R. E., Sim T., Powers J., Dierks C., Sun F., Guo G. R., Ding Q., Okram B., Choi Y., Wojciechowski A., Deng X., Liu G., Fendrich G., Strauss A., Vajpai N., Grzesiek S., Tuntland T., Liu Y., Bursulaya B., Azam M., Manley P. W., Engen J. R., Daley G. Q., Warmuth M., Gray N. S. (2010) Targeting Bcr-Abl by combining allosteric with ATP-binding-site inhibitors. Nature 463, 501–506 [DOI] [PMC free article] [PubMed] [Google Scholar]
- 24. Chitta R. K., Rempel D. L., Grayson M. A., Remsen E. E., Gross M. L. (2006) Application of SIMSTEX to oligomerization of insulin analogs and mutants. J. Am. Soc. Mass Spectrom. 17, 1526–1534 [DOI] [PubMed] [Google Scholar]
- 25. Perdivara I., Deterding L. J., Przybylski M., Tomer K. B. (2010) Mass Spectrometric Identification of Oxidative Modifications of Tryptophan Residues in Proteins: Chemical Artifact or Post-Translational Modification? J. Am. Soc. Mass Spectrom. 21, 1114–1117 [DOI] [PMC free article] [PubMed] [Google Scholar]
- 26. Hebling C. M., Morgan C. R., Stafford D. W., Jorgenson J. W., Rand K. D., Engen J. R. (2010) Conformational analysis of membrane proteins in phospholipid bilayer nanodiscs by hydrogen exchange mass spectrometry. Anal. Chem. 82, 5415–5419 [DOI] [PMC free article] [PubMed] [Google Scholar]
- 27. Pan Y., Stocks B. B., Brown L., Konermann L. (2009) Structural characterization of an integral membrane protein in its natural lipid environment by oxidative methionine labeling and mass spectrometry. Anal. Chem. 81, 28–35 [DOI] [PubMed] [Google Scholar]
- 28. Zhu Y., Guo T., Park J. E., Li X., Meng W., Datta A., Bern M., Lim S. K., Sze S. K. (2009) Elucidating in vivo structural dynamics in integral membrane protein by hydroxyl radical footprinting. Mol. Cell Proteomics 8, 1999–2010 [DOI] [PMC free article] [PubMed] [Google Scholar]
- 29. Hoare D. G., Olson A., Koshland D. E., Jr. (1968) The reaction of hydroxamic acids with water-soluble carbodiimides. A Lossen rearrangement. J. Am. Chem. Soc. 90, 1638–1643 [DOI] [PubMed] [Google Scholar]
- 30. Hoare D. G., Koshland D. E., Jr. (1967) A method for the quantitative modification and estimation of carboxylic acid groups in proteins. J. Biol. Chem. 242, 2447–2453 [PubMed] [Google Scholar]
- 31. Wen J., Zhang H., Gross M. L., Blankenship R. E. (2009) Membrane orientation of the FMO antenna protein from Chlorobaculum tepidum as determined by mass spectrometry-based footprinting. Proc. Natl. Acad. Sci. U.S.A. 106, 6134–6139 [DOI] [PMC free article] [PubMed] [Google Scholar]
- 32. Shrout A. L., Montefusco D. J., Weis R. M. (2003) Template-directed assembly of receptor signaling complexes. Biochemistry 42, 13379–13385 [DOI] [PubMed] [Google Scholar]
- 33. Montefusco D. J., Asinas A. E., Weis R. M. (2007) Liposome-mediated assembly of receptor signaling complexes. Methods Enzymol. 423, 267–298 [DOI] [PubMed] [Google Scholar]
- 34. Guo A., Villén J., Kornhauser J., Lee K. A., Stokes M. P., Rikova K., Possemato A., Nardone J., Innocenti G., Wetzel R., Wang Y., MacNeill J., Mitchell J., Gygi S. P., Rush J., Polakiewicz R. D., Comb M. J. (2008) Signaling networks assembled by oncogenic EGFR and c-Met. Proc. Natl. Acad. Sci. U.S.A. 105, 692–697 [DOI] [PMC free article] [PubMed] [Google Scholar]
- 35. Bose R., Molina H., Patterson A. S., Bitok J. K., Periaswamy B., Bader J. S., Pandey A., Cole P. A. (2006) Phosphoproteomic analysis of Her2/neu signaling and inhibition. Proc. Natl. Acad. Sci. U.S.A. 103, 9773–9778 [DOI] [PMC free article] [PubMed] [Google Scholar]
- 36. Mukherji M., Brill L. M., Ficarro S. B., Hampton G. M., Schultz P. G. (2006) A phosphoproteomic analysis of the ErbB2 receptor tyrosine kinase signaling pathways. Biochemistry 45, 15529–15540 [DOI] [PubMed] [Google Scholar]
- 37. Wolf-Yadlin A., Kumar N., Zhang Y., Hautaniemi S., Zaman M., Kim H. D., Grantcharova V., Lauffenburger D. A., White F. M. (2006) Effects of HER2 overexpression on cell signaling networks governing proliferation and migration. Mol. Syst. Biol. 2, 54 [DOI] [PMC free article] [PubMed] [Google Scholar]
- 38. Huang P. H., Mukasa A., Bonavia R., Flynn R. A., Brewer Z. E., Cavenee W. K., Furnari F. B., White F. M. (2007) Quantitative analysis of EGFRvIII cellular signaling networks reveals a combinatorial therapeutic strategy for glioblastoma. Proc. Natl. Acad. Sci. U.S.A. 104, 12867–12872 [DOI] [PMC free article] [PubMed] [Google Scholar]
- 39. Qiu C., Tarrant M. K., Boronina T., Longo P. A., Kavran J. M., Cole R. N., Cole P. A., Leahy D. J. (2009) In vitro enzymatic characterization of near full length EGFR in activated and inhibited states. Biochemistry 48, 6624–6632 [DOI] [PMC free article] [PubMed] [Google Scholar]
- 40. Szoka F., Olson F., Heath T., Vail W., Mayhew E., Papahadjopoulos D. (1980) Preparation of unilamellar liposomes of intermediate size (0.1–0.2 mumol) by a combination of reverse phase evaporation and extrusion through polycarbonate membranes. Biochim. Biophys. Acta 601, 559–571 [DOI] [PubMed] [Google Scholar]
- 41. Shevchenko A., Tomas H., Havlis J., Olsen J. V., Mann M. (2006) In-gel digestion for mass spectrometric characterization of proteins and proteomes. Nat Protoc 1, 2856–2860 [DOI] [PubMed] [Google Scholar]
- 42. Lente G. (2010) The connection between the second law of thermodynamics and the principle of microscopic reversibility. J. Math. Chem. 47, 1106–1111 [Google Scholar]
- 43. Tolman R. C. (1925) The Principle of Microscopic Reversibility. Proc. Natl. Acad. Sci. U.S.A. 11, 436–439 [DOI] [PMC free article] [PubMed] [Google Scholar]
- 44. Zhu M. M., Rempel D. L., Gross M. L. (2004) Modeling data from titration, amide H/D exchange, and mass spectrometry to obtain protein-ligand binding constants. J. Am. Soc. Mass Spectrom. 15, 388–397 [DOI] [PubMed] [Google Scholar]
- 45. Zhu M. M., Rempel D. L., Du Z., Gross M. L. (2003) Quantification of protein-ligand interactions by mass spectrometry, titration, and H/D exchange: PLIMSTEX. J. Am. Chem. Soc. 125, 5252–5253 [DOI] [PubMed] [Google Scholar]
- 46. Williamson R. E., Crowell R. H., Trotter H. F. (1968) Calculus of Vector Functions, 2nd Ed., Prentice-Hall, Inc., Englewood Cliffs, New Jersey [Google Scholar]
- 47. Krantz S. G., Parks H. R. (2003) The Implicit Function Theorem: History, Theory, and Applications, Birkhauser, Boston [Google Scholar]
- 48. Nagle J. F., Tristram-Nagle S. (2000) Lipid bilayer structure. Curr. Opin. Struct. Biol. 10, 474–480 [DOI] [PMC free article] [PubMed] [Google Scholar]
- 49. Cullis P. R., Hope M. J. (1991) Physical properties and functional roles of lipids in membranes. In: Vance D. E., Vance J. eds. Biochemistry of Lipids, Lipoproteins, and Membranes, pp. 1–41, Elsevier, Amsterdam [Google Scholar]
- 50. Zhang H., Wen J., Blankenship R. E., Gross M. L. (2009) MS-based Carboxyl Group Protein Footprinting for Probing the Orientation of FMOProtein in Photosynthetic Bacterial Membranes. 57th ASMS Conference on Mass Spectrometry and Allied Topics, Philadelphia, PA [Google Scholar]
- 51. Huse M., Kuriyan J. (2002) The conformational plasticity of protein kinases. Cell 109, 275–282 [DOI] [PubMed] [Google Scholar]
- 52. Erdmann D., Zimmermann C., Fontana P., Hau J. C., De, Pover A., Chène P. (2010) Simultaneous protein expression and modification: an efficient approach for production of unphosphorylated and biotinylated receptor tyrosine kinases by triple infection in the baculovirus expression system. J Biomol Tech 21, 9–17 [PMC free article] [PubMed] [Google Scholar]
- 53. Gupta S., Bavro V. N., D'Mello R., Tucker S. J., Vénien-Bryan C., Chance M. R. (2010) Conformational changes during the gating of a potassium channel revealed by structural mass spectrometry. Structure 18, 839–846 [DOI] [PMC free article] [PubMed] [Google Scholar]
- 54. Zheng X., Wintrode P. L., Chance M. R. (2008) Complementary structural mass spectrometry techniques reveal local dynamics in functionally important regions of a metastable serpin. Structure 16, 38–51 [DOI] [PubMed] [Google Scholar]
- 55. Hoofnagle A. N., Resing K. A., Goldsmith E. J., Ahn N. G. (2001) Changes in protein conformational mobility upon activation of extracellular regulated protein kinase-2 as detected by hydrogen exchange. Proc. Natl. Acad. Sci. U.S.A. 98, 956–961 [DOI] [PMC free article] [PubMed] [Google Scholar]
- 56. Zhang J., Chalmers M. J., Stayrook K. R., Burris L. L., Garcia-Ordonez R. D., Pascal B. D., Burris T. P., Dodge J. A., Griffin P. R. (2010) Hydrogen/deuterium exchange reveals distinct agonist/partial agonist receptor dynamics within vitamin D receptor/retinoid X receptor heterodimer. Structure 18, 1332–1341 [DOI] [PMC free article] [PubMed] [Google Scholar]
- 57. Zhang X., Pickin K. A., Bose R., Jura N., Cole P. A., Kuriyan J. (2007) Inhibition of the EGF receptor by binding of MIG6 to an activating kinase domain interface. Nature 450, 741–744 [DOI] [PMC free article] [PubMed] [Google Scholar]
- 58. Mi L. Z., Grey M. J., Nishida N., Walz T., Lu C., Springer T. A. (2008) Functional and structural stability of the epidermal growth factor receptor in detergent micelles and phospholipid nanodiscs. Biochemistry 47, 10314–10323 [DOI] [PMC free article] [PubMed] [Google Scholar]
- 59. Martin-Fernandez M., Clarke D. T., Tobin M. J., Jones S. V., Jones G. R. (2002) Preformed oligomeric epidermal growth factor receptors undergo an ectodomain structure change during signaling. Biophys. J. 82, 2415–2427 [DOI] [PMC free article] [PubMed] [Google Scholar]
- 60. Moriki T., Maruyama H., Maruyama I. N. (2001) Activation of preformed EGF receptor dimers by ligand-induced rotation of the transmembrane domain. J. Mol. Biol. 311, 1011–1026 [DOI] [PubMed] [Google Scholar]
- 61. Cheng Q. C., Tikhomirov O., Zhou W., Carpenter G. (2003) Ectodomain cleavage of ErbB-4: characterization of the cleavage site and m80 fragment. J. Biol. Chem. 278, 38421–38427 [DOI] [PubMed] [Google Scholar]
- 62. Linggi B., Cheng Q. C., Rao A. R., Carpenter G. (2006) The ErbB-4 s80 intracellular domain is a constitutively active tyrosine kinase. Oncogene 25, 160–163 [DOI] [PubMed] [Google Scholar]
- 63. Ni C. Y., Murphy M. P., Golde T. E., Carpenter G. (2001) gamma -Secretase cleavage and nuclear localization of ErbB-4 receptor tyrosine kinase. Science 294, 2179–2181 [DOI] [PubMed] [Google Scholar]
- 64. Steichen J. M., Iyer G. H., Li S., Saldanha S. A., Deal M. S., Woods V. L., Jr., Taylor S. S. (2010) Global consequences of activation loop phosphorylation on protein kinase A. J. Biol. Chem. 285, 3825–3832 [DOI] [PMC free article] [PubMed] [Google Scholar]
- 65. Sours K. M., Kwok S. C., Rachidi T., Lee T., Ring A., Hoofnagle A. N., Resing K. A., Ahn N. G. (2008) Hydrogen-exchange mass spectrometry reveals activation-induced changes in the conformational mobility of p38alpha MAP kinase. J. Mol. Biol. 379, 1075–1093 [DOI] [PMC free article] [PubMed] [Google Scholar]
- 66. Stamos J., Sliwkowski M. X., Eigenbrot C. (2002) Structure of the epidermal growth factor receptor kinase domain alone and in complex with a 4-anilinoquinazoline inhibitor. J. Biol. Chem. 277, 46265–46272 [DOI] [PubMed] [Google Scholar]
- 67. Gotoh N., Tojo A., Hino M., Yazaki Y., Shibuya M. (1992) A highly conserved tyrosine residue at codon 845 within the kinase domain is not required for the transforming activity of human epidermal growth factor receptor. Biochem. Biophys. Res. Commun. 186, 768–774 [DOI] [PubMed] [Google Scholar]
- 68. Hubbard S. R. (1997) Crystal structure of the activated insulin receptor tyrosine kinase in complex with peptide substrate and ATP analog. EMBO J. 16, 5572–5581 [DOI] [PMC free article] [PubMed] [Google Scholar]
- 69. Canagarajah B. J., Khokhlatchev A., Cobb M. H., Goldsmith E. J. (1997) Activation mechanism of the MAP kinase ERK2 by dual phosphorylation. Cell 90, 859–869 [DOI] [PubMed] [Google Scholar]
- 70. Telesco S. E., Radhakrishnan R. (2009) Atomistic insights into regulatory mechanisms of the HER2 tyrosine kinase domain: a molecular dynamics study. Biophys. J. 96, 2321–2334 [DOI] [PMC free article] [PubMed] [Google Scholar]
- 71. Fraczkiewicz R., Braun W. (1998) Exact and efficient analytical calculation of the accessible surface areas and their gradients for macromolecules. J. Comp. Chem 19, 319–333 [Google Scholar]
- 72. Oliver A. W., Knapp S., Pearl L. H. (2007) Activation segment exchange: a common mechanism of kinase autophosphorylation? Trends Biochem. Sci 32, 351–356 [DOI] [PubMed] [Google Scholar]
- 73. Oliver A. W., Paul A., Boxall K. J., Barrie S. E., Aherne G. W., Garrett M. D., Mittnacht S., Pearl L. H. (2006) Trans-activation of the DNA-damage signalling protein kinase Chk2 by T-loop exchange. EMBO J. 25, 3179–3190 [DOI] [PMC free article] [PubMed] [Google Scholar]
- 74. Ogiso H., Ishitani R., Nureki O., Fukai S., Yamanaka M., Kim J. H., Saito K., Sakamoto A., Inoue M., Shirouzu M., Yokoyama S. (2002) Crystal structure of the complex of human epidermal growth factor and receptor extracellular domains. Cell 110, 775–787 [DOI] [PubMed] [Google Scholar]
- 75. Tzahar E., Waterman H., Chen X., Levkowitz G., Karunagaran D., Lavi S., Ratzkin B. J., Yarden Y. (1996) A hierarchical network of interreceptor interactions determines signal transduction by Neu differentiation factor/neuregulin and epidermal growth factor. Mol. Cell. Biol. 16, 5276–5287 [DOI] [PMC free article] [PubMed] [Google Scholar]
- 76. Jura N., Shan Y., Cao X., Shaw D. E., Kuriyan J. (2009) Structural analysis of the catalytically inactive kinase domain of the human EGF receptor 3. Proc. Natl. Acad. Sci. U.S.A. 106, 21608–21613 [DOI] [PMC free article] [PubMed] [Google Scholar]
- 77. Shi F., Telesco S. E., Liu Y., Radhakrishnan R., Lemmon M. A. (2010) ErbB3/HER3 intracellular domain is competent to bind ATP and catalyze autophosphorylation. Proc. Natl. Acad. Sci. U.S.A. 107, 7692–7697 [DOI] [PMC free article] [PubMed] [Google Scholar]