

Abstract
Many insects are nutritionally dependent on symbiotic microorganisms that have tiny genomes and are housed in specialized host cells called bacteriocytes. The obligate symbiosis between the pea aphid Acyrthosiphon pisum and the γ-proteobacterium Buchnera aphidicola (only 584 predicted proteins) is particularly amenable for molecular analysis because the genomes of both partners have been sequenced. To better define the symbiotic relationship between this aphid and Buchnera, we used large-scale, high accuracy tandem mass spectrometry (nanoLC-LTQ-Orbtrap) to identify aphid and Buchnera proteins in the whole aphid body, purified bacteriocytes, isolated Buchnera cells and the residual bacteriocyte fraction. More than 1900 aphid and 400 Buchnera proteins were identified. All enzymes in amino acid metabolism annotated in the Buchnera genome were detected, reflecting the high (68%) coverage of the proteome and supporting the core function of Buchnera in the aphid symbiosis. Transporters mediating the transport of predicted metabolites were present in the bacteriocyte. Label-free spectral counting combined with hierarchical clustering, allowed to define the quantitative distribution of a subset of these proteins across both symbiotic partners, yielding no evidence for the selective transfer of protein among the partners in either direction. This is the first quantitative proteome analysis of bacteriocyte symbiosis, providing a wealth of information about molecular function of both the host cell and bacterial symbiont.
Animals are metabolically impoverished. They are unable to synthesize 9 or 10 of the essential amino acids (EAAs)1 and various cofactors required for the function of key metabolic enzymes (e.g. the B vitamins). Repeatedly over evolutionary time, animals have resolved metabolic limitations by forming intimate symbioses with bacteria possessing the metabolic capabilities that they lack (1, 2). Among the great diversity of animal-microbial symbioses with a metabolic basis, the bacteriocyte symbioses in insects are remarkable for their intimacy (3, 4). The symbiotic microorganisms are intracellular, located in just one cell type, known as the bacteriocyte, which sole function appears to be to maintain the symbiosis; Bacteriocytes are transmitted vertically from the mother insect to her offspring usually via the egg cytoplasm. The association is obligate for both partners. The insect hosts, which generally feed on nutritionally unbalanced diets, benefit from nutrients provided by the bacteria (4, 5). For example, all insects feeding through the life cycle on plant sap (e.g. aphids, whitefly, and leafhoppers) and vertebrate blood (e.g. tsetse fly, bedbugs, and sucking lice) have bacteriocyte symbionts that provide their insect host with nutrients in short dietary supply (EAAs for plant sap feeders and B vitamins for blood-feeders) (6, 7). The obligacy of the symbiosis for the bacterial partner can be attributed to the very small size of their genomes, generally <1 Mb and, in some taxa, of comparable size to mitochondria and plastids (8). Relaxed selection on genes not required in the insect habitat, and genome erosion linked to the very small effective population size of the vertically transmitted bacteria, both contribute to gene loss of these symbionts (3, 9, 10). It has been suggested that some bacteriocyte symbionts are organelles (e.g. as defined by requiring import of host nuclear-encoded gene products, as in mitochondria and plastids (11)) or on an evolutionary trajectory (e.g. as evidenced by extensive loss of bacterial gene content) to organelle status (12).
Symbiosis function, especially the nutritional role of the symbiotic microorganisms, is relatively well-studied from a whole-organism perspective for several bacteriocyte symbioses, but understanding of the molecular basis of these interactions is currently fragmentary. We lack a coherent explanation for the sustained nutrient release from the symbionts and the coordinated growth/proliferation of the two partners, in terms of the metabolic pathways and immune effectors of the host cell and their interactions with the bacteria. The symbiosis between the pea aphid Acyrthosiphon pisum and the γ-proteobacterium Buchnera aphidicola is particularly amenable for molecular analysis because the genomes of both partners have been sequenced (13, 14). Moreover, a wealth of experimental data supports the function of Buchnera, the upgrading of nonessential amino acids to essential amino acids (15).
The aim of this study was to address two unresolved key questions in aphid-Buchnera symbiosis. First, are any aphid proteins targeted specifically to the Buchnera cells? This question is of great evolutionary significance because the targeting of nuclear-encoded proteins is the hall-mark of a bacterial-derived organelle (16, 17); the presence of such host proteins within the Buchnera cells would indicate that these bacterial cells are on their way to become organelles (or should be defined as organelles already). Second, which aphid proteins are enriched in bacteriocytes relative to the whole aphid body? This class of proteins is predicted to include aphid proteins that contribute directly to the symbiotic relationship. Of particular interest are proteins with known or predicted metabolic or immune function, contributing to nutrient flux among the partners and regulation of the Buchnera cells, respectively. In addition, “orphan” proteins (without obvious homologs in other organisms) would suggest specific adaptation of the aphid to its symbiotic relation with Buchnera. Finally, it is conceivable Buchnera cells secrete specific proteins into the bacteriocyte to contribute to host-symbiont signal exchange or as a nutritional source of EAAs.
To answer these questions, we carried out a proteome analysis in which we compared the proteome of whole aphids with purified intact bacteriocytes, partially purified and highly purified Buchnera cells, and the host fraction of bacteriocytes. We applied mass-spectrometry-based label-free spectral counting to quantify the distribution of proteins across these fractions, in combination with hierarchical cluster analysis. To date, the pea aphid and other aphid species have been the subject of various proteome analyses (18–22), but most did not address the symbiotic relationship. Only one published study was specific to the aphid symbiosis; proteins extracted from isolated Buchnera cells were analyzed by peptide mass fingerprinting confirming the expression of 50 Buchnera proteins (23). The current study identified more than 1900 aphid and 400 Buchnera proteins across these various aphid, bacteriocyte, and Buchnera fractions. The mass spectrometry-based identification was performed with a high resolution, high mass accuracy instrument, operating at its highest resolution (100,000), thus yielding a valuable data set that can be used to improve aphid genome annotation and provide evidence for predicted Buchnera protein models. This study provides not only excellent proteome coverage of both aphids and Buchnera, but also answers several important and fundamental questions regarding the symbiotic relationship.
EXPERIMENTAL PROCEDURES
Experimental Material and Processing for Proteomics
The pea aphid Acyrthosiphon pisum was collected from an alfalfa crop at Freeville farms, Freeville, NY in June 2009, and reared on preflowering Vicia faba cv. Windsor at 20 °C with 16 h light: 8 h dark (120 μE m−2 s−1). Three independent replicate experiments were conducted on 7-day-old apterous fourth-instar larvae taken from cultures in three consecutive months between December 2009 and February 2010. The five samples per experiment (see Fig. 1) comprised: whole aphid bodies (WB), bacteriocytes dissected from the maternal body cavity (BC), partially purified Buchnera cells isolated from dissected bacteriocytes (Bu-1), Buchnera cells purified by Percoll gradient centrifugation (Bu-2), and supernatant fraction of dissected bacteriocytes (BR). WB samples comprised five aphids flash-frozen in liquid nitrogen, homogenized frozen in a mortar and pestle, and resuspended in 2× SDS-PAGE loading buffer (125 mm Tris-HCl pH 6.8, 10% v/v β-mercaptoethanol, 20% v/v glycerol, 4% w/v SDS, few grains of bromphenol blue). For BC samples, the maternal bacteriocytes were dissected with fine pins from 60 aphids into 30 μl PBS (0.15 m NaCl, 3 mm KCl, 10 mm Na2HPO4, pH 7.4) final volume, and mixed with 10 μl 4× SDS-PAGE loading buffer. For Bu-1, Bu-2, and BR samples, maternal bacteriocytes were dissected from 100, 700, and 300 aphids, respectively, into ice-cold extraction buffer (25 mm KCl, 10 mm MgCl2, 35 mm Tris-HCl pH 7.5, 0.25 m sucrose), homogenized as above, and centrifuged at 600 × g for 5 min at 4 °C. For BR samples, the supernatant was collected, and Bu-1 samples comprised the pellet resuspended in loading buffer. To obtain Bu-2 samples, the pellet was resuspended in 0.2 ml 0.25 m sucrose, layered onto a step gradient of 45%, 27%, 18%, and 9% Percoll in 0.25 m sucrose. After centrifugation at 200 × g for 20 min, the band of Buchnera cells (confirmed by microscopical examination) at the interface between 27 and 18% Percoll was aspirated off, diluted fivefold in the extraction buffer, centrifuged at 700 × g for 5 min, and resuspended in SDS-PAGE loading buffer. All samples in loading buffer were incubated at 90 °C for 5 min prior to separation by SDS-PAGE.
Fig. 1.

The five fractions used for the proteome analysis. The maternal bacteriocytes form a U-shaped organ in the body cavity of the insect (green in WB sample) and were dissected from the insects for preparation of the other samples. The aphids also contain bacteriocytes in their embryos (not illustrated), which contributed to the proteome of WB only. The Buchnera from Bu-1 sample (TEM image insert) are bounded by the inner bacterial membrane (↑) and outer bacterial membrane (↑), demonstrating that the symbiosomal membrane of aphid origin is lost during preparation.
Proteome Analysis by Nanolc-LTQ-Orbitrap
Proteins were separated by SDS-PAGE (10–14% acrylamide). Each gel lane was cut in 10 slices, proteins were digested with trypsin and the extracted peptides were analyzed by nanoLC-LTQ-Orbitrap (Thermoelectron) mass spectrometry using data-dependent acquisition and dynamic exclusion, similar as described in (24). Peptide extracts were automatically loaded on a guard column (LC Packings; MGU-30-C18PM) via an autosampler, followed by separation on a PepMap C18 reverse-phase nano column (LC Packings nan75–15-03-C18PM), using 90-min gradients with 95% water, 5% acetonitrile (ACN), 0.1% formic acid (FA) (solvent A), and 95% ACN, 5% water, 0.1% FA (solvent B) at a flow rate of 200 nl/min. The acquisition cycle consisted of a survey MS scan in the Orbitrap with a set mass range from 350 m/z to 1800 m/z at the highest resolving power (100,000), followed by five data-dependent MS/MS scans acquired in the LTQ. Dynamic exclusion was used with the following parameters: exclusion size 500, repeat count 2, repeat duration 30 s, exclusion time 180 s, exclusion window ± 6 ppm. Target values were set at 5 × 10⁵ and 104 for the survey and Tandem MS scans, respectively, and the maximum ion accumulation times were set at 200 ms in both cases. Regular scans were used both for the precursor and tandem MS with no averaging. The precursor isolation window was set at 2 m/z with mono-isotopic peak selection, and the FTMS preview option was used. The complete analysis comprised three independent biological replicates. In total 150 MS runs were carried out, with extensive blanks between each sample to avoid carry-over of peptides that could bias quantification.
Processing of the MS Data, Database Searches and Upload Into PRIDE
Peak lists (.mgf format) were generated using DTA supercharge (v1.19) software (http://msquant.sourceforge.net/) and searched with Mascot v2.2 (Matrix Science) against a combined database containing the aphid genome with 34,834 protein-coding gene models (http://www.aphidbase.com/aphidbase), the Buchnera genome with 587 protein coding genes (including 14 predicted pseudogenes and a few plasmid genes) (14) (supplemental Table S1) and 187 sequences for known contaminants (e.g. keratin, trypsin) and concatenated with a decoy database where all the sequences were reversed; in total this database contained 71,216 protein sequences. For off-line calibration, first a preliminary search was conducted with the precursor tolerance window set at ±30 ppm. Peptides with the ion scores above 40 were chosen as benchmarks to determine the offset for each liquid chromatography (LC)-tandem MS (MS/MS) run. This offset was then applied to adjust precursor masses in the peak lists of the respective .mgf file for recalibration using a Perl script. The recalibrated peak lists were searched against the assembled Buchnera/aphid database. Each of the peak lists were searched using Mascot v2.2 (maximum p value of 0.01) for full tryptic peptides using a precursor ion tolerance window set at ±6 ppm, variable methionine oxidation and fixed cysteine carbamido-methylation and maximally one missed cleavage allowed. The maximum fragment ion tolerance (MS/MS) was 0.8 Da. The minimal ion score threshold was chosen such that a peptide false discovery rate (FDR) below 1% was achieved. Using an in-house written filter, the search results were further filtered as follows: For identification with two or more peptides, the minimum ion score threshold was set to 30. For protein identification based on a single peptide, the minimum ion score threshold was set to 33, and the mass accuracy of the precursor ion was required to be within ±3 ppm. The peptide FDR was calculated as: 2 × (decoy_hits)/(target + decoy hits) and was below 1%. The FDR of proteins identified with two or more peptides was zero. Peptides with less than seven amino acids were discarded. All mass spectral data (the mgf files reformatted as PRIDE XML files) are available via the Proteomics Identifications database (PRIDE) at http://www.ebi.ac.uk/pride/. For those proteins identified with only one unique peptide (irrespective of charge state and PTM), we provided for each accession the charge state, m/z value, mass error for the precursor ion, the peptide ion score and E-value as reported by MASCOT, as well as assigned MS/MS spectrum (supplemental Data).
The predicted Buchnera proteome is ∼60-fold smaller than the predicted aphid proteome. We were concerned that searching a combined Buchnera/aphid database could potentially lead to masking some lower scoring Buchnera proteins by the large number of aphid sequences. Therefore, we searched the spectral data also against separate aphid and Buchnera databases, but this did not result in a significant change in identification of Buchnera proteins and these results will not be further considered (not shown).
Selection of the Best Gene Models, Quantification and Creation of Protein Groups With a High Percentage of Shared Matched Spectra
Several aphid genes have more than one gene model, and in such cases the protein form with the highest number of matched spectra was selected; if two gene models had the same number of matched spectra, the model with the lower digit was selected. For quantification, each protein accession was scored for total spectral counts (SPC), unique SPC (uniquely matching to an accession) and adjusted SPC (25). The latter is the sum of unique SPCs and SPCs from shared peptides across accessions with SPC distributed in proportion to their unique SPCs, if applicable. The normalized adjSPC (NadjSPC) for each protein was calculated through division of adjSPC by the sum of all adjSPC values for the proteins from that gel lane. To calculate the relative abundance for each protein sample type (per gel lane), the total adjSPC was divided by the predicted protein length, yielding the spectral abundance factor (SAF). The SAF values were then normalized to the total SAF of proteins identified in the gel lane, yielding normalized spectral abundance factors (NSAFs). NadjSPC provides a relative protein abundance measure by mass, whereas NSAF estimates relative protein concentration within a particular sample. Proteins that shared more than ∼80% of their matched adjusted peptides with other proteins across the complete data set were grouped into clusters by generating a similarity matrix through calculation of the dice coefficient between each pair of identified proteins as described in (25). In all analyses the group was represented by a single member of the group with the highest value of adjSPC across all experiments and highest alphabetical order.
Functional Classification of Quantified Proteins
Aphid proteins were classified by Gene Ontology (GO) (www.geneontology.org/) using only GO terms within ‘molecular function’. GO terms for each protein were collated, and then every GO term was ranked according to its abundance in the data set. All GO terms with ≥10 entries in the data set were assigned to one of seven functional groups: Metabolism, Signaling, Structural, Homeostasis, Transport, Information Transfer (i.e. associated with transcriptional and translational machinery), or “Other” for proteins without GO terms. All proteins described by the highest ranking GO term (i.e. with the most proteins) were assigned to the relevant functional group. The procedure was then repeated for the remaining proteins, using the second-ranking GO term; then the third, and so on. This procedure excluded multiple scoring of proteins. Multifun classification, developed for Escherichia coli (26), is better suited than GO for the small and functionally biased Buchnera gene content. Buchnera proteins were classified into six Multifun categories, selected manually to accommodate the function of expressed proteins: Metabolism (Multifun category 1); Information Transfer (Multifun category 2, except 2.3.4); Transport (Multifun category 4), Flagellum (Multifun category 6.4), Homeostasis, comprising Protection (Multifun category 5.6) and Chaperones & Stress Response (Multifun categories 2.3.4 & 5.5); and Other. To avoid double-counting proteins with multiple Multifun category entries, the arbitrary rule was adopted that any proteins entered as (a) Metabolism or Information Transfer, and (b) another category (Transport, Homeostasis) were omitted from the list of Metabolism and information Transfer proteins.
Hierarchical Clustering Analysis
Proteins with similar profiles across the samples in Fig. 1 were grouped by hierachical clustering, a method that requires no prior assumptions about the number of clusters (27). Proteins with abundance <0.001 nadjSPC were excluded, after tests with different thresholds confirmed that this level was optimal (not shown). Using the Statistics toolbox of MATLAB version 7 (Mathworks, Inc.), the linear correlation (ρ) between every pair of proteins with NadjSPC distribution across the protein profiled of WB, BC, Bu-1, Bu-2, and BR:,X1,…Xn and Y1,,…Yn where n = 5.
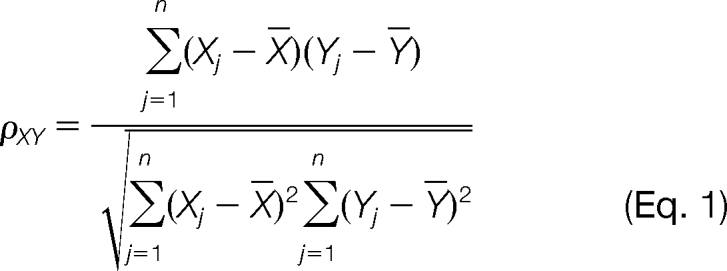 |
was derived. This was then converted into a distance measure ΔXY = 1 − ρXY. Protein pairs with similar profiles across the fractions have higher correlations and in turn, have smaller distance values. A linkage map based on the average distance among protein pairs was then constructed to yield a hierarchical cluster tree (dendrogram).
Transmission Electron Microscopy
Buchnera samples prepared as for Bu-1 samples (see above) were fixed on ice-cold 2% glutaraldehyde in 0.05 m cacodylate buffer and 4% sucrose for 2 h, postfixed on 1% osmium tetroxide for 1 h, and dehydrated in ethanol series. The pellet was embedded in Qyetol 651 epoxy resin (Electron Microscopy Sciences, Hartfield, PA) and polymerized for 8 h at 60 °C. After sectioning and staining with lead citrate and uranyl acetate, the samples were examined hours at 60 °C. After sectioning and staining with lead citrate and uranyl acetate, the samples were examined with a Morgagni model 268 TEM (FEI Co., Hillsboro, OR) operated at 80 kV. Images were obtained on a model AMT XR-40 four megapixel CCD digital camera (Advanced Microscope Techniques Corp, Woburn, USA).
RESULTS
Biological Properties of the Fractions Used for Proteome Analysis
We generated a series of samples from pea aphids (by combined dissection, homogenization, and differential centrifugation; three independent replicates) designed to obtain progressive enrichment of the symbiotic bacterium Buchnera from the whole body of the aphids (WB) through dissected bacteriocytes (the cells containing Buchnera, BC), partially purified from dissected maternal bacteriocytes (Bu-1) to Buchnera cells purified by Percoll gradient centrifugation (Bu-2) (Fig. 1). The fifth set of samples comprised the residual fraction of dissected bacteriocytes (BR), which did not contain intact Buchnera cells detectable by light microscopy. Transmission electron microscopy revealed that the isolated Buchnera cells were intact and were bounded by two membranes (Fig. 1, insert), in contrast to three membranes bounding Buchnera cells in the bacteriocyte (and present in BC samples) (28), suggesting that the outermost membrane, known as the symbiosomal membrane of aphid origin, was eliminated during preparation of Bu-1 and Bu-2.
Proteomics Workflow for Identification and Quantification of Aphid and Buchnera Proteins
The proteomics workflow is summarized in Fig. 2. The proteins in each sample were separated by SDS-PAGE (Fig. 3A), followed by processing of the gel lanes for data-dependent MS/MS analysis using a nanoLC-ESI-LTQ-Orbitrap mass spectrometer. Three independent biological replicates were used. Using MASCOT software, the spectral data were searched against the combined aphid genome sequence and the Buchnera sequenced genome. The search results were further processed to: (i) reduce false positive identification, (ii) avoid over-identification of members of protein families, and (iii) select the best gene model for each gene. This finally resulted in identification of 1940 aphid proteins (out of 34,616 predicted aphid proteins, counting only one model per gene) and 400 Buchnera proteins (out of 584 predicted proteins and pseudogenes) (supplemental Table S1A). Thus we identified ∼68% of the predicted Buchnera proteome. Using the predictor TM-HMM (http://www.cbs.dtu.dk/services/TMHMM/), and the signal peptide predictor SignalP (http://www.cbs.dtu.dk/services/SignalP/) to remove false positive single transmembrane domain (TMD) proteins, we estimated that the theoretical Buchnera proteome has about 85 integral α-helical TMD proteins. We detected 37 of these TMDs proteins (43%) indicating that these TMD were well represented in the identified proteome even if they were somewhat underrepresented as can be expected.
Fig. 2.

Experimental and bioinformatics workflow of the proteome analysis.
Fig. 3.

The proteome of the pea aphid and bacteriocyte fractions. A, 1D-SDS-PAGE gel lanes of the five different types of fractions (WB, BC, Bu1-, Bu-2, and BR) stained with Coomassie Brilliant Blue. Only one of the three independent biological replicates is shown here. B, C, Total number of proteins (B) and total mass of proteins (C) based on NadjSPC of aphid origin (gray) and Buchnera origin (white). D, Functional classification of quantified proteins, expressed as number of proteins (top row) and abundance, expressed as mean NSAF normalized to total aphid or Buchnera proteins (bottom row). Details (protein accession number and individual NadjSPC and NSAF) can be found in supplemental Table S1B.
To allow quantitative analysis of the distribution of identified proteins within and across the different fractions, we used the spectral count (SPC) information. The spectral counting technique is based on the observation that the number of successful MS/MS acquisitions of peptides coming from a protein shows a positive and linear correlation to the relative concentration of this protein in the studied sample (24, 29, 30). Spectral counting is particularly effective to detect large quantitative differences (much better than stable isotope labeling techniques), as expected in our study when comparing cellular fractions that are very different in function and composition. Meaningful spectral counting of complex proteomes requires a mass spectrometer with a high duty cycle and benefits from high resolution and high accuracy instrument such as the LTQ-Orbitrap as it reduces the false positive rate of peptide identification (31, 32). We previously developed the SPC workflow and tested it for Arabidopsis and maize organelles, cell-types, and complexes (24, 33, 34). The relative amount (mass) of each identified protein within each replicate was calculated based on the adjusted number of matched MS/MS spectra (adjSPC), normalized by the sum of adjusted SPC in the replicate, yielding NadjSPC. For quantification purposes, proteins that shared more than ∼80% of their matched MS/MS spectra were grouped using the workflow developed in (25) (Fig. 2). The relative concentration for each identified protein was calculated as the NSAF, which was calculated from adjSPC weighted for protein length (24). In total 254 aphid proteins were assigned into 104 groups. Just 2 Buchnera proteins needed to be grouped, which is consistent with the low proteome complexity and absence of gene duplications (supplemental Table S1B).
Whereas there has now been ample demonstration that label-free spectral counting is a viable method for protein quantification, it was important to test the variation among biological replicates for each sample type. Such variation could result from the fractionation and isolated procedures and/or the complete proteomics workflow from SDS-PAGE, in gel digests and MS/MS itself. Therefore, the reproducibility among the biological replicates within each of the five sample types (WP, BC, Bu1, Bu2, and BR) was determined by Pearson's linear correlation analysis, summarized in Table I. The pair-wise correlations were calculated for the proteins present in each replicate pair and showed that the replicates were highly similar (coefficients between 0.87 and 0.98). This shows that we were able to reproducible generate the different subcellular fractions and that the proteomics workflow was robust. We also calculated the correlation coefficient for groups of proteins within specific expression intervals (one order of magnitude each). This confirmed the notion that quantification is more reliable for proteins with higher numbers of matched spectra. In particular, the correlation for proteins with NadjSPC >0.001 (i.e. those that represent more than 0.1% of the total protein mass) showed good reproducibility (Table I). We note that all correlations were done prior to the grouping by similarity matrix of closely related proteins (supplemental Table S1A; see Fig. 2); the grouping will decrease variation and therefore our test measured the worst-case scenario.
Table I. Pearson's linear correlation analysis for the NadjSPC values across the three biological replicates for each of the five sample types. Within each comparison, 0–0 pairs were removed to avoid artificial increase of the correlation values. For each pair is listed: the correlation coefficient, the p value in paranthesis, and the number of proteins in brackets.
| Avg (NadjSPC) >0 (i.e. all detected proteins) | |||
|---|---|---|---|
| Sample | REP(1,2) | REP(2,3) | REP(1,3) |
| WB | 0.911046 (0.000000) [1456] | 0.935535 (0.000000) [1577] | 0.915923 (0.000000) [1755] |
| BC | 0.973189 (0.000000) [1026] | 0.975794 (0.000000) [930] | 0.968234 (0.000000) [1137] |
| Bu1 | 0.942316 (0.000000) [737] | 0.949920 (0.000000) [650] | 0.966941 (0.000000) [785] |
| Bu2 | 0.950022 (0.000000) [519] | 0.956288 (0.000000) [521] | 0.973451 (0.000000) [553] |
| BR | 0.907301 (0.000000) [1156] | 0.946602 (0.000000) [1236] | 0.870057 (0.000000) [1408] |
| Avg (NadjSPC) > = 0.01 | |||
| Sample | REP(1,2) | REP(2,3) | REP(1,3) |
| WB | 0.901750 (0.000362) [10] | 0.968338 (0.000004) [10] | 0.927791 (0.000109) [10] |
| BC | 0.994483 (0.000000) [11] | 0.996094 (0.000000) [11] | 0.995430 (0.000000) [11] |
| Bu1 | 0.989705 (0.000000) [15] | 0.990646 (0.000000) [15] | 0.991988 (0.000000) [15] |
| Bu2 | 0.982754 (0.000000) [18] | 0.990855 (0.000000) [18] | 0.984292 (0.000000) [18] |
| BR | 0.933994 (0.000001) [14] | 0.952317 (0.000000) [14] | 0.863387 (0.000069) [14] |
| Avg (NadjSPC) > = 0.001 and <0.01 | |||
| Sample | REP(1,2) | REP(2,3) | REP(1,3) |
| WB | 0.676583 (0.000000) [190] | 0.807994 (0.000000) [190] | 0.722070 (0.000000) [190] |
| BC | 0.651988 (0.000000) [185] | 0.693290 (0.000000) [185] | 0.495089 (0.000000) [185] |
| Bu1 | 0.743508 (0.000000) [178] | 0.521708 (0.000000) [178] | 0.557247 (0.000000) [178] |
| Bu2 | 0.779909 (0.000000) [170] | 0.675159 (0.000000) [170] | 0.674097 (0.000000) [170] |
| BR | 0.558248 (0.000000) [188] | 0.835215 (0.000000) [188] | 0.619625 (0.000000) [188] |
| Avg (NadjSPC) > = 0.0001 and <0.001 | |||
| Sample | REP(1,2) | REP(2,3) | REP(1,3) |
| WB | 0.211049 (0.000000) [821] | 0.312124 (0.000000) [811] | 0.370317 (0.000000) [835] |
| BC | 0.159327 (0.000240) [527] | 0.315368 (0.000000) [473] | 0.137764 (0.001402) [535] |
| Bu1 | 0.121923 (0.023725) [344] | 0.178438 (0.001819) [303] | 0.014824 (0.783194) [347] |
| Bu2 | 0.195202 (0.003078) [228] | 0.123246 (0.068064) [220] | 0.071228 (0.286327) [226] |
| BR | 0.099402 (0.011413) [647] | 0.388469 (0.000000) [614] | 0.135713 (0.000445) [666] |
| Avg (NadjSPC) > = 0.00001 and <0.0001 | |||
| Sample | REP(1,2) | REP(2,3) | REP(1,3) |
| WB | −0.606859 (0.000000) [435] | −0.362424 (0.000000) [525] | −0.558647 (0.000000) [679] |
| BC | −0.499333 (0.000000) [301] | −0.392403 (0.000000) [227] | −0.495410 (0.000000) [374] |
| Bu1 | −0.547358 (0.000000) [197] | −0.540131 (0.000000) [129] | −0.566530 (0.000000) [221] |
| Bu2 | −0.679944 (0.000000) [103] | −0.350547 (0.000141) [113] | −0.447838 (0.000000) [139] |
| BR | −0.591225 (0.000000) [304] | −0.379592 (0.000000) [372] | −0.539781 (0.000000) [495] |
Figs. 3B and 3C display the number of aphid and Buchnera proteins and the total adjSPC in each of the five sample types. The aphid proteins were substantially depleted (in number and mass) in the BC samples and even more in Bu-1 and Bu-2 samples, whereas Buchnera proteins were enriched in BC samples, relative to WB. The number and identity of Buchnera proteins detected were very similar among the three preparations dominated by Buchnera, i.e. BC, Bu-1, and Bu-2 (Fig. 3A and supplemental Tables S1A, S1B), suggesting that the proteome analysis had been successful in capturing the great majority of Buchnera proteins (see next section). This analysis shows that the fractionation procedure and proteome analysis were successful technically, providing a basis for the analysis of aphid and Buchnera proteins, and their distribution across the different samples.
The Buchnera Proteome
The most appropriate preparation for quantitative analysis of Buchnera proteins within the Buchnera cells was the most highly purified Buchnera preparation, Bu-2. The relative concentration (NSAF) of the 388 Buchnera proteins in the Bu-2 samples spanned nearly four orders of magnitude from 0.00015% to 8.7% (supplemental Table S1B). All identified Buchera proteins were assigned to one of seven functional groups (see supplemental Tables S1A, S1B). The distribution of the proteome across these seven groups (Fig. 3D), showed that primary metabolism and information transfer (DNA, RNA and protein transformations) accounted together for 76% of the number of identified proteins and 65% of the total protein concentration.
The most abundant Buchnera protein was GroEL (NP_239860.1), a molecular chaperone previously demonstrated as an abundant protein of Buchnera (35). GroEL accounted for 8.7% of the protein concentration in the Bu-2 samples; and it was the most abundant protein in every other sample type, with NSAF values of 2.9% for WB, 10% for BC, and 4.9% for BR. GroES (NP_239859.1), the co-protein of this chaperone, was also abundant in Bu-2 samples (ranked #12 in relative concentration, 1.1% NSAF). This first quantitative proteome study of the aphid-Buchnera symbiosis offers the strongest confirmation of many studies over the last 25 years that GroEL is the dominant Buchnera protein (36–38). GroESL is believed to play a crucial role in the stabilization of the proteins coded by the many Buchnera genes that have accumulated deleterious mutations as a result of repeated population bottlenecks at vertical transmission (39). Other high-ranking chaperones detected were the Hsp70 family member DnaK (NP_239985.1, #5, 1.8%), and HtpG (NP_240294.1, #6, 1.5%) (in parentheses are provided the gene name, and the rank number and %NSAF in Bu2). The second most abundant Buchnera protein in Bu-2 samples was AhpC (NP_240013.1), alkyl hydroperoxide reductase (4.3%), with a predicted role in eliminating hydrogen peroxide. Overall, the Buchnera proteins classified to a protective role, both against protein denaturation and against environmental stress (Multifun categories 2, 3, 4, and 5) accounted for 20% NSAF (Fig. 3D).
It is well established that the core function of Buchnera in the aphid symbiosis is the synthesis of EAAs, which are supplied to the aphid host (40). All enzymes in amino acid metabolism annotated in the Buchnera genome were detected in the proteome (supplemental Tables S1A, S1B, and S2). The relative concentration of proteins contributing to EAA synthesis ranged from 0.002% (ArgE, NP_239884.1) to 1.28% (IlvC, NP_240398.1). The median NSAF for proteins varied significantly among the various EAA biosynthetic pathways (Kruskal Wallis test: H8 = 16.73, p < 0.05), but the significance was lost when the arginine biosynthetic pathway was omitted from the data (Kruskal Wallis test: H7 = 12.69, p > 0.05). The cumulative NSAF for EAA synthesis proteins was 16%. This value represented nearly half of the total NSAF (35%) in Bu-2 for proteins with metabolic function. Proteins involved in DNA, RNA and protein transformations are classified separately from the metabolic enzymes and collectively represent NSAF of 30% (Fig. 3D).
Buchnera has the genetic capacity to synthesize the structural components of the flagellum, except for flagellin, FliC, and flagellar motor proteins; and the flagellar bases are uniformly distributed over the outer surface of Buchnera cells (23). Twenty flagellar proteins could be quantified, including the nine proteins reported previously (23), collectively accounting for 3.5% of NSAF (Fig. 3D).
Buchnera has 14 genes with predicted capacity to transport small molecules across its inner membrane. Six transporter proteins were detected: two channels, OmpF (NP_240177.1) at high relative concentration (#4, 1.95% NSAF) and MscS (NP_240264.2, #394 0.017%), but not the third predicted channel protein, the glyceroaquaporin GlpF (NP_240129.1); both of the phosphotransferase systems PtsG (NP_240174.2, #279, 0.05%) and MtlA (NP_240376.1, #346, 0.029%); the phosphate transporter PitA (NP_240390.1, #543, 0.0022%); and one subunit, MdlB (NP_240291.1, #558, 0.0013%), of the ABC transporter MdlAB. The Buchnera genes secABEGY code for the Sec protein export system of Buchnera, of which SecAEGY were detected in Bu-2 samples, and SecB in Bu-1 (but not Bu-2) samples. The Buchnera proteins with transport function in Bu-2 samples represented 5% of the total protein concentration.
There are 14 predicted pseudogenes in the Buchnera genome, but the possibility that at least some may code for proteins is raised by the evidence for transcriptional slippage in Buchnera (41). One of the 14 pseudogenes with transcriptional slippage was detected in the proteome: DdlB (d-alanine-d-alanine ligase B (BB0079). Insertion of an extra A by transcriptional slippage would mediate amino acid sequence switch from frame-1 to frame-3 and the reconstructed DdlB protein (307 amino acids) includes the predicted site of transcriptional slippage and the residues contributing to the active site, E15, S150, and S281 (supplemental Fig. S1). The proteome analysis detected most of the amino acid residues of this 307 aa protein, including protein sequence for both frame-1 and frame -3 (supplemental Fig. S1). However, we cannot exclude that also a truncated protein accumulated resulted from just frame 1 translation and full functionality of the stop codon.
The Aphid Proteome
A total of 1943 individual aphid proteins were detected, representing the largest aphid proteome set to date, and assigned to one out of seven functional groups (supplemental Table S1A). Of these, 1762 (90%) were present in the WB samples and 1414 (73%) were detected in one or more of the bacteriocyte samples (i.e. BC, BR, Bu-1, Bu-2). The very abundant proteins were generally common across all samples. For example, the ten most abundant aphid proteins in the WB samples were mostly ranked in the top 30 aphid proteins in the BR and BC samples, and vice versa. Among the four sample types derived from dissected bacteriocytes (Fig. 1), the greatest number of aphid proteins (1,171) were detected in the BR samples (Fig. 3B). The aphid proteins detected in bacteriocyte samples other than BR were generally of low abundance (median 0.0003% NSAF). Our detailed functional analysis of the proteome in the bacteriocyte and whole aphid was conducted on the WB and BR samples. The most strongly represented functional class in both WB and BR was metabolism, whether expressed per number of proteins or protein mass (Fig. 3D). The representation of functional classes was similar in WB and BR samples on the protein number basis, but metabolism was relatively over-represented and structural proteins under-represented in BR on the quantitative (NSAF) basis.
Cluster Analysis of Protein Partitioning Between Aphid and Buchnera Compartments
To investigate the partitioning of host and symbiont proteins to the bacteriocyte and Buchnera fractions, the proteins with abundance >0.001 NadjSPC were subjected to hierarchical clustering, generating the dendrogram shown in Fig. 4. We used this cutoff based on the correlation analysis presented above (Table I) and also after testing clustering with different cutoffs. Two main clusters were detected, with cluster-A containing proteins that are depleted in Bu-1 and Bu-2 samples, and cluster-B comprising proteins enriched in these samples. Cluster-A could be divided into several subclusters, including subcluster A2 containing proteins enriched in bacteriocytes, and subcluster A1b-1 comprising proteins depleted in bacteriocytes (Fig. 4; cluster ids are provided for all clustered accessions in supplemental Table S1B).
Fig. 4.

Hierarchical cluster analysis of protein distribution across the five fractions. The abundance is indicated by the colors, expression increased from green to black to red. There are two main clusters (A and B), with cluster A divided in four subclusters. Accessions numbers in each of these clusters can be found in supplemental Table S1B. None of the Buchnera proteins were found in cluster A.
The contribution of aphid and Buchnera proteins to the different clusters was analyzed. All the Buchnera proteins were restricted to cluster B. In other words, we did not find evidence for the selective export of proteins from Buchnera cells into aphid cells. Even so, Buchnera proteins were detected in the BR samples (which lacked Buchnera cells, as determined by light microscopical analysis). Consistent with the interpretation that these proteins were derived from Buchnera cell breakage during sample preparation (and not selective secretion), the abundance of Buchnera proteins present in both the Bu-2 and BR samples was significantly correlated (Spearman's Rank Test: rs = 0.536, p < 0.001).
Only four aphid proteins were allocated to cluster B representing proteins highly enriched in the purified Buchnera cells indicating that the great majority of aphid proteins were not associated selectively with Buchnera cells, as expected. Thus except for possibly these four proteins, no aphid proteins were detected that appeared synthesized specifically for sorting into the Buchnera cells. These four proteins are: ACYPI001025 (mitochondrial α-ketoglutarate/malate carrier protein), ACYPI002559 (monocarboxylate transporter), ACYPI0004040 (a conserved hypothetical protein and ortholog, by reciprocal top BLAST hit, to Drosophila CG2206), and ACYPI004434 (elongation factor 1α). Careful manual evaluation of the distribution and abundance, as well as the experimental variation (i.e. CVs of NadjSPC) of these four proteins across the four fractions, did not show robust evidence that these four proteins were indeed specifically enriched in Buchnera cells. Rather these four proteins were contaminants in BR samples. We conclude therefore that the proteome analysis did not support the hypothesis that a subset of aphid proteins is specifically synthesized to carry out functions within the Buchnera cells.
Aphid Proteins Enriched in Bacteriocyte Samples
Of the 84 aphid proteins in subcluster-A2, enriched in bacteriocyte fractions (supplemental Table S1B), 60 (71%) had an annotated function in metabolism. These proteins and the five enriched transporters are considered below. Among the remaining proteins in this category, three classes were of particular interest. First were 8 of the 13 annotated subunits of vacuolar-type H+-ATPase (V-ATPase), including ACYPI002584 and ACYPI010077, ranked #4 and #9 and with NSAF 1.33% and 1.11%, respectively. Second were the two subunits of phenoloxidase, ACYPI001367 (ranked #115th NSAF 0.028%) and ACYPI004484 (#650, 0.016%), the sole proteins among the pea aphid gene products with an annotated defensive function (41) enriched in bacteriocytes. Finally, one protein, ACYPI005979 (#277, 0.087%) was one of the five rare lipoproteins (Rlp A_5) that has been acquired by lateral gene transfer from a bacterial donor (not Buchnera) and is known to be transcribed in aphid bacteriocytes (42).
Aphid Enzymes in Amino Acid Metabolism Enriched in Bacteriocytes
Many of the proteins with metabolic function enriched in bacteriocyte fractions (subcluster-A2) were related to amino acid transformations, and their enrichment is predicted to be linked to the biosynthesis of amino acids by Buchnera. Metabolic network analysis (43) has revealed that Buchnera requires an input of four amino acids to support its amino acid biosynthetic function: glutamate, glutamine, aspartate, and serine. The enzymes mediating the biosynthesis of these amino acids (and no other amino acids) were all enriched in bacteriocytes.
Glutamine synthetase (GS: ACYPI001461,#148, 0.16%) and glutamate synthetase (GOGAT: ACYPI000303, #180, 0.13%) were strongly represented (in parentheses are provided the gene name, and the rank number and mean %NSAF normalized to total mean aphid proteins in BR samples). GS/GOGAT mediates the synthesis of glutamate and, where ammonia is not limiting and the demand for glutamate is not high, net glutamine is also generated (Fig. 5A). A candidate asparaginase, which mediates the hydrolysis of asparagine to aspartate, was also enriched (ACYPI005215, #14, 0.88%) (Fig. 5B). Finally, all three enzymes in serine biosynthesis from 3-phospho-d-glycerate were represented in subcluster A2: d-3-phosphoglycerate dehydrogenase (ACYPI006664, rank #10, 1.04%), phosphoserine aminotransferase (ACYPI004666, #64, 0.3%), and phosphoserine phosphatase (ACYPI000304, #83, 0.24%) (Fig. 5C).
Fig. 5.

Reactions and transport of metabolites across the aphid-Buchnera interface, deduced from the proteome of bacteriocytes. Blue arrows: reactions mediated by aphid proteins enriched in bacteriocytes (subcluster A2); green arrows: reactions mediated by aphid proteins depleted (subcluster A1b-1) or undetectable in bacteriocytes; white arrows: reactions mediated by aphid proteins that are not differentially expressed between whole body and bacteriocyte samples; orange arrows: reactions mediated by Buchnera proteins (cluster B); dotted arrows: transport reactions. A, Synthesis of glutamate and glutamine. B, Synthesis of aspartate. C, Synthesis of serine and reductive assimilation of inorganic sulfate into cysteine. D, Synthesis of ornithine from proline. E, synthesis of branched chain amino acids. F, Reactions mediated by cystathionine-γ-lyase (ACYPI000593). G, gluconeogenesis. H, Purine synthesis and recycling.
Subcluster A2, comprising aphid proteins enriched in the bacteriocytes, also included enzymes in the degradation of the tripeptide glutathione (γ-l-glutamyl-l-cysteinylglycine) to its constituent amino acids: specifically three isoforms of the peptidase PepN (ACYPI006675, #96, 0.22%; ACYPI009427, #156, 0.15%; ACYPI001203, #360, 0.065%) and 5-oxoprolinase (ACYPI004211, #405, 0.057%). Components of the glycine cleavage system, generating CO2 and ammonia were also enriched (ACYPI002795, #116, 0.19%; ACYPI005060, #175, 0.14%). Taken together with the presence of glutathionine synthase and enzymes for utilization of host-derived serine in cysteine and glycine synthesis in the Buchnera proteome, these data raise the possibility that Buchnera mediates the reductive assimilation of inorganic sulfate into cysteine, which is then delivered back to the aphid in the form of glutathione; with subsequent PepN-dependent recovery of cysteine from the glutathione, together with the degradation of glycine and recycling of glutamate. This putative cycle is illustrated in Fig. 5C.
The most abundant protein in the bacteriocyte proteome was ornithine aminotransferase (OAT) (ACYPI009480, #2, 1.67%), which mediates the reversible interconversion of ornithine and glutamate-γ-semialdehyde. In many animals, OAT is responsible for ornithine degradation, a key step in the degradation of arginine to glutamate, but the aphid apparently lacks an arginase (44), which mediates the first step in arginine degradation, and a catabolic role of OAT is, therefore, unlikely. Other data are consistent with the alternative interpretation that OAT mediates ornithine synthesis, specifically from proline (Fig. 5D). Specifically, the bacteriocytes were enriched for proline dehydrogenase (ACYPI002180, #221, 0.11%), the first step in the proline degradation pathway, yielding glutamate-γ-semialdehyde, the substrate for OAT; but the protein catalyzing the degradation of glutamate-γ-semialdehyde to glutamate (ACYPI006676) and reverse reaction generating glutamate-γ-semialdehyde from glutamate (ACYPI000665) were under-represented in the bacteriocyte samples. The metabolic fate of ornithine may include the provision of ornithine to Buchnera, supplementing the endogenous supply of this substrate for arginine synthesis. Importantly, ornithine decarboxylase (ACYPI002369 and ACYPI008106) which mediates the synthesis of putrescine, the substrate for polyamine synthesis by both aphid and Buchnera, was not detected. A role in arginine synthesis is further indicated by the significantly greater abundance of Buchnera proteins mediating the synthesis of arginine from ornithine than those mediating the synthesis of ornithine from glutamate (t6 = 3.44, p < 0.05) (Fig. 6).
Fig. 6.
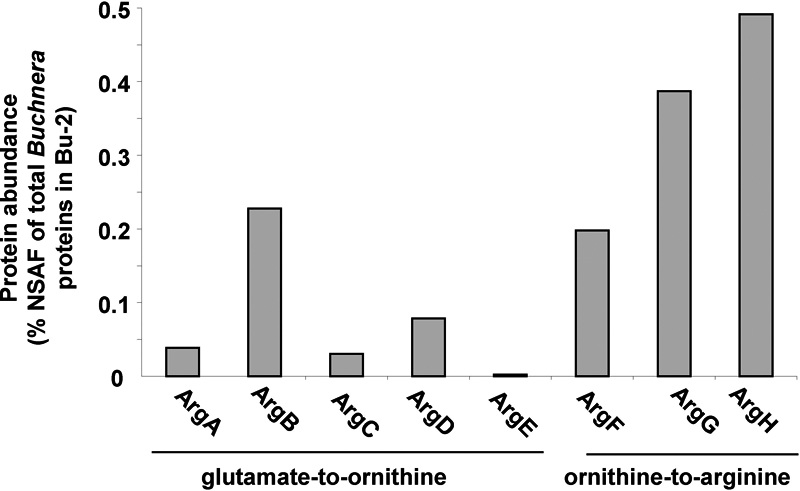
Abundance of individual Buchnera enzymes involved in the synthesis of arginine within the purified Buchnera cells.
Branched chain amino acid aminotransferase (BCAT) (ACYPI008372, #110, 0.2%) was enriched (Fig. 5E). BCAT in animals generally serves as the first step in the degradation of branched chain amino acids (BCAs, comprising leucine, isoleucine and valine), but it has been suggested that, in the pea aphid, this enzyme may mediate the final step in BCA synthesis, compensating for the absence of the equivalent gene, ilvE, in Buchnera (44). Other enzymes in BCA degradation were undetectable or depleted in bacteriocytes, including ACYPI002372 (acyl CoA dehydrogenase) mediating the equivalent intermediate step in isoleucine and valine degradation (from S-2-methyl-butyryl-CoA to tiglyl-CoA, and from isobutyryl-CoA to methylacrylyl-CoA, respectively), and ACYPI002843 (acetyl-CoA acetyltransferase), which catalyzes the final step in isoleucine degradation to acetyl CoA (ACYPI002843 also mediates the final step in the degradation of a second amino acid, lysine, which is not a BCA). These data support the hypothesis that BCAT has a predominantly biosynthetic function in the bacteriocyte.
Buchnera additionally lacks the gene for a second enzyme in the biosynthesis of one BCA, isoleucine: threonine dehydratase (ilvA), which mediates the production of the 2-oxobutanoate from threonine. It has been proposed that this reaction is mediated by the aphid threonine dehydratase (ACYPI006784), with the transfer of threonine from Buchnera to aphid, and of 2-oxobutanoate in the reverse direction (14). Contrary to this hypothesis, ACYPI006784 was not detected in the aphid proteome. A candidate alternative source of 2-oxobutanoate is cystathionine-γ-lyase (CGL) (ACYPI000593, #71, 0.27%), which is included in subcluster A2. Of the three reactions that CGL is annotated to mediate (Fig. 5F), two yield 2-oxobutanoate: from the substrates cystathionine and homoserine. Cystathionine could be derived from hemolymph (various insects have appreciable hemolymph cystathionine levels, although this has not been investigated in aphids (45, 46). Cystathionine is an intermediate in methionine degradation, but this pathway is apparently not functional in bacteriocytes because all aphid proteins annotated to this pathway were undetected in BC, Bu-1, Bu-2, and BR samples, apart from ACYPI004816 (present at low abundance in BR samples). The alternative substrate yielding 2-oxobutanoate, homoserine, is synthesized by Buchnera. CGL activity is also potentially a source of ammonia substrate for GS/GOGAT (Fig. 5A) and pyruvate for gluconeogenesis (see below).
Two enzymes in synthesis of the aromatic amino acid tyrosine are also assigned to subcluster A2: phenylalanine hydroxylase (ACYPI007803, #18, 0. 74%) mediating the conversion of phenylalanine to tyrosine, and dihydropteridine reductase (ACYPI006909, #33, 0.43%), in the recycling of tetrahydrobiopterin, the reductant in the phenylalanine hydroxylase reaction. These results confirm the evidence from the bacteriocyte transcriptome (47) that the bacteriocyte is an important source of tyrosine.
Aphid Enzymes in Gluconeogenesis Enriched in Bacteriocytes
Both of the two rate-limiting steps in gluconeogenesis were included in subcluster A2: phosphoenolpyruvate carboxykinase (ACYPI001978, #203, 0.12%) and fructose-1,6-bisphosphatase (ACYPI002694, #121, 0.18%). The glucose generated by this route may be translocated to Buchnera, for which glucose is the major carbon source (43). Glucose might also be used in sorbitol synthesis, as indicated by the enrichment of aldose reductase (ACYPI005685, #153, 0.16%), which mediates the NADPH-dependent reduction of glucose to sorbitol (Fig. 6G). Trehalose-6-phosphate synthase (ACYPI006164) was assigned to subcluster A1b-1, depleted in bacteriocytes, indicating that the major hemolymph sugar trehalose is not a major fate of glucose synthesized in the bacteriocyte. The noncarbohydrate carbon substrates for gluconeogenesis may include acetate, fumarate, succinate, and α-ketoglutarate, all predicted net products of Buchnera metabolism (43) fed into the TCA cycle and converted to oxaloacetate; and the degradation of glycine, which is a glucogenic amino acid (i.e. can be converted to glucose via gluconeogenesis). Glycerol, derived from the degradation of triglycerides, is unlikely to contribute to gluconeogenesis because four proteins with a role in β-oxidation of fatty acids were in subcluster A1b-1, depleted in bacteriocyte samples: ACYPI001113 and ACYPI003232 (acyl-CoA dehydrogenases), ACYPI006589-PA (3-hydroxyacyl-CoA dehydrogenase), and ACYPI008366-PA (acetyl-CoA acyltransferase). One of these proteins, ACYPI006589, is also annotated to mediate a key step in the degradation of the glucogenic branched chain amino acid valine. This and the data above suggest that amino acids are also not major substrates for gluconeogenesis in bacteriocytes.
Aphid Enzymes in Purine Metabolism Enriched in Bacteriocytes
Two of the three isozymes of ribose phosphate pyrophosphokinase, which mediates the synthesis of 5-phosphoribosyl-1-pyrophosphate (PRPP) from ribose-5-phosphate, were assigned to subcluster A2 (ACYPI006288, #79, 0.25%, and ACYPI001614, #162, 0.15%); the third isozyme was detectable but considerably less abundant (ACYPI006561, #444, 0.051%). PRPP contributes to the synthesis of purines, pyrimidines and NAD(P). Of these pathways, purine synthesis is probably particularly important in bacteriocytes (Fig. 5H) because three of six annotated aphid proteins mediating the synthesis of inosine monophosphate (IMP) from PRPP were also in subcluster A2 (ACYPI009448, #81, 0. 24%; ACYPI010114, #36, 0.42; and ACYPI008919, #88, 0.22%). Of the remaining proteins in this pathway, amidophosphoribosyltransferase (ACYPI001885, #711, 0.02%) and one of the two isoforms of adenylosuccinate lyase (ACYPI001812, #399, 0.058%) were readily detectable in the bacteriocyte proteome (the second isozyme of adenylosuccinate lyase, ACYPI007825, was detectable, but was below the threshold for cluster analysis. The other purine metabolism enzymes enriched in bacteriocyte samples relate to the predicted purine metabolite exchange with Buchnera (48): GMP synthase (ACYPI006177, #278, 0.087%) and two 5′nucleotidases (ACYPI007730, #41, 0.40%; ACYPI002452, #454, 0.049%), for the production of guanosine, delivered to Buchnera, and both of the isozymes of adenine phosphoribosyltransferase, which metabolize adenine, received from Buchnera, to AMP (ACYPI003436, #24, 0.53%; ACYPI003109, #52, 0.35%) (Fig. 5H). A further protein enriched in bacteriocyte samples was ACYPI001365 (#214, 0.11%). Although annotated as “insect-derived growth factor,” the homolog of this protein has been reported to have adenosine deaminase activity in the fleshfly Sarcophaga peregrine (49), raising the possibility that this protein mediates the transformation of adenosine to inosine.
Aphid Transporters Enriched in Bacteriocytes
Five proteins with transporter function were enriched in bacteriocytes. They are annotated as a candidate Na+-dependent phosphate transporter (ACYPI003986, #172, 0.14%), a low affinity cationic amino acid transporter (ACYPI008904, #187, 0.13%), a K+/Cl− symporter (ACYPI000507, #281, 0.086%), an ABC transporter (ACYPI009528, #578, 0.031%), and the mitochondrial ATP/ADP translocase (ACYPI000784, #31, 0.44%). ACYPI003986 (phosphate transporter) is one of two putative inorganic ion transporters detected in the bacteriocyte proteome, the other being ACYPI001177 (#926, 0.01%), annotated as a sulfate transporter; and these two transporter may contribute to the delivery of phosphate and sulfate to the Buchnera cells. ACYPI008904 (cationic amino acid transporter) may mediate the transport of the EAAs arginine and lysine from Buchnera cells to the surrounding bacteriocyte cytoplasm. The enriched ABC transporter is the ortholog of the human ABCA3 (NP_001080.1, member of the ABC1 subfamily), which is annotated as implicated in lipid (including cholesterol) transport and programmed cell death.
The proteome of BR samples also included 18 further aphid transporters, some of which are candidates for mediating the transfer of metabolites between the host and Buchnera symbiont. These transporters include two further amino acid transporters, ACYPI000536 (#412, 0.051%), the ortholog of the Drosophila protein CG8785 and ACYPI008971 (#599, 0.029%), mediating H+ coupled amino acid transport; and a sugar transporter ACYPI001077 (#613, 0.028%), designated ApST9 (Price et al., 2010). Four further members of the MFS superfamily identified in BR samples are probably not sugar-transporters (ACYPI002278_ApST38, ACYPI010074_ApST42, ACYPI007742_ApST45, and ACYPI009892, which has no ApST designation) (50). The bacteriocyte samples had two monocarboxylate transporters (ACYPI002559, #692, 0.021%, and ACYPI002787, #669, 0.023%), the candidate substrates for which could include glutamate and aspartate transferred from aphid to Buchnera (Figs. 5A, 5B), branched-chain oxoacid precursors for BCA synthesis by the aphid BCAT (Fig. 5E), 2-oxobutanoate provided to Buchnera for isoleucine synthesis (Fig. 5F), and Buchnera-derived organic acids delivered to the bacteriocyte as substrates for gluconeogenesis (Fig. 5G). Three organic cation transporters (ACYPI007237, #949, 0.0095%; ACYPI007903, #1032, 0.0073%; ACYPI005500, #1204, 0.0037%) were detected. The organic cations in bacteriocytes likely include polyamines, as well as cationic amino acids considered above. Five ABC transporters (additional to ACYPI009528 enriched in bacteriocyte samples considered above): two members of the MDR/TAP family (ACYPI003751 and ACYPI008583), and one member of the GCN20, White and ABC1 sub families (ACYPI009003, ACYPI007666, and ACYPI001137, respectively). Finally, a nucleoside transporter (ACYPI006094) which mediates the movement of nucleosides across membranes down their concentration gradient, could be responsible for the guanosine transport from bacteriocyte to Buchnera as a candidate substrate (Fig. 5H).
Aphid Proteins Depleted in Bacteriocytes
A total of 84 proteins were assigned to subcluster A1b-1, representing the proteins depleted in bacteriocyte samples relative to the whole body (supplemental Table 1). These included proteins involved in protein synthesis (e.g. ribosomal proteins), associated with endoplasmic reticulum function (e.g. Ca2+-transporting ATPase, ACYPI008535; perlecan, ACYPI010019; and perlecan, ACYPI010019) and both cytoskeletal and muscle proteins (e.g. β-tubulin, ACYPI008874, which is the most abundant aphid protein in the whole aphid samples; myosin proteins ACYPI008178, ACYPI000027; ACYPI006043; α-actinin, ACYPI000667). These data reflect the specialization of the bacteriocyte to house the Buchnera cells, which occupy >60% of the cytoplasmic volume (51), in contrast to, for example, myosin-rich muscle, ER-rich fat body cells, and the embryos with high protein synthesis rates that contribute to the whole body samples. The depletion of proteins involved in protein synthesis and ER-processing provides information on the fate of EAAs released from Buchnera cells, specifically that the EAAs received by the bacteriocyte are not incorporated substantially into protein before export to the rest of the aphid body. Just 14 (17%) of the proteins in cluster A1b-1 had a metabolic function.
DISCUSSION
Absence of Selective Protein Transfer Between Aphid and Buchnera
A key purpose of this study was to investigate the partitioning of host and symbiont proteins across aphid tissues and Buchnera cells, in order to test whether specific proteins are transferred selectively between the two partners. In principle, proteins transferred in either direction could be effector molecules regulating gene expression, metabolism, growth rates, and other biological functions that regulate or support the symbiosis. Such interactions are central to both bacterial pathogenesis (48) and the function of various symbioses (52, 53).
No evidence for the selective transfer of proteins among the partners was obtained from the cluster analysis, which revealed near-perfect separation of the aphid and Buchnera proteins across the cellular localizations. This result has major implications for our understanding of Buchnera function. In the absence of the selective import of proteins from the host (as occurs on organelles), the gene content of Buchnera encompasses the functional capability of this bacterium, thereby validating previous analyses of Buchnera function based on the Buchnera gene content alone (14, 43, 54). A further implication is that Buchnera differs from mitochondria and plastids (in plants and green algae), the proteomes of which are much greater than their respective genomes as a result of the specific targeting of many proteins synthesized by the nucleocytoplasm. Taken together with the evidence that functional Buchnera genes have not been translocated to the aphid genome (42), these data strongly suggest that Buchnera has greater genetic independence than organelles. Furthermore, if this trait is general among the bacteriocyte symbionts of insects, these data offer some assurance that the widespread use of bacterial gene content to describe the function of these bacteria e.g. (55–57) is biologically valid.
The proteome analysis additionally offers no evidence for the between-partner transfer of effector proteins that function in partner communication in this symbiosis. This interpretation should, however, be considered as tentative, because (i) effector proteins that are present in both host and symbiont may escape detection because they do not necessarily show a strong enrichment pattern, and (ii) only those 637 proteins/protein groups that were expressed above our set threshold level were part of the quantitative cluster analysis. Proteins below this expression threshold, or even proteins that were not detected, may include such effectors.
Metabolite Exchange Between Bacteriocytes and Buchnera
Biosynthesis and metabolite exchange are central to the function of the bacteriocyte and its complement of Buchnera cells. The growth and survival of the aphid depend on the sustained synthesis of EAAs by Buchnera; and because Buchnera is intracellular, all its metabolic requirements for growth and EAA production are derived from the surrounding bacteriocyte cytoplasm, and ultimately from the hemolymph (insect blood) bathing the bacteriocytes. The Buchnera proteome included all enzymes coded by the Buchnera genome that contribute to EAA synthesis, validating the genomic and transcriptomic evidence that Buchnera can produce EAAs (14, 58, 59). Furthermore, the abundance of EAA biosynthesis enzymes does not vary substantially among different biosynthetic pathways even though the amounts predicted from budget analyses and modeling studies vary among EAAs by an order of magnitude (43, 60). This discrepancy suggests that variation in the rates of synthesis among different EAAs is unlikely to be shaped by variation in abundance of the enzymatic machinery, raising the possibility that other factors, such as the supply of precursors from the host, might determine the amount of each EAA that the Buchnera cells produce and release to the host.
Prior to this analysis, understanding the metabolites exchanged between Buchnera and the bacteriocyte was based primarily on the reconstruction of the Buchnera metabolism and in silico modeling of flux through the metabolic network (14, 43, 61). These studies predicted that the host metabolites taken up by Buchnera cells include glucose as the dominant carbon source, four nonessential amino acids (nEAAs: serine, aspartate, glutamate, and glutamine) as precursors of EAAs, and the nucleoside guanosine as precursor of Buchnera purines. The finding here that enzymes involved in the production of these precursors are enriched in the aphid bacteriocyte offers empirical validation of the models.
These results, however, raise the question why many of the core precursors for Buchnera metabolism are synthesized in the bacteriocyte, when the bacteriocyte could depend entirely on import of the compounds from the hemolymph bathing the bacteriocytes. In particular, insect organs in contact with the hemolymph generally derive their sugar requirement by uptake and trehalase-mediated hydrolysis of the dominant hemolymph sugar, trehalose (62). Remarkably, the trehalase protein was barely detectable in the bacteriocyte, despite the high predicted glucose demand of the Buchnera cells (43). Instead, the two rate-limiting steps in gluconeogenesis were enriched (Fig. 5G), suggesting that bacteriocytes generate glucose by gluconeogenesis. The inclusion of enzymes mediating amino acid and lipid degradation in the protein cluster depleted in bacteriocytes (subcluster A1b-1 in Fig. 4) suggests that host-derived substrates do not make an important contribution to gluconeogenesis. This leaves the organic acids (acetate, fumarate, and succinate), that are the dominant “overflow metabolites” of the Buchnera metabolic network (43), as likely substrates for bacteriocyte gluconeogenesis. In other words, the bacteriocyte can potentially recycle Buchnera waste carbon compounds to glucose, which is delivered back to the Buchnera cells. In this way, the availability of glucose for uptake by Buchnera varies according to the metabolic activity of the complement of Buchnera cells within the bacteriocyte.
The importance of enzymatic reactions in the bacteriocyte as the source of inputs to Buchnera metabolism is further illustrated by the Buchnera amino acid and purine nutrition. Buchnera derives its supply of the eight nEAAs that it cannot synthesize (all but glycine and cysteine) from the host. This proteome study confirms the interpretation from genomic and transcriptomic analyses (14, 47) that one nEAA, tyrosine, is generated in the bacteriocyte from the Buchnera-derived EAA phenylalanine by the aphid phenylalanine hydroxylase. Of the remaining 7 nEAAs, four contribute to Buchnera-mediated synthesis of EAAs, and the enzymes generating these nEAAs (aspartate, glutamate, glutamine, and serine) are enriched and very abundant in the bacteriocyte proteome (Figs. 6A–6C). Routes for the synthesis of the other three nEAAs (alanine, asparagine and proline) are not enriched in the bacteriocyte, and these amino acids are presumably derived principally from the hemolymph. Similarly, Buchnera lacks the genetic capacity to synthesize purines de novo, but can derive its nucleotide requirements from host-derived nucleosides, principally guanosine (14, 61). The detection in the bacteriocyte of every enzyme contributing to de novo purine synthesis, and enrichment of several enzymes, including those contributing directly to the synthesis of guanosine (GMP synthase and 5′nucleotidase) (Fig. 5H) suggests that, as with glucose and nEAAs contributing to Buchnera metabolism, guanosine is synthesized by the bacteriocyte and not derived from the hemolymph.
The hypothesis that the major metabolites taken up by Buchnera are synthesized in the bacteriocyte, and not imported from the hemolymph, is based on protein abundance. It requires testing by analysis of enzyme activities and metabolite flux in vivo. Even so, this likely pattern of host cell metabolism would facilitate precise, coordinated metabolic control by the host cell over the concentrations of the precursor pools for Buchnera metabolism. By controlling the supply of key metabolites to Buchnera, the host can regulate Buchnera metabolism, including its capacity for growth and production of EAAs. The one major exception to this generality relates to polyamines. Buchnera is dependent on the supply of putrescine from the host for its synthesis of spermidine (14), which is a very abundant Buchnera metabolite (47). In the absence of evidence for de novo synthesis of putrescine by ornithine decarboxylase in the bacteriocytes (Fig. 5D), this crucial substrate for Buchnera is probably derived directly from the hemolymph.
Metabolite exchange between host and symbiont is also dependent on transporters of both Buchnera and aphid origin. This is because each Buchnera cell is bounded by three membranes, the inner and outer bacterial membranes typical of a Gram-negative bacterium, and the outermost symbiosomal membrane of aphid origin (28). Although further research is required to identify the subcellular localization of the transporter proteins detected in this proteome analysis, the transporters of Buchnera origin were most likely located in Buchnera membranes (they were assigned to cluster-B) whereas many of the aphid transporters were probably symbiosomal because this is a very abundant membrane type in the bacteriocyte. For example, the surface area of the symbiosomal membrane is four times the surface area of the bacteriocyte cell membrane in the 7-day-old larvae used in this study [calculated from data in (63, 64)]. The annotated specificities of many of the transporters detected are consistent with the predicted metabolite transfer between the partners (e.g. phosphate, sulfate, glucose, amino acids, and nucleosides). Nevertheless, these annotations should be treated with great caution because their function is extrapolated from E. coli (for Buchnera transporters) and other insects or even vertebrates (for the aphid transporters). To date, the function of none of the transporter proteins identified in the proteome of the bacteriocyte or Buchnera has been studied empirically.
A further candidate route for exchange between the partners is the hundreds of flagellar bases that cover the surface of the Buchnera cells (14). These structures have been suggested to mediate the selective transfer of Buchnera proteins and possibly small molecules to the bacteriocyte cytoplasm (23, 58). The reasoning is that Buchnera flagellar bases cannot confer motility because the flagellum and motor proteins are not encoded in the Buchnera genome (14), and that they function as Type III secretion systems (to which bacterial flagellum is evolutionarily related (65, 66). In various pathogenic and symbiotic bacteria, type III secretion systems mediate the selective transfer of proteins from bacteria into eukaryotic cells (67). The identification of 20 flagellar proteins in this proteome study confirms and extends the previous proteomic and microscopical analysis (14). Nevertheless, the function of these remarkable structures remains unresolved, beyond the conclusion based on the cluster analysis (see above) that if they have any role in protein transfer, it is either nonselective or quantitatively small.
The Bacteriocyte as a Habitat for Symbiotic Bacteria
The intracellular habitat is widely regarded as an extreme environment because cells are colonized by relatively few microorganisms. Cellular defenses include efficient trafficking of intracellular microbes to lysosomes, apoptosis of cells infected by microbes, and the production of humoral immune effectors, such as anti-microbial peptides (68–70). Aphid bacteriocytes conform to this generality in some respects. They are occupied by very few bacterial species: Buchnera, and occasionally other bacteria (“secondary symbionts” e.g. Hamiltonella defensa, Regiella insecticola) that occur facultatively in aphids (71–73).
The nonmetabolic proteins enriched in the bacteriocyte proteome offer insight into the bacteriocyte as a habitat for bacteria. In particular, multiple subunits of the V-type H+ transporting ATPase (V-ATPase) are very abundant and enriched in the bacteriocyte proteome. The membrane localization of this ATPase has yet to be determined, but likely includes the lysosomes. Its abundance suggests that it may also be localized to the symbiosomal membranes, which are a major membrane fraction of bacteriocytes (see above), with the implication that the immediate environment of the Buchnera cells may be acidic.
Among the annotated immune-related genes, the only ones enriched in bacteriocytes are the two subunits of phenoloxidase. Phenoloxidase catalyzes the hydroxylation of monophenols to o-diphenols and ultimately to highly reactive quinines that react with oxygen to generate hydrogen peroxide and other reactive oxygen species (74). These reactions contribute to the sclerotization of insect cuticle and synthesis of melanin, which is important in wound healing and encapsulation of fungi, parasitic wasps etc., especially in the hemolymph (75, 76). The site of activity of the bacteriocyte phenoloxidase remains to be established. It may be released into the hemolymph, where it contributes to the hemolymph-based defenses, with the implication that the function of bacteriocytes extends beyond housing the Buchnera symbionts to contribute to the systemic immunity of the insect. Additionally or alternatively, phenoloxidase-mediated production of hydrogen peroxide may impose oxidative stress within the bacteriocyte. An independent indication that Buchnera is exposed to oxidative stress is that alkyl hydroperoxide reductase (AhpC) is the second most abundant protein in Buchnera cells studied here. The E. coli AhpC scavenges endogenous hydrogen peroxide, generated in particular by flavoenzymes, notably NADH dehydrogenase (NuoA-N) also present in Buchnera (77). The role of AhpC in protecting Buchnera from reactive oxygen species of endogenous origin and potentially generated by the host phenoloxidase is predicted to be particularly important because the Buchnera genome lacks homologs of the E. coli catalase genes katE and katG (14).
The bacteriocidal protein lysozyme has been reported previously as a major bacteriocyte transcript (47), but it was detected at low abundance in the proteome of just one of the three replicates studied here. Given that the proteome analysis was conducted on precisely-aged larval aphids in which Buchnera degradation is minimal (51, 63, 78), this result suggests that lysozyme is not important in regulation of the functional symbiosis. As reported previously (78), lysozyme may contribute to the orchestrated symbiosis breakdown in older insects.
A striking feature of this study is the lack of known immune effectors (41) that are enriched or abundant in the bacteriocyte proteome in 7-day old larvae, even though Buchnera cells occupy more than 60% of the volume of these cells. Aphid proteins without sequence homology to previously described immune-related proteins are also most unlikely to mediate immune responses in the aphid bacteriocyte because none of the proteins enriched in bacteriocytes are coded by either hypothetical or orphan genes. This condition is in stark contrast to various other animal-microbial symbioses, including independently-evolved bacteriocyte symbioses in other insects, where the host immune system plays a central role in determining the abundance and proliferation of the microbial symbionts (79–81). These considerations raise the possibility that, with the possible exception of the aphid phenoloxidase, the immune system may play little or no direct role in controlling the abundance and traits of Buchnera cells in the functional symbiosis of 7-day-old larvae. The dominance of enriched bacteriocyte proteins by metabolic enzymes involved in the supply of metabolites to the Buchnera raises the alternative hypothesis, that the Buchnera function, including population increase that is tightly coordinated with the host and sustained nutrient release, is regulated principally by the metabolic relations of the bacteria with the host cell. The important implication is that the specialized function of the bacteriocyte, which evolved de novo at the evolutionary inception of the aphid-Buchnera symbiosis, may not be underpinned by a suite of novel gene products unique to aphids. Instead, this novel cell type is founded on a unique expression profile of host and bacterial genes, many of which are individually widely distributed among animals and bacteria, respectively, and beyond.
Community Resources
More than 2.5 million MS/MS were acquired here on a high resolution (100,000), high accuracy mass spectrometer, and deposited in the public domain (PRIDE - http://www.ebi.ac.uk/pride/). These spectra provide a rich resource for improved aphid genome annotation. The pea aphid genome has only been assembled recently (International Aphid Genomics Consortium, 2010). It includes unsupported ab initio models, partial gene models, and genes incorrectly shown as duplicated in the first genome assembly. The MS/MS spectra provide a resource to the community to identify and validate gene models (proteogenomics).
Footnotes
* This research was supported by a grant to KVW and AED from the National Science Foundation (IOS-0919765) and the Sarkaria Institute of Insect Physiology and Toxicology. Part of this work was carried out by using the resources of the Computational Biology Service Unit of Cornell University which is partially funded by the Microsoft Corporation.
 This article contains supplemental Fig. S1 and Tables S1 and S2.
Comment for Readers: All mass spectrometry data (the 150 mgf files reformatted as PRIDE XML files) have been uploaded into the Proteomics Identifications database (PRIDE) at http://www.ebi.ac.uk/pride/, and are available to the readers via PRIDE. PRIDE Accession numbers: 14971-15120 (inclusive).
1 The abbreviations used are:
- EAA
- essential amino acid
- WB
- whole aphid bodies
- BC
- bacteriocytes
- Bu-1
- partially-purified Buchnera cells isolated from dissected bacteriocytes
- Bu-2
- Buchnera cells purified by Percoll gradient centrifugation
- BR
- supernatant fraction of dissected bacteriocytes
- PRIDE
- Proteomics Identifications database
- SPC
- spectral count
- NadjSPC
- normalized adjusted SPC
- NSAF
- normalized spectral abundance factor
- OAT
- ornithine aminotransferase
- GS
- glutamine synthetase
- GOGAT
- glutamate synthetase
- BCAT
- Branched chain amino acid aminotransferase
- BCA
- branched chain amino acid
- CGL
- cystathionine-γ-lyase.
REFERENCES
- 1. Douglas A. E. (2010) The Symbiotic Habit. Princeton, New Jersey: Princeton University Press [Google Scholar]
- 2. Moran N. A. (2007) Symbiosis as an adaptive process and source of phenotypic complexity. Proc. Natl. Acad. Sci. U.S.A. 104 Suppl 1, 8627–8633 [DOI] [PMC free article] [PubMed] [Google Scholar]
- 3. Embley T. M., Martin W. (2006) Eukaryotic evolution, changes and challenges. Nature 440, 623–630 [DOI] [PubMed] [Google Scholar]
- 4. Douglas A. E. (1989) Mycetocyte symbiosis in insects. Biol. Rev. 64, 409–434 [DOI] [PubMed] [Google Scholar]
- 5. Buchner P. (1965) Animal Endosymbioses with Plant Microorganisms. Chichester, UK: John Wiley & Sons [Google Scholar]
- 6. Wilcox J. L., Dunbar H. E., Wolfinger R. D., Moran N. A. (2003) Consequences of reductive evolution for gene expression in an obligate endosymbiont. Mol. Microbiol. 48, 1491–1500 [DOI] [PubMed] [Google Scholar]
- 7. Douglas A. E. (2006) Phloem-sap feeding by animals: problems and solutions. J. Exp. Bot. 57, 747–754 [DOI] [PubMed] [Google Scholar]
- 8. Pais R., Lohs C., Wu Y., Wang J., Aksoy S. (2008) The obligate mutualist Wigglesworthia glossinidia influences reproduction, digestion, and immunity processes of its host, the tsetse fly. Appl. Environ. Microbiol. 74, 5965–5974 [DOI] [PMC free article] [PubMed] [Google Scholar]
- 9. McCutcheon J. P. (2010) The bacterial essence of tiny symbiont genomes. Curr. Opin .Microbiol. 13, 73–78 [DOI] [PMC free article] [PubMed] [Google Scholar]
- 10. Fares M. A., Ruiz-González M. X., Moya A., Elena S. F., Barrio E. (2002) Endosymbiotic bacteria: GroEL buffers against deleterious mutations. Nature 417, 398 [DOI] [PubMed] [Google Scholar]
- 11. Moran N. A. (1996) Accelerated evolution and Muller's rachet in endosymbiotic bacteria. Proc. Natl. Acad. Sci. U.S.A. 93, 2873–2878 [DOI] [PMC free article] [PubMed] [Google Scholar]
- 12. Toft C., Andersson S. G. (2010) Evolutionary microbial genomics: insights into bacterial host adaptation. Nat. Rev. Genet. 11, 465–475 [DOI] [PubMed] [Google Scholar]
- 13. The International Aphid Genomics Consortium (2010) Genome sequence of the pea aphid Acyrthosiphon pisum. PLoS Biol. 8, e1000313 [DOI] [PMC free article] [PubMed] [Google Scholar]
- 14. Shigenobu S., Watanabe H., Hattori M., Sakaki Y., Ishikawa H. (2000) Genome sequence of the endocellular bacterial symbiont of aphids Buchnera sp. APS. Nature 407, 81–86 [DOI] [PubMed] [Google Scholar]
- 15. Douglas A. E. (1998) Nutritional interactions in insect-microbial symbioses: Aphids and their symbiotic bacteria Buchnera. Ann. Rev. Entomol. 43, 17–37 [DOI] [PubMed] [Google Scholar]
- 16. Cavalier Smith T. (2003) Genomic reduction and evolution of novel genetic membranes and protein-targeting machinery in eukaryote-eukaryote chimaeras (meta-algae). Philos Trans. R Soc. Lond. B 358, 109–133 [DOI] [PMC free article] [PubMed] [Google Scholar]
- 17. Martin W. (2010) Evolutionary origins of metabolic compartmentalization in eukaryotes. Philos Trans. R. Soc. Lond. B 365, 847–855 [DOI] [PMC free article] [PubMed] [Google Scholar]
- 18. An Nguyen T. T., Michaud D., Cloutier C. (2007) Proteomic profiling of aphid Macrosiphum euphorbiae responses to host-plant-mediated stress induced by defoliation and water deficit. J. Insect Physiol. 53, 601–611 [DOI] [PubMed] [Google Scholar]
- 19. Le Trionnaire G., Francis F., Jaubert-Possamai S., Bonhomme J., De Pauw E., Gauthier J. P., Haubruge E., Legeai F., Prunier-Leterme N., Simon J. C., Tanguy S., Tagu D. (2009) Transcriptomic and proteomic analyses of seasonal photoperiodism in the pea aphid. BMC Genomics 10, 456 [DOI] [PMC free article] [PubMed] [Google Scholar]
- 20. Carolan J. C., Fitzroy C. I., Ashton P. D., Douglas A. E., Wilkinson T. L. (2009) The secreted salivary proteome of the pea aphid Acyrthosiphon pisum characterised by mass spectrometry. Proteomics 9, 2457–2467 [DOI] [PubMed] [Google Scholar]
- 21. Francis F., Guillonneau F., Leprince P., De Pauw E., Haubruge E., Jia L., Goggin F. L. (2010) Tritrophic interactions among Macrosiphum euphorbiae aphids, their host plants and endosymbionts: investigation by a proteomic approach. J. Insect Physiol. 56, 575–585 [DOI] [PubMed] [Google Scholar]
- 22. Wang Y., Carolan J. C., Hao F., Nicholson J. K., Wilkinson T. L., Douglas A. E. (2010) Integrated metabonomic-proteomic analysis of an insect-bacterial symbiotic system. J Proteome Res. 9, 1257–1267 [DOI] [PubMed] [Google Scholar]
- 23. Maezawa K., Shigenobu S., Taniguchi H., Kubo T., Aizawa S., Morioka M. (2006) Hundreds of flagellar basal bodies cover the cell surface of the endosymbiotic bacterium Buchnera aphidicola sp. strain APS. J. Bacteriol. 188, 6539–6543 [DOI] [PMC free article] [PubMed] [Google Scholar]
- 24. Zybailov B., Friso G., Kim J., Rudella A., Rodríguez V. R., Asakura Y., Sun Q., van Wijk K. J. (2009) Large scale comparative proteomics of a chloroplast Clp protease mutant reveals folding stress, altered protein homeostasis, and feedback regulation of metabolism. Mol. Cell Proteomics 8, 1789–1810 [DOI] [PMC free article] [PubMed] [Google Scholar]
- 25. Friso G., Majeran W., Huang M., Sun Q., van Wijk K. J. (2010) Reconstruction of metabolic pathways, protein expression, and homeostasis machineries across maize bundle sheath and mesophyll chloroplasts: large-scale quantitative proteomics using the first maize genome assembly. Plant Physiol. 152, 1219–1250 [DOI] [PMC free article] [PubMed] [Google Scholar]
- 26. Serres M. H., Riley M. (2000) MultiFun, a multifunctional classification scheme for Escherichia coli K-12 gene products. Microb. Comp. Genomics 5, 205–222 [DOI] [PubMed] [Google Scholar]
- 27. Belacel N., Wang Q., Cuperlovic-Culf M. (2006) Clustering methods for microarray gene expression data. Omics 10, 507–531 [DOI] [PubMed] [Google Scholar]
- 28. Lamb K. P., Hinde R. (1967) Structure and development of the mycetome in the cabbage aphid, Brevicoryne brassicae. J. Invert. Pathol. 9, 3–11 [Google Scholar]
- 29. Liu H., Sadygov R. G., Yates J. R., 3rd (2004) A model for random sampling and estimation of relative protein abundance in shotgun proteomics. Anal. Chem. 76, 4193–4201 [DOI] [PubMed] [Google Scholar]
- 30. Old W. M., Meyer-Arendt K., Aveline-Wolf L., Pierce K. G., Mendoza A., Sevinsky J. R., Resing K. A., Ahn N. G. (2005) Comparison of label-free methods for quantifying human proteins by shotgun proteomics. Mol. Cell Proteomics 4, 1487–1502 [DOI] [PubMed] [Google Scholar]
- 31. Scigelova M., Makarov A. (2006) Orbitrap mass analyzer - overview and applications in proteomics. Proteomics 6 Suppl 2, 16–21 [DOI] [PubMed] [Google Scholar]
- 32. Hu Q., Noll R. J., Li H., Makarov A., Hardman M., Graham Cooks R. (2005) The Orbitrap: a new mass spectrometer. J. Mass Spectrom. 40, 430–443 [DOI] [PubMed] [Google Scholar]
- 33. Olinares P. D., Ponnola L., van Wijk K. J. (2010) Megadalton complexes in the chloroplast stroma of arabidopsis thaliana characterized by size exclusion chromatography, mass spectrometry and hierarchical clustering. Mol. Cell Proteomics 9.7, 1594–1615 [DOI] [PMC free article] [PubMed] [Google Scholar]
- 34. Majeran M., Friso G., Ponnala L., Connolly B., Huang M., Reidel E., Zhang C., Asakura Y., Bhuiyan N. H., Sun Q., Turgeon R., van Wijk K. J. (2010) Structural and metabolic transitions of C4 leaf development and differentiation defined by microscopy and quantitative proteomics. The Plant Cell prepublication on-line Nov 16 [DOI] [PMC free article] [PubMed] [Google Scholar]
- 35. Sato S., Ishikawa H. (1997) Expression and control of an operon from an intracellular symbiont which is homologous to the groE operon. J. Bacteriol. 179, 2300–2304 [DOI] [PMC free article] [PubMed] [Google Scholar]
- 36. Baumann P., Baumann L., Clark M. A. (1996) Levels of Buchnera aphdiicola chaperonin GroEL during growth of the aphid Schizaphis graminum. Curr. Microbiol. 32, 279–285 [Google Scholar]
- 37. Humphreys N. J., Douglas A. E. (1997) Partitioning of symbiotic bacteria between generations of insect: a quantitative study of a Buchnera sp in the pea aphid (Acyrthosiphon pisum) reared at different temperatures. Appl. Environ. Microbiol. 63, 3294–3296 [DOI] [PMC free article] [PubMed] [Google Scholar]
- 38. Ishikawa H., Yamaji M., Hashimoto H. (1985) Symbionin, an aphid endosymbiont-specific protein. 2. Diminution of symbionin during post-embryonic development of aposymbiotic insects. Insect Biochem. 15, 165–172 [Google Scholar]
- 39. Fares M. A., Moya A., Barrio E. (2004) GroEL and the maintenance of bacterial endosymbiosis. Trends Genet. 20, 413–416 [DOI] [PubMed] [Google Scholar]
- 40. Douglas A. E. (1998) Host benefit and the evolution of specialization in symbiosis. Heredity 81, 599–603 [Google Scholar]
- 41. Tamas I., Wernegreen J. J., Nystedt B., Kauppinen S. N., Darby A. C., Gomez-Valero L., Lundin D., Poole A. M., Andersson S. G. (2008) Endosymbiont gene functions impaired and rescued by polymerase infidelity at poly(A) tracts. Proc. Natl. Acad. Sci. U.S.A. 105, 14934–14939 [DOI] [PMC free article] [PubMed] [Google Scholar]
- 42. Gerardo N. M., Altincicek B., Anselme C., Atamian H., Barribeau S. M., de Vos M., Duncan E. J., Evans J. D., Gabaldón T., Ghanim M., Heddi A., Kaloshian I., Latorre A., Moya A., Nakcbachi A., Parker B. J., Pérez-Brocal V., Pignatelli M., Rahbé Y., Ramsey J. S., Spragg C. J., Tamames J., Tamarit D., Tamborindeguy C., Vincent-Monegat C., Vilcinskas A. (2010) Immunity and other defenses in pea aphids, Acyrthosiphon pisum. Genome Biol. 11, R21 [DOI] [PMC free article] [PubMed] [Google Scholar]
- 43. Nikoh N., McCutcheon J. P., Kudo T., Miyagishima S. Y., Moran N. A., Nakabachi A. (2010) Bacterial genes in the aphid genome: absence of functional gene transfer from Buchnera to its host. PLoS Genet. 6, e1000827 [DOI] [PMC free article] [PubMed] [Google Scholar]
- 44. Thomas G. H., Zucker J., Macdonald S. J., Sorokin A., Goryanin I., Douglas A. E. (2009) A fragile metabolic network adapted for cooperation in the symbiotic bacterium Buchnera aphidicola. BMC Systems Biol. 3, 24 [DOI] [PMC free article] [PubMed] [Google Scholar]
- 45. Wilson A. C., Ashton P. D., Calevro F., Charles H., Colella S., Febvay G., Jander G., Kushlan P. F., Macdonald S. J., Schwartz J. F., Thomas G. H., Douglas A. E. (2010) Genomic insight into the amino acid relations of the pea aphid, Acyrthosiphon pisum, with its symbiotic bacterium Buchnera aphidicola. Insect Mol. Biol. 19 Suppl 2, 249–258 [DOI] [PubMed] [Google Scholar]
- 46. Wyatt G. R. (1961) The biochemistry of insect hemolymph. Ann. Rev. Entomol. 6, 75–102 [Google Scholar]
- 47. Terra W. R., de Bianch A. G., Gambarini A. G., Lara F. J. S. (1973) Haemolymph amino acids and related compounds during cocoon production by the larvae of the fly, Rhynchosciara americana. J. Insect Physiol. 19, 2097–2106 [Google Scholar]
- 48. Nakabachi A., Shigenobu S., Sakazume N., Shiraki T., Hayashizaki Y., Carninci P., Ishikawa H., Kudo T., Fukatsu T. (2005) Transcriptome analysis of the aphid bacteriocyte, the symbiotic host cell that harbors an endocellular mutualistic bacterium, Buchnera. Proc. Natl. Acad. Sci. U.S.A. 102, 5477–5482 [DOI] [PMC free article] [PubMed] [Google Scholar]
- 49. Homma K. J., Tanaka Y., Matsushita T., Yokoyama K., Matsui H., Natori S. (2001) Adenosine deaminase activity of insect-derived growth factor is essential for its growth factor activity. J. Biol. Chem. 276, 43761–43766 [DOI] [PubMed] [Google Scholar]
- 50. Price D. R., Tibbles K., Shigenobu S., Smertenko A., Russell C. W., Douglas A. E., Fitches E., Gatehouse A. M., Gatehouse J. A. (2010) Sugar transporters of the major facilitator superfamily in aphids; from gene prediction to functional characterization. Insect Mol. Biol. 19 Suppl 2, 97–112 [DOI] [PubMed] [Google Scholar]
- 51. Whitehead L. F., Douglas A. E. (1993) A metabolic study of Buchnera, the intracellular bacterial symbionts of the pea aphid Acyrthosiphon pisum. J. Gen. Microbiol. 139, 821–826 [Google Scholar]
- 52. Hueck C. J. (1998) Type III protein secretion systems in bacterial pathogens of animals and plants. Microbiol. Mol. Biol. Rev. 62, 379–433 [DOI] [PMC free article] [PubMed] [Google Scholar]
- 53. Dale C., Plague G. R., Wang B., Ochman H., Moran N. A. (2002) Type III secretion systems and the evolution of mutualistic endosymbiosis. Proc. Natl. Acad. Sci. U.S.A. 99, 12397–12402 [DOI] [PMC free article] [PubMed] [Google Scholar]
- 54. Okazaki S., Okabe S., Higashi M., Shimoda Y., Sato S., Tabata S., Hashiguchi M., Akashi R., Göttfert M., Saeki K. (2010) Identification and functional analysis of type III effector proteins in Mesorhizobium loti. Mol Plant Microbe Interact 23, 223–234 [DOI] [PubMed] [Google Scholar]
- 55. Vinuelas J., Calevro F., Remond D., Bernillon J., Rahbe Y., Febvay G., Fayard J. M., Charles H. (2007) Conservation of the links between gene transcription and chromosomal organization in the highly reduced genome of Buchnera aphidicola. BMC Genomics 8, 143 [DOI] [PMC free article] [PubMed] [Google Scholar]
- 56. McCutcheon J. P., Moran N. A. (2007) Parallel genomic evolution and metabolic interdependence in an ancient symbiosis. Proc. Natl. Acad. Sci. U.S.A. 104, 19392–19397 [DOI] [PMC free article] [PubMed] [Google Scholar]
- 57. Perez-Brocal V., Gil R., Ramos S., Lamelas A., Postigo M., Michelena J. M., Silva F. J., Moya A., Latorre A. (2006) A small microbial genome: the end of a long symbiotic relationship? Science 314, 312–313 [DOI] [PubMed] [Google Scholar]
- 58. Sabree Z. L., Kambhampati S., Moran N. A. (2009) Nitrogen recycling and nutritional provisioning by Blattabacterium, the cockroach endosymbiont. Proc. Natl. Acad. Sci. U.S.A. 106, 19521–19526 [DOI] [PMC free article] [PubMed] [Google Scholar]
- 59. Reymond N., Calevro F., Vinuelas J., Morin N., Rahbé Y., Febvay G., Laugier C., Douglas A., Fayard J. M., Charles H. (2006) Different levels of transcriptional regulation due to trophic constraints in the reduced genome of Buchnera aphidicola APS. Appl. Environ. Microbiol. 72, 7760–7766 [DOI] [PMC free article] [PubMed] [Google Scholar]
- 60. Wilson A. C., Dunbar H. E., Davis G. K., Hunter W. B., Stern D. L., Moran N. A. (2006) A dual-genome microarray for the pea aphid, Acyrthosiphon pisum, and its obligate bacterial symbiont, Buchnera aphidicola. BMC Genomics 7, 50 [DOI] [PMC free article] [PubMed] [Google Scholar]
- 61. Gunduz E. A., Douglas A. E. (2009) Symbiotic bacteria enable insect to use a nutritionally inadequate diet. Proc. Roy. Soc. B 276, 987–991 [DOI] [PMC free article] [PubMed] [Google Scholar]
- 62. Ramsey J. S., MacDonald S. J., Jander G., Nakabachi A., Thomas G. H., Douglas A. E. (2010) Genomic evidence for complementary purine metabolism in the pea aphid, Acyrthosiphon pisum, and its symbiotic bacterium Buchnera aphidicola. Insect Mol. Biol. 19 Suppl 2, 241–248 [DOI] [PubMed] [Google Scholar]
- 63. Thompson S. N. (2003) Trehalose - the insect ‘blood’ sugar. Adv. Insect Physiol. 31, 205–285 [Google Scholar]
- 64. Douglas A. E., Dixon A. F. G. (1987) The mycetocyte symbiosis of aphids - variation with age and morph in virginoparae of Megoura viciae and Acyrthosiphon pisum. J. Insect Physiol. 33, 109–113 [Google Scholar]
- 65. Whitehead L. F., Douglas A. E. (1993) Populations of symbiotic bacteria in the parthenogenetic pea aphid (Acyrthosiphon pisum) symbiosis. Proc. Roy. Soc. London B 254, 29–32 [Google Scholar]
- 66. Gophna U., Ron E. Z., Graur D. (2003) Bacterial type III secretion systems are ancient and evolved by multiple horizontal-transfer events. Gene 312, 151–163 [DOI] [PubMed] [Google Scholar]
- 67. Pallen M. J., Bailey C. M., Beatson S. A. (2006) Evolutionary links between FliH/YscL-like proteins from bacterial type III secretion systems and second-stalk components of the FoF1 and vacuolar ATPases. Protein Sci. 15, 935–941 [DOI] [PMC free article] [PubMed] [Google Scholar]
- 68. Kambara K., Ardissone S., Kobayashi H., Saad M. M., Schumpp O., Broughton W. J., Deakin W. J. (2009) Rhizobia utilize pathogen-like effector proteins during symbiosis. Mol. Microbiol. 71, 92–106 [DOI] [PubMed] [Google Scholar]
- 69. Diacovich L., Gorvel J. P. (2010) Bacterial manipulation of innate immunity to promote infection. Nat. Rev. Microbiol. 8, 117–128 [DOI] [PubMed] [Google Scholar]
- 70. Radtke A. L., O'Riordan M. X. (2006) Intracellular innate resistance to bacterial pathogens. Cell Microbiol. 8, 1720–1729 [DOI] [PubMed] [Google Scholar]
- 71. Ray K., Marteyn B., Sansonetti P. J., Tang C. M. (2009) Life on the inside: the intracellular lifestyle of cytosolic bacteria. Nat. Rev. Microbiol. 7, 333–340 [DOI] [PubMed] [Google Scholar]
- 72. Chandler S. M., Wilkinson T. L., Douglas A. E. (2008) Impact of plant nutrients on the relationship between a herbivorous insect and its symbiotic bacteria. Proc. Royal Soc. London B 275, 565–570 [DOI] [PMC free article] [PubMed] [Google Scholar]
- 73. Moran N. A., Russell J. A., Koga R., Fukatsu T. (2005) Evolutionary relationships of three new species of Enterobacteriaceae living as symbionts of aphids and other insects. Appl. Environ. Microbiol. 71, 3302–3310 [DOI] [PMC free article] [PubMed] [Google Scholar]
- 74. Oliver K. M., Degnan P. H., Burke G. R., Moran N. A. (2010) Facultative symbionts in aphids and the horizontal transfer of ecologically important traits. Annu. Rev. Entomol. 55, 247–266 [DOI] [PubMed] [Google Scholar]
- 75. Nishikori K., Morioka K., Kubo T., Morioka M. (2009) Age- and morph-dependent activation of the lysosomal system and Buchnera degradation in aphid endosymbiosis. J. Insect Physiol. 55, 351–357 [DOI] [PubMed] [Google Scholar]
- 76. Dittmer N. T., Kanost M. R. (2010) Insect multicopper oxidases: diversity, properties, and physiological roles. Insect Biochem. Mol. Biol. 40, 179–188 [DOI] [PubMed] [Google Scholar]
- 77. Bidla G., Lindgren M., Theopold U., Dushay M. S. (2005) Hemolymph coagulation and phenoloxidase in Drosophila larvae. Dev. Comp. Immunol. 29, 669–679 [DOI] [PubMed] [Google Scholar]
- 78. Nappi A. J., Carton Y., Frey F. (1991) Parasite-induced enhancement of hemolymph tyrosinase activity in a selected immune reactive strain of Drosophila melanogaster. Arch. Insect Biochem. Physiol. 18, 159–168 [DOI] [PubMed] [Google Scholar]
- 79. Seaver L. C., Imlay J. A. (2001) Alkyl hydroperoxide reductase is the primary scavenger of endogenous hydrogen peroxide in Escherichia coli. J. Bacteriol.183, 7173–7181 [DOI] [PMC free article] [PubMed] [Google Scholar]
- 80. Heddi A., Vallier A., Anselme C., Xin H., Rahbe Y., Wäckers F. (2005) Molecular and cellular profiles of insect bacteriocytes: mutualism and harm at the initial evolutionary step of symbiogenesis. Cell Microbiol. 7, 293–305 [DOI] [PubMed] [Google Scholar]
- 81. Round J. L., Mazmanian S. K. (2009) The gut microbiota shapes intestinal immune responses during health and disease. Nat. Rev. Immunol. 9, 313–323 [DOI] [PMC free article] [PubMed] [Google Scholar]
- 82. Wang J., Wu Y., Yang G., Aksoy S. (2009) Interactions between mutualist Wigglesworthia and tsetse peptidoglycan recognition protein (PGRP-LB) influence trypanosome transmission. Proc. Natl. Acad. Sci. U.S.A. 106, 12133–12138 [DOI] [PMC free article] [PubMed] [Google Scholar]