

Abstract
Nuclear Factor-κB (NF-κB) is a family of inducible transcription factors regulated by stimulus-induced protein interactions. In the cytoplasm, the NF-κB member RelA transactivator is inactivated by binding inhibitory IκBs, whereas in its activated state, the serine-phosphorylated protein binds the p300 histone acetyltransferase. Here we describe the isolation of a ssDNA aptamer (termed P028F4) that binds to the activated (IκBα-dissociated) form of RelA with a KD of 6.4 × 10⁻¹⁰, and its application in an enrichment-mass spectrometric quantification assay. ssDNA P028F4 competes with cognate duplex high affinity NF-κB binding sites for RelA binding in vitro, binds activated RelA in eukaryotic nuclei and reduces TNFα-stimulated endogenous NF-κB dependent gene expression. Incorporation of P028F4 as an affinity isolation step enriches for serine 536 phosphorylated and p300 coactivator complexed RelA, simultaneously depleting IκBα·RelA complexes. A stable isotope dilution (SID)-selected reaction monitoring (SRM)- mass spectrometry (MS) assay for RelA was developed that produced a linear response over 1,000 fold dilution range of input protein and had a 200 amol lower limit of quantification. This multiplex SID-SRM-MS RelA assay was used to quantify activated endogenous RelA in cytokine-stimulated eukaryotic cells isolated by single-step P028F4 enrichment. The aptamer-SID-SRM-MS assay quantified the fraction of activated RelA in subcellular extracts, detecting the presence of a cytoplasmic RelA reservoir unresponsive to TNFα stimulation. We conclude that aptamer-SID-SRM-MS is a versatile tool for quantification of activated NF-κB/RelA and its associated complexes in response to pathway activation.
The innate immune response is a stereotypic cellular response to alarmins, defensins, and pathogen-associated molecular patterns that initiates inflammation, secretion of antimicrobial proteins and produces adaptive immunity (1, 2). A major intracellular effector pathway of the innate immune response involves nuclear factor-κB (NF-κB)1, a ubiquitous family of highly inducible cytoplasmic transcription factors that control the expression of genetic networks that both initiate mucosal inflammation and later terminate the innate immune response (3, 4).
In unstimulated cells, the NF-κB/RelA transcriptional activator is inhibited by binding to the IκB inhibitory proteins, resulting in cytoplasmic retention and inactivation of its DNA-binding activity (5). NF-κB/RelA activation is mediated by ligand-bound cell surface cytokine or pattern recognition receptors. Here, receptor-associated adapter proteins are modified by polyubiquitination, a post-translational modification that is recognized by the ubiquitin binding domain of the I kappa B kinase (IKK) regulatory subunit (6), recruiting IKK into the submembranous complex (7, 8). This molecular interaction produces serine (Ser) phosphorylation in the IKK activation loop (9). Subsequently IKK dissociates back into the cytoplasm where it phosphorylates the IκBα NH2-terminal regulatory domain on two adjacent Ser residues (10). Phospho-IκBα is then selectively degraded within the complex (11, 12).
Liberated from its IκBα inhibitor, RelA rapidly enters the nucleus. A parallel pathway, required for NF-κB transactivation, produces RelA phosphorylation at serine residue 536 or 276 (13–16). This event is required for binding the p300 coactivator, stimulating lysine 310 acetylation (17), a post-translational switch that enhances NF-κB binding, forming a transcriptionally active enhanceosome, modifying histones of target gene promoters and inducing proteolytic clearance of promoter-bound RelA through the ubiquitin proteasome pathway (13). In this way, subcellular localization, transcriptional activity, and protein turnover of NF-κB is controlled by coupled inducible post-translational modifications that affect protein-protein interactions.
A significant technical advance in systematic discovery of protein interaction networks has been the development and refinement of the tandem affinity purification (TAP) technique (18). In this technique, an affinity epitope-tagged “bait” protein is expressed and bait-associated complexes are isolated under native conditions by sequential affinity isolation. Using TAP, the interactome of 32 major regulators of the NF-κB pathway was determined, identifying over 680 nonredundant interacting proteins, representing 171 of 241 previously reported protein interactions (19). Bioinformatics filtering to eliminate nonspecific and high abundance contaminants reduced the interacting proteins to 131 “high confidence” interactors (19). Although this work significantly increased our understanding of the NF-κB signaling pathway interactome, there were few interactions identified for nuclear coreceptors, such as p300, transcriptional elongation complexes, histone deacetylases, and protein demethylases, representing some of the major protein interactions required for the transcriptional regulatory action of NF-κB/RelA.
Methods that selectively isolate activated NF-κB/RelA complexes may increase our understanding of the biochemistry of its transcriptional activation. To this end, identification of single-strand oligonucleotides (ssDNA) termed “aptamers” that selectively bind the activated state of target proteins may have an important role in understanding the abundance and interaction network of activated complexes. Here we report an aptamer that stably binds and selectively isolates the activated state of NF-κB RelA. ssDNA aptamer P028F4 binds and associates with activated NF-κB/RelA in eukaryotic nuclei, and inhibits its association with endogenous promoters within the chromatin environment. Incorporation of aptamer P028F4 as an affinity isolation step after enrichment with FLAG binding enriches for RelA in its Ser 536 phosphorylated and p300-complexed state, while depleting inactive IκBα·RelA complexes. We demonstrate that an aptamer enrichment technique coupled to absolute protein quantification using stable isotope dilution (SID)-selected reaction monitoring (SRM)- mass spectrometry (MS) can be used to quantify the fraction of activated RelA in cytokine-stimulated eukaryotic cells. This method is a versatile tool for quantification of activated NF-κB/RelA and analysis of its associated complexes that will further extend systems approaches to understand the NF-κB interactome.
EXPERIMENTAL PROCEDURES
Materials
Sequence grade modified trypsin was purchased from Promega (Madison, WI). Anti-FLAG M2 Affinity Gel and 3X FLAG peptide were from Sigma-Aldrich (St. Louis, MO), Nanolink Streptavidin Magnetic Beads were from Solulink (San Diego, CA) and recombinant TNFα was from PeproTek (Rocky Hill, NJ). Antibodies used were: anti-RelA and anti-α-tubulin rabbit polyclonal Ab were from Santa Cruz Biotechnology (Santa Cruz, CA); anti-lamin B Ab was from Calbiochem (San Diego, CA); and anti-histone H3 was from Cell Signaling (Danvers, MA).
Recombinant Protein Expression
The cDNA encoding human RelA (aa 1–313) was PCR amplified and cloned into pGEX-KG expression plasmid to encode 67 kDa glutathione-S-transferase (GST)-RelA (1–313) fusion protein. The cDNA for full length human IκBα was amplified, cloned into pGEX-KG and transformed into Escherichia coli XL1-Blue. Protein expression was induced using 1 mm isopropyl β-d-1-thiogalactopyranoside for 4 h at 37 °C. GST-tagged proteins were purified to near homogeneity using glutathione agarose affinity chromatography and dialyzed against HBS (20 mm HEPES pH 7.4, 150 mm NaCl). Protein was stored in aliquots at −20 °C in 50% glycerol.
Aptamer Selection
DNA aptamers were selected after genetic enrichment protocols (20, 21). A DNA library consisting of a 30-base random sequence flanked by a 25-base common primer binding sites was commercially synthesized (Integrated DNA Technologies, Coralville, IA). Screening was performed by incubating GST-RelA protein with the aptamer pool in aptamer binding buffer (20 mm Tris-HCl pH 7.4, 150 mm NaCl and 1 mm MgCl2) for 30–60 min at room temperature, followed by separation of the free DNA from the bound DNA by filtering through a 25 mm diameter nitrocellulose filter (Millipore, Billerica, MA). DNA was eluted from the filter with a 72 °C incubation in elution buffer (0.25% SDS, 20 mm Tris-HCl, pH 7.5, 1 mm EDTA) for 30 min and ethanol precipitated. The eluted DNA was quantified using quantitative real-time PCR (Q-PCR). The eluted DNA was PCR amplified using a biotinylated (Bt) reverse primer and an unmodified forward primer. The amplified material was bound to Streptavidin (SA)-paramagnetic beads (Solulink, Inc) in bead binding buffer (20 mm Tris-HCl, pH 7.5, 1 mm EDTA, 200 mm NaCl and 0.01% Triton-X), and washed with binding buffer without detergent. The non-Bt single strand was eluted with 0.15N NaOH at room temperature. The DNA was ethanol precipitated, dissolved in TE and quantified using a Nanodrop 1000 instrument (Thermo Scientific, West Palm Beach, FL). At several points during the selection rounds the aptamer pool was incubated with a nitrocellulose filter to remove filter binding aptamers. Sequences of the amplifying primers were Forward, 5′-GGTAACCTTGAGTC ACGAATTCAA-3′; Reverse, 5′-CAGAAGCTGTAAG TTGGGTACCTT-3′.
Q-PCR assays and filter binding assays were used to determine when the aptamer pool was enriched with RelA binding species. The enriched pool was PCR amplified with unmodified primers and cloned with a TOPO-Blunt cloning kit (Invitrogen, Carlsbad CA). Individual clones were picked and characterized for RelA binding. Positive clones were sequenced by the UTMB Molecular Genomics core and analyzed using Sequencher software (Genecodes, Ann Arbor, MI).
Binding Studies
Nitrocellulose Filter Binding Assay
Filter binding assays were performed as described (22). Initially, 70 mer oligonucleotides were commercially synthesized (IDT) to include the proximal 20 bases of each flanking primer sequence and the 30 base variable region. DNAs were 5′ end-labeled with 32P-ATP using T4-PNK (New England Biolabs, Ipswitch, MA) and purified by glass bead binding using a MERMAID kit (MP Biomedicals, Solon, OH). Protein and labeled aptamer were incubated in aptamer binding buffer and filtered through 25 mm nitrocellulose filters. The bound material was counted in a Beckman Liquid Scintillation counter. For competition studies, binding reactions (100 μl) in aptamer binding buffer were incubated at RT for 20 min with 100-fold excess (10 picomoles) of unlabeled competitor DNAs, followed by the addition of 0.1 picomole of 32P-labeled KB55 probe. After 30 min of incubation, reactions were filtered and counted. The KB55 sequence is ATACGGGAATTCCCG and self anneals to form a duplex. Upper and lower strands of IL8KB are ACTAGGAATTTCCAGTG and CACTGGAAATTCCTAGT, respectively.
Surface Plasmon Resonance
5′-Bt aptamer was attached to a CM5-SA chip (GE Healthcare) to a level of 20–30 RUs in a Biacore T1000. Running buffer was HBS-T (20 mm HEPES ph 7.4, 150 mm NaCl, and 0.01% Triton X) with 100 μg/L sheared salmon sperm DNA. GST-RelA was dialyzed against HBS-T and injected onto the chip at the indicated concentrations. Binding kinetics were determined using the Biacore software.
Cell Culture
Human A549 pulmonary epithelial cells were grown in F12K medium as described (3, 23, 24). Full length human RelA was expressed as a FLAG-EGFP fusion protein in A549 cells using the pCX4-Pur expression vector (25).
Preparation of Cellular Extracts
Cytoplasmic (CE) and Nuclear Extracts (NE)
A549 cells were scraped and subjected to hypotonic buffer and detergent lysis (26). The supernatant CE was saved and the NE was purified by centrifugation through a sucrose cushion followed by extraction in Buffer C (50 mm HEPES, pH 7.9, 10% glycerol, 400 mm KCl, 1 mm EDTA, 1 mm EGTA, 1 mm DTT, and 0.1 mm PMSF) with protease inhibitor mixture (Sigma Aldrich) (26, 27). Protein content was estimated by Coomassie Brilliant Blue staining using bovine serum albumin as a standard (Bio-Rad, Hercules, CA).
Whole-cell Extracts (WCE)
A549 cells were washed with phosphate buffered saline and lysed with WCE buffer (10 mm Tris-HCl, pH 7.4, 100 mm NaCl, 1 mm EDTA, and 0.5% Triton X-100) supplemented with protease inhibitor mixture and phosphatase inhibitor mix (Thermo Scientific, Waltham, MA). Lysates were sonicated briefly and centrifuged at 10,000 × g for 10 min at 4 °C.
Confocal Microscopy
EGFP-A549 cells were stimulated in the absence or presence of TNFα (30 ng/ml, 1 h). The cells were then trypsinized and nuclei isolated and counted. 2 × 10⁴ nuclei were centrifuged (cytospin) into slides and fixed with 4% paraformaldehyde. After fixation, the slides were washed twice with PEM (0.1 m PIPES, pH 6.9, 1 mm EGTA, and 1 mm MgCl2) buffer (28), and stained with the indicated TEX 615 (IDT)-conjugated aptamer (5 nm) overnight at 4 °C. The following day, the nuclei were counterstained with DRAQ5 (2 mm), and washed in PEM buffer. The slides were air-dried, mounted, and images taken by LSM 510 confocal imaging system.
Western Blot
Proteins were fractionated by 10% SDS-PAGE, electro-transferred to a polyvinylidene difluoride membrane, blocked, and probed with the indicated primary Ab (13, 23, 29). Washed membranes were incubated with IRDye 700-conjugated anti-mouse Ab or IRDye 800-conjugated anti-rabbit Ab (Rockland Inc., Gilbertsville, PA) and imaged by an Odyssey infrared scanner (LiCor, Lincoln, NE) .
Electrophoretic Mobility Shift Assays (EMSAs)
NE (15 μg) were incubated with 40,000 cpm of 32P-labeled duplex Naf-1 WT probe, oligonucleotide probe, and 2 μg of poly (dA-dT) in binding buffer (8% glycerol, 100 mm NaCl, 5 mm MgCl2, 5 mm dithiothreitol, and 0.1 μg/ml phenylmethylsulfonyl fluoride) in a final volume of 20 μl, for 20 min at room temperature. The complexes were fractionated on a 6% native PAG. The duplex DNA corresponding to the NF-κB binding site in the Naf-1 gene was used as a probe (30). Competition was performed by the addition of 100-fold molar excess nonradioactive competitor.
Quantitative Reverse Transcriptase PCR (Q-RT-PCR)
One microgram of total RNA was reverse-transcribed using Super Script III in a 20 μl reaction mixture. One microliter of cDNA product was amplified in a 20 μl reaction mixture containing 10 μl of SYBR Green Supermix (Bio-Rad) and 0.4 m each of forward and reverse gene-specific primers (24, 31). The plates were denatured for 90 s at 95 °C and then subjected to 40 cycles of 15 s at 94 °C, 60 s at 60 °C, and 1 min at 72 °C in an iCycler (BioRAD). Quantification of changes in gene expression was performed using the ΔΔCt method with unstimulated cells as the calibrator (31).
Two-Step Chromatin Immunoprecipitation (ChIP) Assay
Two-step ChIP was performed in intact cells as described (32, 33). Decross-linked DNA was determined by quantitative real-time genomic PCR (Q-gPCR) using promoter-specific primers. Standard curves were generated using a dilution series of genomic DNA (from 40 ng–25 μg) for each primer pair (33). The fold change of DNA in each immunoprecipitate was determined by normalizing the absolute amount to input DNA reference and calculating the fold change relative to that amount in unstimulated cells.
Aptamer-Tandem Affinity Purification of RelA
Affinity Isolation of FLAG Tagged RelA
Indicated concentrations of WCE from FLAG-EGFP-RelA-expressing A549 cells were incubated with anti-FLAG M2 Affinity Gel 16 h at 4 °C. The beads were washed with chilled WCE buffer four times by centrifugation (5K, 2 min, 4 °C). The FLAG-EGFP-RelA was eluted by addition of 150 μg of 3× FLAG peptide (34) and incubated with mixing for 1 h at 4 °C. The mixture containing FLAG-EGFP-RelA protein complex and gel were filtered through empty spin column (BioRad) and the flow-through collected.
Affinity Isolation of Aptamer-bound RelA
Bt-Aptamer was added to final concentration of 20 nm in FLAG-EGFP-RelA for 2 h at 4 °C. During this time, a 20-μl slurry of SA-Magnetic Beads was preblocked by dilution with 300 μl WCE buffer and 200 μl acetylated casein (0.2 mg/ml) at room temperature for 2 h, followed by three washes in WCE buffer. Bt-aptamer bound FLAG-EGFP-RelA was added to the SA-Magnetic beads and incubated for 20 min at 4 °C. Bt-aptamer bound protein complex was separated from free complex on a magnetic stand and beads washed six times with WCE buffer. 50 μl SDS sample loading buffer was added to the washed beads, boiled, and protein complex was separated from SA-beads using a magnetic stand.
Selected Reaction Monitoring (SRM) Assays
Selection of High Responding Signature Peptides
Signature peptides that stoichiometrically represent the protein candidate were selected on the following criteria: uniqueness for the target protein; length of 8–25 residues; and absence of missed tryptic cleavages, chemically active amino acid residues (such as cysteine or methionine), and no basic amino acids on either cleavage site of the peptide sequence (35). Pilot liquid chromatography-tandem MS (LC-MS-MS) experiments were performed using tryptic digests of affinity-purified RelA or IκBα to identify the highest MS responding peptides for each protein. The extracted ion chromatograms based on the monoisotopic peak for all charge states and modifications detected from sequence-identified peptides were compared and the peptides with highest MS response were selected. These signature peptides are listed in Table I for each target protein.
Table I. SRM parameters of SRM assays of RelA and other proteins. Masses listed are for the natural forms of the peptides. Abbreviations: Coll., collision; Q, quadropole.
| Protein name | Gene name | UniProt accession no. | Peptide sequence | Peptide molecular mass (Da) | Q1 | Q3 | Coll. energy (V) | Fragment ion |
|---|---|---|---|---|---|---|---|---|
| Transcription factor p65 | RelA | Q04206 | TPPYADPSLQAPVR | 1510.792 | 756.396 | 867.504 | 30 | y8 |
| 756.396 | 982.531 | 24 | y9 | |||||
| 756.396 | 1053.568 | 26 | y10 | |||||
| 756.396 | 1313.684 | 26 | y12 | |||||
| NF-kappa-B inhibitor alpha | IκBα | P25963 | LEPQEVPR | 966.528 | 484.264 | 500.282 | 20 | y4 |
| 484.264 | 628.341 | 20 | y5 | |||||
| 484.264 | 725.394 | 20 | y6 | |||||
| 484.264 | 854.436 | 20 | y7 | |||||
| 484.264 | 967.520 | 20 | y8 | |||||
| Actin, cytoplasmic 1 | ACTB | P60709 | AVFPSIVGR | 944.558 | 473.279 | 531.324 | 19 | y5 |
| 473.279 | 628.377 | 19 | y6 | |||||
| 473.279 | 775.446 | 19 | y7 | |||||
| 473.279 | 874.514 | 19 | y8 |
Synthesis of Natural and Stable Isotopically Labeled Peptide Standards (SIS)
Natural tryptic peptides were synthesized using N-(9-fluorenyl) methoxycarbonyl chemistry. SIS peptides were commercially synthesized incorporating isotopically labeled [13C615N4] Arginine to a 98% isotopic enrichment (Sigma Aldrich). Both natural and SIS peptides were high performance liquid chromatography (HPLC) purified to >98% purity. The molecular weights were measured with electrospray mass spectrometry and matrix-assisted laser desorption/ionization time-of-flight mass spectrometry. The specific peptide concentration was determined by amino acid analysis. Individual SIS peptide stocks of 20 pmol/μl were made in 80% acetonitrile.
Trypsin Digestion of Subcellular Protein Extracts
Protein extracts were denatured with 8 m guanidinium HCl and a 50 μg aliquot of each sample was reduced with 10 mm dithiothreitol for 30 min at room temperature. Protein cysteinyl residues were alkylated with 30 mm of iodoacetamide for 2 h at 37 °C. The samples were diluted 10-fold with 100 mm ammonium bicarbonate, and digested with 2 μg of trypsin overnight at 37 °C. The trypsin digestion was stopped by adding 10% trifluoroacetic acid. The volume of each sample was adjusted with water to 400 μl. The tryptic digests were dried and resuspended in 5% formic acid-0.01% trifluoroacetic acid before SID-SRM-MS analysis.
SIS peptide stocks were diluted to a concentration of 10 fmol/μl with 0.01% trifluoroacetic acid. Before LC-SRM-MS analysis, 30 μl of each tryptic digest was mixed with 10 μl of each SIS peptide. These sample solutions were directly used for SID-SRM-MS analysis without further purification or fractionation.
Quantification of Activated Fraction of Endogenous RelA
Single-step Aptamer Isolation of Endogenous RelA
A549 cell extracts were prepared from control or TNFα stimulated cells (30 ng/ml, 45 min). Bt-aptamer was added to a final concentration of 20 nm, and incubated for 2 h at 4 °C. A 20 μl slurry of acetylated casein-preblocked SA-Magnetic Beads was added and binding continued at 4 °C, 20 min, followed by three washes in WCE buffer and three washes in phosphate buffered saline.
On-bead Tryptic Digestion
The beads were resuspended in 30 μl of 50 mm ammonium hydrogen carbonate (pH 7.8) and 20 μl of 0.1 μg/μl of trypsin was added. The samples were mixed and trypsinized by gentle shaking overnight at 37 °C. After digestion, the supernatant was collected. The beads were washed with 50 μl of 50% acetonitrile three times and the supernatant was pooled, and dried. The tryptic digests were then reconstituted in 30 μl of 5% formic acid-0.01% trifluoroacetic acid. An aliquot of 10 μl of diluted SIS peptides were added to each tryptic digest. The final concentration of each SIS peptide was 2.5 fmol/μl. These sample solutions were directly used for LC-SRM-MS analysis without further purification or fractionation.
LC-SRM-MS Analysis
LC-SRM-MS analysis was performed with a TSQ Vantage triple quadrupole mass spectrometer equipped with nanospray source (Thermo Scientific, San Jose, CA). The online desalting and chromatography were performed using an Eksigent NanoLC-2D HPLC system (AB SCIEX, Dublin, CA). Aliquots of 10 μl of each tryptic digest were injected on a C18 peptide trap (Agilent, Santa Clara, CA), desalted with 0.1% formic acid at a flow rate of 2 μl/min for 45 min. Peptides were eluted from the trap and separated on a reverse-phase nano-HPLC column (PicoFrit™, 75 μm × 10 cm; tip ID 15 μm) packed in house using Zorbax SB-C18 (5-μm diameter particles, Agilent, Santa Clara, CA). Separations were performed using a flow rate of 500 nL/min with a 20-min linear gradient from 2–40% mobile phase B (0.1% formic acid, 90% acetonitrile) in mobile phase A (0.1% formic acid), followed by 0.1-min gradient from 40–90% mobile phase B and 5-min 90% mobile phase B. The TSQ Vantage was operated in high-resolution SRM mode with Q1 and Q3 set to 0.2 and 0.7-Da Full Width Half Maximum. All acquisition methods used the following parameters: 1800 V ion spray voltage, a 275 °C ion transferring tube temperature, a collision-activated dissociation pressure at 1.5 mTorr, and the S-lens voltage used the values in S-lens table generated during MS calibration. Each sample was analyzed by LC-SRM-MS twice. The MS raw files are accessible at https://bioinfo.utmb.edu/CPC/Publications/default.jsp.
SRM Data Analysis
All SRM data were processed using Xcalibur® 2.1. The default values for noise percentage and base-line subtraction window were used. All data were manually inspected to ensure peak detection and accurate integration. The chromatographic retention time and the relative product ion intensities of the analyte peptides were compared with those of the SIS peptides. The variation of the retention time between the analyte peptides and their SIS counterparts were within 0.05 min, and no significant differences in the relative product ion intensities of the analyte peptides and SIS peptides were observed. For the SRM-MS analysis of crude protein extracts, β-actin was used as loading control. All of the measured natural verse SIS standard peptide ratios were normalized against β-actin.
RESULTS
Isolation of RelA(1–313) Binding Single-stranded Aptamer
Purified recombinant GST fusion protein-RelA(1–313), encoding the DNA binding and IκBα interactive domain, was used to screen for high affinity ssDNA aptamers by repeated rounds of in vitro binding and enrichment. After 12 rounds of selection, we found that greater than 50% of the aptamer pool bound to the target RelA protein. Individual clones were obtained, the inserts were amplified by PCR, separated into single-strands, and tested for RelA binding. We sequenced 9 clones that exhibited binding, and synthesized 70-mer oligonucleotides for each. Competition experiments showed that five of the aptamers fall into the same group, competing with each other for binding; from this group, we selected clone P028F4 for further investigation. Fig. 1A shows the sequence of P028F4 including the primer flanking sequences. The variable region contains the sequence GGGAC, matching half of the double-strand NF-κB natural binding site GGGACTTTCC. The four other aptamers in this group also contained this sequence or the similar GGGCC. Competition and direct binding studies showed that the 30-base variable region by itself was sufficient for binding (data not shown). Secondary structure analysis using the UNAFold program (36) did not predict significant secondary structure, and there is no complement to the GGGAC sequence in the aptamer to allow it to form double-strand DNA. We performed competition experiments in nitrocellulose binding assays with natural double-strand binding sites (Table II). Aptamer P028F4 was able to compete effectively for binding to the KB55 NF-κB binding site. A nonspecific control aptamer P028A1 did not compete as well for binding.
Fig. 1.

Isolation of ssDNA aptamer binding to RelA (1–313). A, Sequences of P028F4 and nonspecific P028A1. Small case, flanking sequences. B, Sensorgram tracings for GST-RelA binding to P028F4. Increasing concentrations of GST-RelA (indicated in the inset) were used to bind to P028F4-coupled chip. Association and dissociation rates were measured for 8 and 5 min, respectively.
Table II. P028F4 competes with dsNF-κB for RelA (1–313) binding. Shown is percent KB55 binding after competition with indicated unlabeled competitor.
| Competitor | Percent binding |
|---|---|
| None | 100% |
| P028A1 | 77% |
| P028F4 | 0% |
| IL-8 | 32% |
| KB55 | 8% |
P028F4 binding affinity was determined by surface Plasmon resonance measurement (Fig. 1B). The binding activity fit well to a 1:1 binding model with a KD of 6.4 × 10⁻¹⁰, calculated from a ka of 1.8 × 10⁶ 1/Ms and kd of 0.0018 1/s. These estimates are similar to those obtained from nitrocellulose filter binding experiments (not shown).
Aptamer P028F4 Binds RelA and Competes With Duplex dsNF-κB Sequences for RelA Binding
To confirm if aptamer P028F4 competes with duplex (ds) NF-κB binding sites, a competition-EMSA experiment was performed. Nuclear extract (NE) prepared from control or TNFα -stimulated A549 cells was incubated with a radiolabeled dsNF-κB DNA binding site in the presence of increasing concentration of unlabeled P028A1 or P028F4 and bound complexes fractionated by native gel electrophoresis. Analysis of the DNA-protein complexes showed a migration pattern characteristic of the NF-κB complex (3, 37). These complexes bound with NF-κB binding specificity, being competed with 100-fold molar excess of unlabeled dsNF-κB duplex, but not the corresponding site mutation (Fig. 2A). Although aptamer P028A1 did not disrupt the NF-κB complex, aptamer P028F4 competed effectively for dsNF-κB binding.
Fig. 2.

P028F4 binds activated RelA. A, EMSA using NE prepared from TNF stimulated A549 cells were incubated with 0.25 pmol of radiolabeled double-stranded (ds) NF-κB. Unlabeled ssDNA aptamers (P028A1 or P028F4) were incubated with NE in increasing concentrations prior to fractionation at 6.25, 12.5, and 25 pmol, representing 25-, 50-, and 100-fold molar excess of probe as indicated. Shown is an autoradiogram of bound and free complexes. A1, P028A1; Comp, competitor; F4, P028F4; WT, wild-type NF-κB duplex; Mut, mutant NF-κB duplex; n.s., nonspecific; pm, pmol. B, EMSA using NE prepared from unstimulated (Con) or TNF-stimulated A549 cells using radiolabeled P028F4 as a probe. NE were incubated in the presence of 100-fold excess duplex wild-type NF-κB (WT) or duplex mutant NF-κB (Mut) competitors (Comp) before fractionation. Shown is an autoradiogram of the complexes.
In a converse experiment, NE prepared from unstimulated or TNFα-stimulated A549 cells was directly bound to radiolabeled P028F4 as a probe in the presence of unlabeled specific or nonspecific dsDNA competitor. In control NE, a complex of nonspecific proteins was detected on P028F4. Upon TNFα stimulation, two new nucleoprotein complexes were detected that represent specific NFkB complexes because they competed specifically with a 100-fold excess of unlabeled dsNF-κB wild type (WT), but not mutant (Mut) DNA sequences (Fig. 2B). Together, these data indicated that aptamer P028F4 competes for dsNF-κB binding to NF-κB/RelA.
Aptamer P028F4 Colocalizes with Activated Nuclear RelA
Other studies have shown that aptamers are bound nonspecifically to high abundance ssRNA binding proteins in cells (28); we also found that transfection of intact cells with chemically synthesized fluorescent TEX 615-conjugated P028A1 and P028F4 showed a high amount of nonspecific cytoplasmic staining, despite methods to reduce nonspecific interactions such as zwitterionic detergents [not shown, ref (28)]. To circumvent this problem, we imaged intact nuclei from A549 cells expressing an enhanced Green Fluorescent Protein (EGFP)-RelA fusion protein. The EGFP-tagged RelA allows the cellular localization of RelA by confocal microscopy. Nuclei from control or TNFα stimulated EGFP-RelA were stained with TEX 615-conjugated P028A1 or P028F4 and imaged by confocal microscopy. In the absence of TNFα stimulation, little EGFP-RelA staining was detected (Fig. 3A). By contrast, upon TNFα stimulation, the nuclei were strongly stained with translocated EGFP-RelA. Nuclei treated with P028A1 were TEX 615-negative in the absence or presence of TNFα stimulation (Fig. 3A). By contrast, TNFα stimulated nuclei treated with P028F4 strongly stained TEX 615-positive, whereas control nuclei were negative (Fig. 3B). The intense yellow staining of the merged images indicated colocalization of the aptamer and EGFP-RelA (Fig. 3B). Together these data indicate that P028F4 colocalizes with activated EGFP-RelA in eukaryotic nuclei.
Fig. 3.

P028F4 colocalizes with activated nuclear RelA. A, Intact nuclei from control or TNF stimulated EGFP-RelA expressing A549 cells were stained with TEX 615 (Texas-Red)-conjugated P028A1 (5 nm). Nuclei were counterstained with DRAQ5 to define nuclear boundaries. Shown is a confocal microscopy image of the nuclei. B, TEX 615-conjugated P028F4 binding. Note the presence of nuclear EGFP-RelA in the presence of TNF, and strong TEX 615 staining in P028F4 stained nuclei. Merge, EGFP- TEX 615 merged image.
Aptamer P028F4 Inhibits TNFα-Induced Endogenous NF-κB Dependent Gene Expression
Earlier studies selectively inhibiting NF-κB/RelA translocation identified Groβ and TNFAIP3/A20 as part of a TNFα inducible gene network downstream of NF-κB (3, 4, 38). To determine whether P028F4 interfered with TNFα-induced NF-κB dependent gene expression, A549 cells were transfected with nothing, P028A1, or P028F4 (4 μm respectively) and the cells were TNFα stimulated. Relative changes in Groβ and TNFAIP3/A20 transcripts were determined by Q-RT-PCR. In the absence of aptamer transfection, Groβ mRNA was induced fivefold in response to TNFα (Fig. 4A, top). In cells transfected with P028A1, we observed an inconsistent effect on unstimulated Groβ expression, but did not significantly reduce the Groβ expression induced by TNFα. By contrast, in P028F4-transfected cells, basal and TNFα-induced Groβ expression were significantly reduced to less than twofold induction. Similar qualitative results were observed for the expression of TNFAIP3/A20, where the nearly sevenfold induction observed in control transfected cells was reduced to less than twofold in P028F4-transfected cells (Fig. 4A, bottom). Importantly, each RNA sample was measured for expression of GAPDH as an internal control, where aptamer transfection had no effect on GAPDH mRNA levels. These observations indicated that transfected P028F4 had a consistent inhibitory effect on NF-κB dependent gene expression in vivo.
Fig. 4.

P028F4 inhibits TNF-induced endogenous NF-κB dependent gene expression. A, Q-RT-PCR. A549 cells transfected with nothing (–), 4 μm P028A1, or P028F4 aptamers were stimulated in the absence (Con) or presence of TNFα (1h, 30 ng/ml). Total RNA was extracted and subjected to Q-RT-PCR for Gro-β (top panel) and TNFAIP3/A20 (bottom panel). Data are normalized to GAPDH and expressed as fold change relative to uninfected control. Each bar is mean ±S.D. of triplicate determination. * p < 0.05. B, ChIP assay. A549 cells transfected with nothing (–), P028A1 (4 μm), or P028F4 (4 μm) were stimulated in the absence (Con) or presence of TNF (1 h, 30 ng/ml). Two-step ChIP was preformed using pre-immune IgG (IgG), or anti-RelA as the primary Abs. Immunoprecipitated DNA was subjected to quantitative PCR using primers for TNFAIP3/A20 promoters (top) or Groβ (bottom) as indicated. Data are shown as fold increase in signal relative to unstimulated A549 cells (X, ± S.D. of technical replicates). Shown are the results for two separate experiments (Expt).
Aptamer P028F4 Blocks RelA Association with Endogenous NF-κB Dependent Gene Promoters In Vivo
Previous studies using dynamic live-cell imaging have shown that RelA association with endogenous chromatin is hyperdynamic (39), in contrast to its stable association with DNA targets in vitro. This observation makes the ability of P028F4 to compete for RelA binding seen earlier in EMSA (Fig. 2) of uncertain relevance to the interaction of RelA with endogenous chromatin. To address this issue, aptamer-transfected A549 cells stimulated in the absence or presence of TNFα were subjected to two-step ChIP assay for TNFAIP3/A20 (38). Here, specific RelA binding was observed in unstimulated cells (compare RelA immunoprecipitate to IgG control), and relative RelA binding to Gro-β increased to 3.5-fold in response to TNFα. A weak nonspecific reduction of TNFα-induced RelA was observed in response to P028A1, whereas a greater, significant inhibitory effect of P028F4 was observed in response to TNFα (Fig. 4B, top). Similar results were observed for the Groβ promoter, where the 3.5-fold increase in RelA binding was reduced to less than twofold (Fig. 4B, bottom). Together these data indicated to us that P028F4 competes for RelA binding to its endogenous chromatin binding sites, explaining its inhibitory activity.
Aptamer P028F4 Binds Free- but Not IκBα-associated RelA
IκBα binding to the NH2 terminus of RelA locks it into a closed conformation for DNA binding and masks its nuclear localization sequence. To determine if P028F4 recognizes free RelA or that complexed to IκBα, purified recombinant GST-RelA (1–313) was pre-incubated in the absence or presence of increasing amounts of recombinant full length GST-IκBα. Complex formation was determined by nondenaturing coimmunoprecipitation assay using anti-RelA Ab. In this experiment, RelA was immunoprecipitated under native conditions, and associated IκBα detected by Western immunoblot (Fig. 5A). IκBα staining in the immunoprecipitated material indicated RelA association with IκBα. The same free RelA and RelA·IκBα complex mixtures were then separately mixed with radiolabeled P028F4 for binding assay in EMSA. Although P028F4 bound to free RelA, no binding was observed for the RelA·IκBα complexes (Fig. 5B). Together, these data indicated P028F4 recognized RelA only in its activated (non IκBα-complexed) form.
Fig. 5.
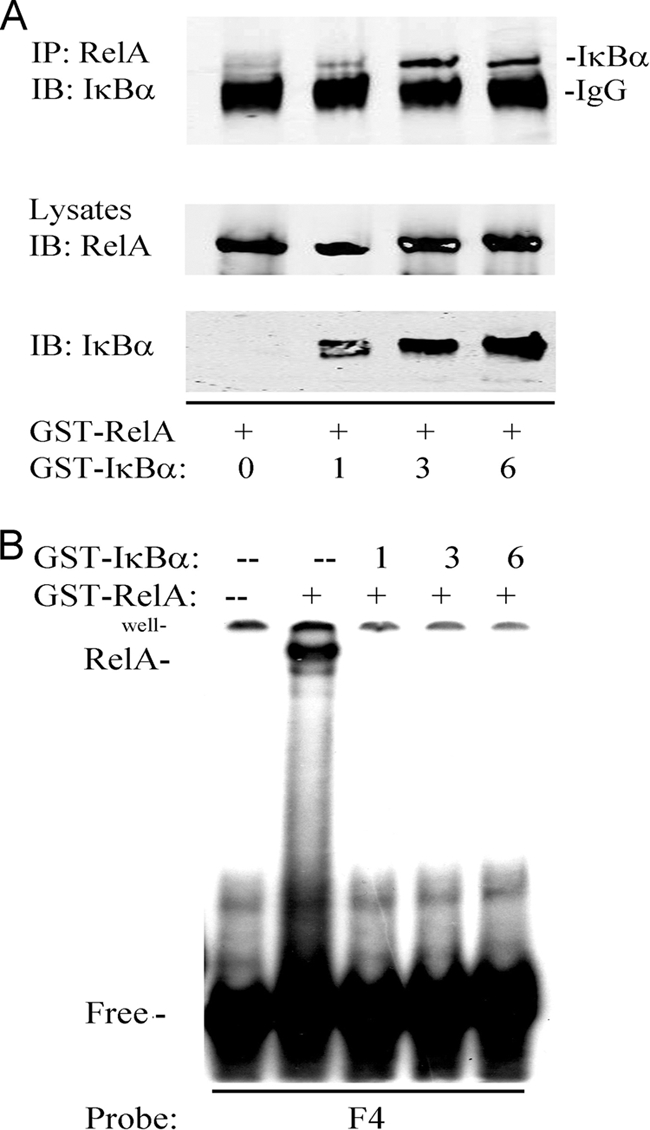
P028F4 binds free- but not IκBα-associated RelA. A, Formation of RelA· IκBα complex. Purified recombinant GST-RelA (1–313) was incubated in the absence or presence of increasing amounts of recombinant full length GST- IκBα. Complex formation was determined by nondenaturing coimmunoprecipitation using anti-RelA Ab. Top panel, immune complexes were SDS-PAGE fractionated and immunoblotted (IB) with anti- IκBα. Specific IκBα band is indicated. Bottom panels are input proteins detected with anti-RelA or - IκBα Abs. B, EMSA of aptamer P028F4 binding to RelA and RelA· IκBα complexes. RelA· IκBα complexes were formed as described in A. Subsequently, radiolabeled P028F4 was added and EMSA performed. Shown is an autoradiogram of the bound and free complexes. Note the presence of P028F4·GST-RelA complex is formed only in the absence of IκBα.
Aptamer Tandem Affinity Purification (ATAP) Enriches for IκBα-free RelA Complexes
The ability of P028F4 to recognize non-IκBα-associated RelA indicated that it could be used in affinity binding experiment to selectively enrich for activated RelA complexes. For this purpose, CE or NE from control- or TNFα-stimulated A549 cells were bound to Bt-P028A1 or Bt-P028F4. After capture on SA-magnetic beads and washing, the presence of RelA was measured by Western immunoblot. In CE, we observed that P028F4 only captured RelA prepared from TNFα-stimulated cells, whereas P028A1 did not (Fig. 6A). Although P028A1 captured nuclear RelA in TNFα stimulated cells, Bt-P028F4 captured significantly more activated RelA. In both CE and NE, aberrantly migrating forms of RelA were also captured by P028F4, suggesting that the P028F4 enriches for post-translationally modified RelA isoforms (indicated by *; Fig. 6A). These complexes are highly suggestive of inducible RelA-ubiquitin polymers shown previously to migrate at ∼150 kDa (40).
Fig. 6.
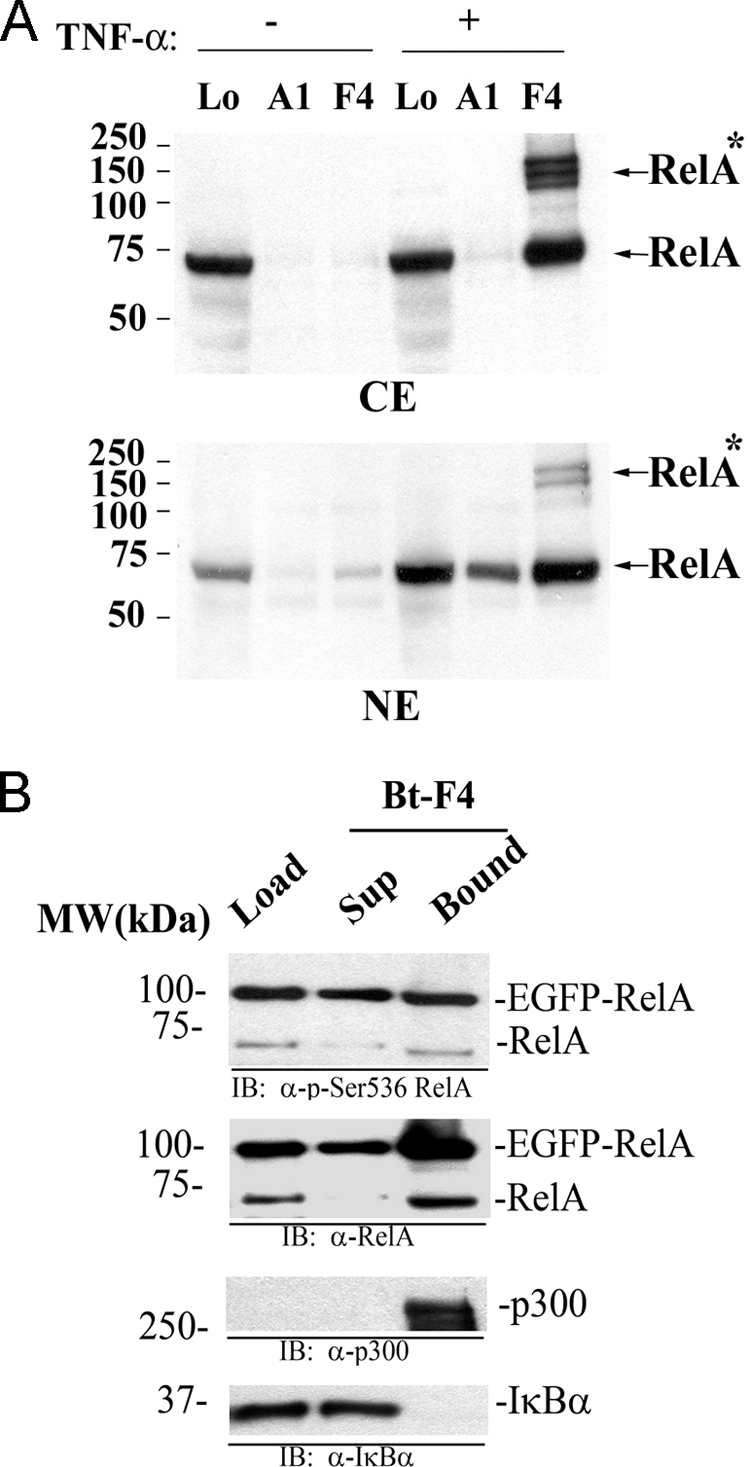
P028F4 in tandem affinity isolation of activated RelA complexes. A, A549 cells were treated without TNFα (–) or with TNFα (+) for 30 min and equal amount of cytoplasmic (CE) or nuclear (NE) extracts were incubated with Bt-P028A1 or Bt-P028F4 (20 nm). Proteins bound to aptamers were captured with SA-magnetic beads and analyzed on 10% PAGE. Upper, membrane containing CE and lower, containing NE were probed with anti-RelA antibody. Arrowhead on the right indicates RelA. RelA*, post-translationally modified RelA; Lo, Sample input. Molecular weight (kDa) is indicated on the left. Experiment was repeated three times. B, aptamer-TAP with biotinylated (Bt)-P028F4 purification was performed on EGFP-RelA WCE. Shown are fractions from the 3× peptide elution (Load), the column flow-through (Sup) and the bound fraction. Top panel, staining with anti-phospho-Ser 536 RelA Ab. The 96 kDa EGFP-RelA and endogenous 65 kDa RelA bands are indicated. Second from top, staining with anti-RelA Ab. Third from top, staining with anti- p300 coactivator Ab. Bottom panel, staining with anti-IκBα Ab. Bt, biotinylated; Lo, loaded input; IB, immunoblot; Sup, supernatant. Note that the Bound fraction is enriched in p300 and negatively selects for IκBα.
We next specifically assayed whether P028F4-captured RelA was in an activated state by measurement of activating Ser 536 phosphorylation and p300 complex formation. For this purpose, a two-step affinity isolation was performed, initially purifying EGFP-RelA using FLAG-M2 affinity beads, followed by Bt-P028F4 enrichment on SA-Magnetic Beads. Western immunoblot staining with anti-phospho-Ser 536 RelA Ab shows the presence of Ser 536-phosphorylated EGFP-RelA and endogenous phospho-Ser 536 RelA in the P028F4 eluates (Fig. 6B). The abundance of p300 was below the limit of detection in the FLAG eluates, but was strongly detected in the P028F4 eluate (Fig. 6B). Finally, we also monitored for IκBα association. Although IκBα was present in the starting material, IκBα was found only in the flow-through fraction (Fig. 6B, bottom panel). These data indicate that the ATAP technique enriches for a subset of RelA complexes containing activating RelA Ser phosphorylation, and p300 complexes but not those containing inactive RelA· IκBα complexes.
We next sought to develop quantitative measurements for the P028F4-enriched RelA and its complexes using selected reaction monitoring mass spectrometry (SRM-MS). First, the SRM-MS assays were optimized by selecting high responding quadropole Q1/Q3 transitions, and assay specificity established.
Selection and Optimization of SRM Q1/Q3 Transitions
Because the intensities of individual fragments derived from one precursor ion differ substantially, selection of the most intense fragments for each signature peptide is essential for developing a high-sensitivity SRM assay. In this study, four or five y-ions of the highest intensity observed in previous LC-MS-MS and SRM-triggered MS-MS experiments, and whose mass to charge ratio (m/z) values exceed precursor ion m/z were selected for each peptide. The sensitivity of the SRM assays for each target peptide was further increased by optimizing the collision energy voltage. As shown in Fig. 7, the SIS RelA peptide, TPPYADPSLQAPVR was infused into the TSQ mass spectrometer, and the optimal collision energy for each transition obtained by performing a breakdown curve. Compared with predicted collision energy voltage (given by 0.034 × (precursor ion m/z) + 3.314), the experimentally optimized collision energy voltage yielded slightly better results. We further empirically optimized the S-lens voltage for each signature peptide. The difference between the values in S-lens table generated during MS calibration and empirically derived S-lens value was found to be an average gain of less than 5% of total peak area. Therefore, in this study, we used the values in S-lens table generated during MS calibration for all the experiments. The selected Q1/Q3 transitions and their collision energy voltages are tabulated in Table I.
Fig. 7.

Optimization of collision energy of precursor-product ion transitions of RelA signature peptide. A solution of SIS peptide of RelA, TPPYADPSLQAPVR, was nanoinfused onto a TSQ mass spectrometer, and the optimal collision energy for each transition were obtained by performing a breakdown curve. The vertical dashed lines represent the calculated collision energy voltage using a generic formula (= 0.034 × (precursor ion m/z) + 3.314). Note that the experimentally derived collision energies give increased sensitivity over those determined by the generic formula.
Specificity of SRM Quantification
Shared precursor-product ion transitions with those from other analytes can lead to false positives in the subsequent peak assignment and quantification inaccuracy. With the use of SIS peptides as internal standards, we used four analyte-specific criteria for identifying chromatographic peaks that correspond to the authentic analyte peptide  precursor ion m/z, product ion m/z, chromatographic retention time, and the relative product ion intensities. Analyte peptides and their SIS analogs have identical chromatographic retention time because of their physiochemical similarities. Under the same collision energy and collision-activated dissociation pressure, the analyte and the SIS peptide dissociate to generate the same pattern of product ions, which differ only by the mass difference produced by the incorporation of the stable isotope-labeled amino acids and the difference in their absolute intensity. Importantly, the relative intensities of the complement of product ions formed by each analyte peptide and its SIS analog are nearly identical. These features were used for evaluating the selectivity of SRM assays and the certainty of peak assignment. For this purpose, we chose four to five SRM pairs for each peptide, and manually examined the MS raw data to ensure that the analyte peptides and their SIS analogs had same chromatographic retention time (variance below 0.05 min) and relative product ion intensities (±20% variance in the relative ratios for each fragment). This inspection ensured that selected SRM ion pairs of both analyte peptides and SIS peptides were free of matrix interference from co-eluting ions. As shown in Fig. 8, RelA natural peptides had nearly identical chromatographic retention time and relative product ion intensities as their SIS analogs, indicating that the SRM assays had high specificity. We believe that the high specificity of the assay was achieved, in part, because the aptamer enrichment significantly reduces the sample complexity and our application of high resolution-SRM mode for data acquisition. Therefore, for quantification of each peptide, we used the sum of the signals from all monitored transitions instead of selecting a single representative SRM ion pair for each peptide.
Fig. 8.

RelA transitions. Extracted ion chromatograms (A, B) and SRM spectra (C, D) of RelA transitions monitored by SID-SRM-MS for the indicated RelA and RelA SIS peptides. Note the SIS peptide has identical retention times (A, B), and SRM spectra (C, D) as that of the analyte.
Linear Response and Limit of SRM Quantification of RelA
The assay dynamic range represents the concentration range where protein abundance is measurable with acceptable levels of accuracy and precision. The assay dynamic range was assessed by the method of standard addition (41–43). In this method, serial dilutions of target proteins with a fixed amount of SIS peptide are spiked into the similar cellular protein matrix, and a calibration curve is generated for target peptide. However, because a blank cellular protein matrix devoid of activated endogenous RelA was not available, we alternatively used a [12C]-analyte peptide of RelA with its native flanking sequences (VFR-TPPYADPSLQAPVR-VSM), to characterize the assay dynamic range. The [12C]-analyte peptide was digested with trypsin in the same matrix as used for the “on-beads” digestion of aptamer-enriched RelA. We diluted the tryptic digest to generate a range of analyte concentrations spanning a 10,000-fold concentration range (from 200 amol to 20 pmol on the column). These analyte concentrations were then combined with a constant amount of [13C]-analyte peptide internal standard. Two replicate LC-SRM-MS analyses of each sample dilution were performed in the order from the most dilute to the most concentrated. Linear regression analysis was performed on the observed peak area ratios (natural:heavy) versus concentration ratios to generate calibration curves (Fig. 9). The SRM assay yields linear responses over a >1000-fold concentration range (r > 0.9971). When the amount of RelA peptide loaded on the column was higher than 10 pmol or lower than 500 amol, the response became nonlinear (Fig. 9). The nonlinearity on the high concentration end of the dilution curve is due to the saturation of both the MS detector and the nano HPLC column, whereas the nonlinearity on the low concentration end is mainly because of matrix interference and the trace amount of [12C]-analyte peptide of RelA contaminating the [13C]-analyte peptide internal standard.
Fig. 9.

Calibration curve for RelA SID-SRM assay. The linear regression analysis (1/× weighted) for RelA illustrates the linear dynamic range of the assay when analyte concentrations that respond nonlinearly are excluded (○). The error bars indicate S.D. of the measurements.
The lower limit of quantification of the SRM assay is defined as the lowest analyte concentration that can be measured with <20% coefficient of variation (44, 45). In our study, the lowest natural RelA peptide that can be quantified is 200 amol (signal-to-noise ratio (S/N) 85, 10.2% coefficient of variation), a value representing the lower limit of quantification of this RelA SRM assay.
Aptamer Enrichment Increases Signal-to-Noise (S/N) Ratio for RelA Quantification
Using RelA-specific P028F4 to affinity enrich RelA before SRM-MS analysis dramatically reduces the sample complexity. To determine the effect of pre-enrichment on the S/N ratio, we measured the S/N ratio for endogenous RelA in crude versus P028F4-enriched samples. We found that the S/N ratio of endogenous RelA is only 12 when analyzed directly from crude CE (Fig. 10), whereas P028F4 enrichment resulted in a 36-fold increase in S/N ratio (from 12 to 429, Fig. 10).
Fig. 10.

Comparison between SRM assays of endogenous RelA in crude or aptamer-enriched fractions. RelA was measured in crude cellular fractions prepared from TNFα-stimulated A549 cells (A,B) or cellular fractions subjected to aptamer-enrichment (C,D). A, extracted ion chromatogram of natural RelA peptide; B, extracted ion chromatogram of RelA SIS peptide. C, extracted ion chromatogram of RelA natural peptide. D, extracted ion chromatogram of RelA SIS peptide. Note the 36-fold increase in the S/N ratio after aptamer enrichment.
Multiplexed LC-SRM-MS Analysis of Single-step Aptamer-enriched RelA
We next combined single-step aptamer-enrichment of RelA in eukaryotic cells with the multiplex SRM assay (schematically shown in Fig. 11). Control or TNFα-stimulated A549 cells subcellular fractions were separately incubated with Bt-P028F4 or P028A1 aptamers, and captured on SA-magnetic beads. To first determine whether the aptamer capture on SA-magnetic beads was nonsaturating, RelA from increasing numbers of control- or TNFα-stimulated A549 cells were subjected to single-step aptamer enrichment, and detected by Western immunoblot. As seen in Fig. 12, increasing amounts of RelA were seen over the input range of 3–12 × 106 cells only in the TNFα-stimulated extracts.
Fig. 11.

Schematic diagram of the SRM assay of aptamer-enriched RelA and its associated proteins. First, biotin-conjugated RelA specific aptamer was incubated with crude cell extract. Second, the Bt-aptamer RelA was captured by SA-coated magnetic beads. The beads were washed six times to remove nonspecifically bound proteins. The washing improved the purity of isolated RelA and reduced the complexity of the sample. Third, the beads were resuspended in trypsin proteolysis buffer and the proteins bound on the beads were digested with trypsin. Fourth, the tryptic peptides were eluted from the beads and the SIS standard peptides were spiked before SID-SRM-MS analysis. Finally, RelA was quantified with SID-SRM-MS.
Fig. 12.

Single step isolation of endogenous RelA. A, RelA binding with P028F4 with increasing amounts of nuclear extracts from A549 cells. Left, nuclear extracts from indicated cell number without TNFα (–) and right, with TNFα (+) were captured with P028F4 and bound complexes quantified by Western immunoblot. Arrowhead indicated RelA detected by Western blot with anti-RelA antibody. B, Quantitation of bound RelA to Bt-P028F4 by Odyssey infrared scanning.
To quantify the amount of RelA in cells, CE and NE from 6 × 10⁶ cells were prepared and assayed for cytoplasmic and nuclear markers. As seen in Fig. 13A, CE was highly enriched in β-tubulin, whereas β-tubulin was undetectable in NE. Similarly, histone H3 was undetectable in CE and highly enriched in NE. The active RelA in CE and NE was then captured by Bt-aptamer-SA magnetic beads. The proteins were trypsinized on-beads, and RelA and IκBα were quantified with SID-SRM-MS. To determine the fraction of activated RelA complex, total RelA in each subcellular extract was also quantified with SID-SRM-MS. As shown in Fig. 13B, P028F4 demonstrated high specificity toward activated RelA in comparison to P028A1, resulting in 14–30-fold enrichment of activated RelA in CE and NE. With the quantification of SID-SRM-MS, we found that, in unstimulated cells, about 5% of total RelA proteins in the cytoplasm were activated, and only a small amount of activated (and total) RelA was in the nucleus. By contrast, after TNFα stimulation, the amount of activated RelA in CE increased about sixfold. We also observed a significant amount of activated RelA translocated into the nucleus, where the amount of activated RelA was the same as the total amount of nuclear RelA. Although it was measured, IκBα was not observed in any of the aptamer-enriched samples, a finding that is consistent with the lack of RelA-IκBα complex binding seen in Western blot analysis (Fig. 6B), and in EMSA (Fig. 5).
Fig. 13.

SID-SRM-MS quantification of total and activated RelA in A549 cells. A, Assessment of cytoplasmic and nuclear fractionation. Western immunoblot for β-tubulin and histone H3. B, cytoplasmic fraction without TNFα stimulation; (B), RelA quantification after single step aptamer enrichment for control or TNFα stimulated CE (top) or NE (bottom). The error bars indicate S.D. of the measurements.
DISCUSSION
Mucosal inflammation produced by the innate immune response is dependent on the NF-κB pathway, an intracellular signaling network whose activity is regulated by the formation of dynamic protein interactions. Activated pattern recognition- or cytokine receptors binding to their cognate ligands induce Lys 63 linked polyubiquitination of the (receptor-interacting serine/threonine-protein kinase) and (TNF-receptor associated factor) adapter molecules (6). These polyubiquitin-modified adapters recruit IKK to the submembranous receptor complex, producing serine phosphorylation and activation of IKK, an event that controls protein stability of IκBα and nuclear translocation of activated RelA. In the nucleus, RelA associates with the p300 histone acetyltransferase, whose promoter recruitment activates expression of downstream inflammatory genetic networks. As a result of direct activation of negative feedback networks including IκBα synthesis, RelA undergoes nuclear-cytoplasmic oscillation in response to activation (46). In this study, we describe the selection and characterization of a RelA-directed ssDNA oligonucleotide, P028F4, a ligand that directly binds recombinant RelA in vitro, and binds inducible RelA in isolated NEs. P028F4 enriches for serine phosphorylated and p300-complexed RelA. We provide evidence that P028F4 has utility as a method for single step enrichment and quantification of activated RelA complexes using quantitative SID-SRM-MS assays. This method has, for the first time, allowed the determination of the fraction of activated RelA in unstimulated cells and the estimation of activated RelA molecules.
Genetic selection of protein-binding aptamers is a widely exploited method for probing protein function and structure (20, 21). Previous efforts isolating RelA ligands have resulted in isolation of ssRNA aptamers and ds- thioate- and dithioate modified ligands that bind NF-κB/RelA (47, 48). To our knowledge, this work represents the first report of isolation of a ssDNA aptamer that specifically recognizes NF-κB/RelA. Our data show that P028F4 binds with a KD of 6.4 × 10⁻¹⁰, representing about 10-fold higher affinity than that of the reported ssRNA aptamers (47). Moreover, this binding is more stable than that described for duplex DNA binding to RelA. Although previous work showing that thioate modified duplex aptamers can recognize specific NF-κB isoforms, their on and off-rates have not been reported (48). One property of P028F4 is that this ligand binds with a long off-rate, measured by surface plasmon resonance with a kd of 0.0018 1/s. This characteristic lends itself well to its application for affinity isolations of the target protein and its complexes.
The crystallographic structure of RelA complexed to its duplex binding sites shows that RelA binds as a dimer, assuming an immunoglobulin fold structure with β-stranded loops making extensive contract with both DNA base pairs and the sugar-phosphate backbone (49). Our binding characterization shows that ssDNA P028F4 competes with RelA for its cognate dsDNA regulatory sequences. These data may suggest that P028F4 binds RelA on a β-stranded loop that is essential for stable DNA binding, or alternatively, P028F4 may induce RelA to assume a conformational change nonpermissive for DNA interaction. In this regard, we note that a high affinity ssRNA aptamer that selectively binds NF-κB p50 isoform also competes with duplex DNA binding by inducing an alternative molecular conformation of the protein (50).
Because P028F4 is a competitive antagonist of activated RelA DNA binding activity, we explored its properties as an antagonist of RelA transcriptional activity in intact cells. Although we observed that cellular transfection of P028F4 produced additional inhibition of expression of NF-κB dependent target genes over that of the control P028A1 aptamer, our experiments also indicate that at the concentrations needed to overcome nonspecific cellular binding (28), there is a nonspecific aptamer effect on TNFα- inducible transcription (Fig. 4A). In the ChIP experiments, an even stronger nonspecific aptamer effect was also seen (Fig. 4B). We ascribe these nonspecific P028A1 effects as being due to well-recognized low affinity interactions of cellular transcription factors for nonspecific DNA, and is consistent with its weak abilities to compete for RelA binding in nitrocellulose filter binding assays (Table II), and capture RelA in aptamer-affinity binding studies (Fig. 6A). This nonspecific effect will need to be reduced before ssDNA aptamers like P028F4 can be used to modify RelA action in intact cells.
An important feature of P028F4-RelA interaction, exploited in this study, is that IκBα-complexed RelA is not recognized by P028F4. We base this conclusion on the inability of P028F4 to bind to purified recombinant IκBα-complexed RelA (Fig. 5), its colocalization with activated EGFP-RelA in isolated nuclei (Fig. 3A), its binding to post-translationally modified RelA in cellular extracts (Fig. 6B), and its binding enrichment of RelA (over that of IκBα) in affinity isolations measured by quantitative SRM-MS assays. Previous work has shown that IκBα binds the NH2 terminus of RelA with a 1:1 stoichiometry on discontinuous sequences through its seven ankyrin repeat domains. X-Ray crystallographic analysis of the IκBα·RelA complex shows that first two ankyrin repeats bind (and mask) the RelA nuclear localization signal, and the sixth repeat occludes the RelA DNA-binding cleft (51). Through these interactions, IκBα is able to both inhibit RelA nuclear translocation as well as its DNA binding activity. More work will be required to map the location of RelA binding by P028F4 and determine its effect, if any, on protein conformation.
Although DNA aptamers have been used as affinity reagents for identifying biomarkers in complex fluids (52), they have not yet been fully exploited in protein quantification. The approach we demonstrate here combines aptamer-enrichment of RelA and SRM-MS quantification using stable isotopic dilution methods. Compared with direct quantification of RelA and associated proteins from crude cell extracts, the aptamer-based enrichment approach has several advantages. First, using a RelA-specific aptamer to enrich RelA and its associated proteins before SRM-MS analysis dramatically reduces the sample complexity and hence improves the S/N ratio of endogenous RelA 36-fold. Second, aptamer enrichment also reduces the likelihood of the interference of other analytes that have isobaric (or very similar m/z values) to the target peptides. Therefore the specificity and accuracy of SRM assay are significantly improved. Third, aptamer enrichment allows RelA to be isolated from a large amount of protein extract so that the amount of endogenous RelA peptide falls in the middle of the linear dynamic range of the calibration curve, which improves the accuracy and reproducibility of quantification. This feature is especially attractive for quantification of low-abundance proteins, such as RelA or p300 transcription factors, in complex protein mixtures. Finally, because P028F4 selectively recognizes the IκBα-free, activated form of RelA, we are able to quantify the abundance of the activated form of RelA. This measurement cannot be accomplished by directly analyzing RelA abundance in crude cellular (or subcellular) extracts.
Described earlier, RelA is a cytoplasmic transcription factor that undergoes constitutive nuclear-cytoplasmic transport. In the unstimulated cell, RelA is sequestered in the cytoplasm predominately by binding the IκBα inhibitor, an association that masks the nuclear localization sequence, shifting the nuclear-cytoplasmic equilibrium of RelA to the cytoplasmic compartment. Stimulus-induced RelA activation is mediated by IκBα proteolysis, liberating a fraction of sequestered RelA to translocate into the nucleus, shifting the equilibrium to the nuclear compartment. The theoretical understanding of NF-κB regulation has been developed using computational modeling approaches, where the relative contributions of the IκB isoforms and the effect of the negative feedback loops have been inferred (53, 54). Despite this understanding of pathway connections, the dynamics of negative feedback loops are dependent on the fraction of activated RelA that enters the nucleus. This value is based on assumed values because the precise concentration of activated RelA has not yet been experimentally determined.
This study represents the first quantitative estimate of the number of activated RelA molecules within a cell. The aptamer-SID-SRM estimation of ∼200,000 total molecules of RelA/cell with 50,000 molecules/cell of activated RelA in the nucleus after TNFα stimulation are in good agreement with our previous quantitative Western blot experiments. We also note that the amount of activated RelA is equivalent with the amount of total RelA in both control and TNFα stimulated nuclei. These findings indicate that the majority of RelA present in the nucleus is in the activated state, consistent with our previous findings by Western immunoblots that the amount of nuclear IκBα is very low. The estimate we make here for the number of activated RelA molecules in CE has not been possible without the development of P028F4, and its ability to discriminate between the IκBα-bound and free RelA fractions. We find it interesting that the number of copies of activated RelA in the cytoplasm and nucleus in stimulated cells are similar- a finding that may have implications in understanding the energetics controlling nuclear RelA import.
In conclusion, RelA aptamer-SID-SRM is a versatile tool for quantification of the abundance of activated protein and its complex. Aptamer enrichment enhances assay specificity, S/N ratio, and sensitivity. Further exploitation of this approach will allow for systematic extension of the dynamics of RelA activation in response to diverse ligands, and exploration of protein interaction networks of the molecule in its activated form.
Acknowledgments
We thank Luis Marcelo Holthauzen for assistance with the SPR measurements.
Footnotes
* This work was supported, in part, by NIH grants AI062885 (ARB), 1U54RR02614 UTMB CTSA(ARB), HHSN272200800048C NIAID Clinical Proteomics Center (ARB) and NIH-NLBI-HHSN268201000037C NHLBI Proteomics Center for Airway Inflammation (Alex Kurosky, UTMB).
SPR was performed in the Sealy Center for Structural Biology Core Laboratory, UTMB. Optical imaging was performed by Optical Imaging Laboratory, UTMB.
1 The abbreviations used are:
- NF-κB
- nuclear factor-κB
- ATAP
- ssDNA aptamer-tandem affinity purification
- Bt
- biotinylated
- CE
- cytoplasmic extract
- ChIP
- chromatin immunoprecipitation
- EMSA
- electrophoretic mobility shift assay
- LC
- liquid chromatography
- NE
- nuclear extract
- Q-PCR
- quantitative real-time PCR
- RelA
- 65 kDa NF-κB subunit
- P028A1
- nonspecific ssDNA aptamer
- P028F4
- RelA specific ssDNA aptamer
- SA
- streptavidin
- SIS
- stable isotope labeled standard
- SRM
- selected reaction monitoring
- IKK
- I kappa B kinase
- TAP
- tandem affinity purification
- SID
- stable isotope dilution
- WCE
- whole-cell extract
- Q-RT
- quantitative reverse transcriptase
- WT
- wild-type
- mut
- mutant
- EGFP
- enhanced green fluorescent protein
- S/N
- signal-to-noise ratio.
REFERENCES
- 1. Brasier A. R. (2008) The NF-κB Signaling Network: Insights from systems approaches, In: Brasier A. R., Lemon S. M., Garcia-Sastre A. (eds), Cellular Signaling And Innate Immune Responses To RNA Virus Infections, pp. 119–135, American Society for Microbiology, Washington D. C [Google Scholar]
- 2. Akira S., Uematsu S., Takeuchi O. (2006) Pathogen Recognition and Innate Immunity. Cell 124, 783–801 [DOI] [PubMed] [Google Scholar]
- 3. Tian B., Nowak D. E., Brasier A. R. (2005) A TNF-induced gene expression program under oscillatory NF-kappaB control. BMC Genomics. 6, 137–154 [DOI] [PMC free article] [PubMed] [Google Scholar]
- 4. Tian B., Nowak D. E., Jamaluddin M., Wang S., Brasier A. R. (2005) Identification of Direct Genomic Targets Downstream of the Nuclear Factor-{kappa}B Transcription Factor Mediating Tumor Necrosis Factor Signaling. J. Biol. Chem. 280, 17435–17448 [DOI] [PubMed] [Google Scholar]
- 5. Beg A. A., Baldwin A. S., Jr. (1993) The I kappa B proteins: multifunctional regulators of Rel/NF- kappa B transcription factors. Genes. Dev. 7, 2064–2070 [DOI] [PubMed] [Google Scholar]
- 6. Ea C. K., Deng L., Xia Z. P., Pineda G., Chen Z. J. (2006) Activation of IKK by TNF[alpha] Requires Site-Specific Ubiquitination of RIP1 and Polyubiquitin Binding by NEMO. Molecular. Cell 22, 245–257 [DOI] [PubMed] [Google Scholar]
- 7. Hsu H., Huang J., Shu H. B., Baichwal V., Goeddel D. V. (1996) TNF-dependent recruitment of the protein kinase RIP to the TNF receptor-1 signaling complex. Immunity 4, 387–396 [DOI] [PubMed] [Google Scholar]
- 8. Poyet J. L., Srinivasula S. M., Lin J. H., Fernandes-Alnemri T., Yamaoka S., Tsichlis P. N., Alnemri E. S. (2000) Activation of the IkB kinases by RIP via IKKg/NEMO-mediated oligomerization. J. Biol. Chem. 275, 37966–37977 [DOI] [PubMed] [Google Scholar]
- 9. Delhase M., Hayakawa M., Chen Y., Karin M. (1999) Positive and negative regulation of IkB kinase activity through IKKb subunit phosphorylation. Science 284, 309–313 [DOI] [PubMed] [Google Scholar]
- 10. Karin M. (1999) The beginning of the end: IkappaB kinase (IKK) and NF-kappaB activation. J. Biol. Chem. 274, 27339–27342 [DOI] [PubMed] [Google Scholar]
- 11. Maniatis T. (1997) Catalysis by a multiprotein IkB kinase complex. Science 278, 818–819 [DOI] [PubMed] [Google Scholar]
- 12. Han Y., Weinman S., Boldogh I., Walker R. K., Brasier A. R. (1999) Tumor necrosis factor-alpha-inducible IkappaBalpha proteolysis mediated by cytosolic m-calpain. A mechanism parallel to the ubiquitin-proteasome pathway for nuclear factor-kappab activation. J. Biol. Chem. 274, 787–794 [DOI] [PubMed] [Google Scholar]
- 13. Jamaluddin M., Wang S., Boldogh I., Tian B., Brasier A. R. (2007) TNF-α-Induced NF-κB/Rel A Ser 276 Phosphorylation And Enhanceosome Formation On The IL-8 Promoter Is Mediated By A Reactive Oxygen Species (ROS)-Dependent Pathway. Cell. Signal. 9, 1419–1433 [DOI] [PubMed] [Google Scholar]
- 14. Sasaki C. Y., Barberi T. J., Ghosh P., Longo D. L. (2005) Phosphorylation of RelA/p65 on serine 536 defines an IκBα-independent NF-κB Pathway. J. Biol. Chem. 280, 34538–34547 [DOI] [PubMed] [Google Scholar]
- 15. Cui R., Tieu B., Recinos A., Tilton R. G., Brasier A. R. (2006) Rho A Mediates Angiotensin II-Induced Phospho-Ser536 NF-kB/RelA Subunit Exchange on the IL-6 Promoter in VSMCs. Circ. Res. 99, 723–730 [DOI] [PubMed] [Google Scholar]
- 16. Zhong H., May M. J., Jimi E., Ghosh S. (2002) The Phosphorylation Status of Nuclear NF-[kappa]B Determines Its Association with CBP/p300 or HDAC-1. Molecular. Cell 9, 625–636 [DOI] [PubMed] [Google Scholar]
- 17. Chen L. F., Williams S. A., Mu Y., Nakano H., Duerr J. M., Buckbinder L., Greene W. C. (2005) NF-{kappa}B RelA Phosphorylation Regulates RelA Acetylation. Mol. Cell. Biol. 25, 7966–7975 [DOI] [PMC free article] [PubMed] [Google Scholar]
- 18. Puig O., Caspary F., Rigaut G., Rutz B., Bouveret E., Bragado-Nilsson E., Wilm M., Séraphin B. (2001) The Tandem Affinity Purification (TAP) Method: A General Procedure of Protein Complex Purification. METHODS 24, 218–229 [DOI] [PubMed] [Google Scholar]
- 19. Bouwmeester T., Bauch A., Ruffner H., Angrand P. O., Bergamini G., Croughton K., Cruciat C., Eberhard D., Gagneur J., Ghidelli S., Hopf C., Huhse B., Mangano R., Michon A. M., Schirle M., Schlegl J., Schwab M., Stein M. A., Bauer A., Casari G., Drewes G., Gavin A. C., Jackson D. B., Joberty G., Neubauer G., Rick J., Kuster B., Superti-Furga G. (2004) A physical and functional map of the human TNF-[alpha]/NF-[kappa]B signal transduction pathway. Nat. Cell Biol. 6, 97–105 [DOI] [PubMed] [Google Scholar]
- 20. Ellington A. D., Szostak J. W. (1990) In vitro selection of RNA molecules that bind specific ligands. Nature 346, 818–822 [DOI] [PubMed] [Google Scholar]
- 21. Tuerk C., Gold L. (1990) Systematic evolution of ligands by exponential enrichment: RNA ligands to bacteriophage T4 DNA polymerase. Science 249, 505–510 [DOI] [PubMed] [Google Scholar]
- 22. Widen S. G., Wilson S. H. (1991) Mammalian beta-polymerase promoter: large-scale purification and properties of ATF/CREB palindrome binding protein from bovine testes. Biochemistry 30, 6296–6305 [DOI] [PubMed] [Google Scholar]
- 23. Jamaluddin M., Tian B., Boldogh I., Garofalo R. P., Brasier A. R. (2009) Respiratory Syncyctial Virus Infection Induces A ROS-MSK1-Phospho-Ser-276 RelA Pathway Required For Cytokine Expression. J. Virol. 83, 10605–10615 [DOI] [PMC free article] [PubMed] [Google Scholar]
- 24. Liu P., Lu M., Tian B., Li K., Garofalo R. P., Prusak D., Wood T. G., Brasier A. R. (2009) Expression Of An IKKγ Splice Variant Determines IRF3 - Canonical NF-κB Pathway Utilization In ssRNA Virus Infection. PLoS One 4, e8079 [DOI] [PMC free article] [PubMed] [Google Scholar]
- 25. Akagi T., Sasai K., Hanafusa H. (2003) Refractory nature of normal human diploid fibroblasts with respect to oncogene-mediated transformation. Proc. Natl. Acad. Sci. U. S. A. 100, 13567–13572 [DOI] [PMC free article] [PubMed] [Google Scholar]
- 26. Forbus J., Spratt H., Wiktorowicz J., Wu Z., Boldogh I., Denner L., Kurosky A., Brasier R. C., Luxon B., Brasier A. R. (2006) Functional Analysis Of The Nuclear Proteome Of Human A549 Alveolar Epithelial Cells By HPLC- High Resolution 2D Gel Electrophoresis. Proteomics 6, 2656–2672 [DOI] [PubMed] [Google Scholar]
- 27. Jamaluddin M., Wiktorowicz J. E., Soman K. V., Boldogh I., Forbus J. D., Spratt H., Garofalo R. P., Brasier A. R. (2010) Role of Peroxiredoxin-1 and -4 in Protection of RSV-induced Cysteinyl-oxidation of Nuclear Cytoskeletal Proteins. J. Virol. 84, 9533–9545 [DOI] [PMC free article] [PubMed] [Google Scholar]
- 28. Stanlis K. K., McIntosh J. R. (2003) Single-strand DNA Aptamers as Probes for Protein Localization in Cells. J. Histochem. Cytochem. 51, 797–808 [DOI] [PubMed] [Google Scholar]
- 29. Jamaluddin M., Casola A., Garofalo R. P., Han Y., Elliott T., Ogra P. L., Brasier A. R. (1998) The major component of IkBa proteolysis occurs independently of the proteasome pathway in Respiratory Syncytial Virus-infected pulmonary epithelial cells. J. Virol. 72, 4849–4857 [DOI] [PMC free article] [PubMed] [Google Scholar]
- 30. Tian B., Nowak D. E., Jamaluddin M., Wang S., Brasier A. R. (2005) Identification of Direct Genomic Targets Downstream of the Nuclear Factor-{kappa}B Transcription Factor Mediating Tumor Necrosis Factor Signaling. J. Biol. Chem. 280, 17435–17448 [DOI] [PubMed] [Google Scholar]
- 31. Hou T., Ray S., Brasier A. R. (2007) The functional role of an IL-6 inducible CDK9-STAT3 complex in human γ-fibrinogen gene expression. J. Biol. Chem. 282, 37091–37102 [DOI] [PubMed] [Google Scholar]
- 32. Nowak D. E., Tian B., Brasier A. R. (2005) Two-Step Cross-linking method for Identification of NF-κB Gene Network by Chromatin Immunoprecipitation. BioTechniques 39, 715–725 [DOI] [PubMed] [Google Scholar]
- 33. Tian B., Yang J., Brasier A. R. (2011) Two-step Crosslinking for Analysis of Protein-Chromatin Interactions. Meth. Mol. Biol. in press [DOI] [PMC free article] [PubMed] [Google Scholar]
- 34. Miceli R. M., DeGraaf M. E., Fischer H. D. (1994) Two-stage selection of sequences from a random phage display library delineates both core residues and permitted structural range within an epitope. J. Immunol. Methods. 167, 279–287 [DOI] [PubMed] [Google Scholar]
- 35. Lange V., Picotti P., Domon B., Aebersold R. (2008) Selected reaction monitoring for quantitative proteomics: a tutorial. Mol. Syst. Biol. 4, 222 [DOI] [PMC free article] [PubMed] [Google Scholar]
- 36. Markham N. R., Zuker M. (2008) UNAFold: software for nucleic acid folding and hybridization. Methods Mol. Biol 453, 3–31 [DOI] [PubMed] [Google Scholar]
- 37. Garofalo R., Sabry M., Jamaluddin M., Yu R. K., Casola A., Ogra P. L., Brasier A. R. (1996) Transcriptional activation of the interleukin-8 gene by RSV infection in alveolar epithelial cells: Nuclear translocation of the Rel A transcription factor as a mechanism producing airway mucosal inflammation. J. Virol. 70, 8773–8781 [DOI] [PMC free article] [PubMed] [Google Scholar]
- 38. Nowak D. E., Tian B., Jamaluddin M., Boldogh I., Vergara L. A., Choudhary S., Brasier A. R. (2008) RelA Ser276 Phosphorylation Is Required for Activation of a Subset of NF-{kappa}B-Dependent Genes by Recruiting Cyclin-Dependent Kinase 9/Cyclin T1 Complexes. Mol. Cell. Biol. 28, 3623–3638 [DOI] [PMC free article] [PubMed] [Google Scholar]
- 39. Bosisio D., Marazzi I., Agresti A., Shimizu N., Bianchi M. E., Natoli G. (2006) A hyper-dynamic equilibrium between promoter-bound and nucleoplasmic dimers controls NF-kappaB-dependent gene activity. EMBO J. 25, 798–810 [DOI] [PMC free article] [PubMed] [Google Scholar]
- 40. Thoms H. C., Loveridge C. J., Simpson J., Clipson A., Reinhardt K., Dunlop M. G., Stark L. A. (2010) Nucleolar Targeting of RelA(p65) Is Regulated by COMMD1-Dependent Ubiquitination. Cancer Res. 70, 139–149 [DOI] [PubMed] [Google Scholar]
- 41. Addona T. A., Abbatiello S. E., Schilling B., Skates S. J., Mani D. R., Bunk D. M., Spiegelman C. H., Zimmerman L. J., Ham A. J., Keshishian H., Hall S. C., Allen S., Blackman R. K., Borchers C. H., Buck C., Cardasis H. L., Cusack M. P., Dodder N. G., Gibson B. W., Held J. M., Hiltke T., Jackson A., Johansen E. B., Kinsinger C. R., Li J., Mesri M., Neubert T. A., Niles R. K., Pulsipher T. C., Ransohoff D., Rodriguez H., Rudnick P. A., Smith D., Tabb D. L., Tegeler T. J., Variyath A. M., Vega-Montoto L. J., Wahlander A., Waldemarson S., Wang M., Whiteaker J. R., Zhao L., Anderson N. L., Fisher S. J., Liebler D. C., Paulovich A. G., Regnier F. E., Tempst P., Carr S. A. (2009) Multi-site assessment of the precision and reproducibility of multiple reaction monitoring-based measurements of proteins in plasma. Nat. Biotechnol. 27, 633–641 [DOI] [PMC free article] [PubMed] [Google Scholar]
- 42. Keshishian H., Addona T., Burgess M., Mani D. R., Shi X., Kuhn E., Sabatine M. S., Gerszten R. E., Carr S. A. (2009) Quantification of cardiovascular biomarkers in patient plasma by targeted mass spectrometry and stable isotope dilution. Mol. Cell Proteomics 8, 2339–2349 [DOI] [PMC free article] [PubMed] [Google Scholar]
- 43. Kuhn E., Addona T., Keshishian H., Burgess M., Mani D. R., Lee R. T., Sabatine M. S., Gerszten R. E., Carr S. A. (2009) Developing multiplexed assays for troponin I and interleukin-33 in plasma by peptide immunoaffinity enrichment and targeted mass spectrometry. Clin. Chem. 55, 1108–1117 [DOI] [PMC free article] [PubMed] [Google Scholar]
- 44. Green J. M. (1996) A practical guide to analytical method validation. Anal. Chem. 68, A305-A309 [Google Scholar]
- 45. Kuzyk M. A., Smith D., Yang J., Cross T. J., Jackson A. M., Hardie D. B., Anderson N. L., Borchers C. H. (2009) Multiple reaction monitoring-based, multiplexed, absolute quantitation of 45 proteins in human plasma. Mol. Cell Proteomics 8, 1860–1877 [DOI] [PMC free article] [PubMed] [Google Scholar]
- 46. Nelson D. E., Ihekwaba A. E., Elliott M., Johnson J. R., Gibney C. A., Foreman B. E., Nelson G., See V., Horton C. A., Spiller D. G., Edwards S. W., McDowell H. P., Unitt J. F., Sullivan E., Grimley R., Benson N., Broomhead D., Kell D. B., White M. R. (2004) Oscillations in NF-{kappa}B signaling control the dynamics of gene expression. Science 306, 704–708 [DOI] [PubMed] [Google Scholar]
- 47. Wurster S. E., Maher L. J., 3rd (2008) Selection and characterization of anti-NF-+ B p65 RNA aptamers. RNA 14, 1037–1047 [DOI] [PMC free article] [PubMed] [Google Scholar]
- 48. Bassett S. E., Fennewald S. M., King D. J., Li X., Herzog N. K., Shope R., Aronson J. F., Luxon B. A., Gorenstein D. G. (2004) Combinatorial Selection and Edited Combinatorial Selection of Phosphorothioate Aptamers Targeting Human Nuclear Factor-kB RelA/p50 and RelA/RelA. Biochemistry 43, 9105–9115 [DOI] [PubMed] [Google Scholar]
- 49. Chen Y. Q., Ghosh S., Ghosh G. (1998) A novel DNA recognition mode by the NF-kappa B p65 homodimer. Nat. Struct. Biol. 5, 67–73 [DOI] [PubMed] [Google Scholar]
- 50. Huang D. B., Vu D., Cassiday L. A., Zimmerman J. M., Maher L. J., 3rd, Ghosh G. (2003) Crystal structure of NF-kB (p50)2 complexed to a high-affinity RNA aptamer. Proc. Natl. Acad. Sci. U. S. A. 100, 9268–9273 [DOI] [PMC free article] [PubMed] [Google Scholar]
- 51. Jacobs M. D., Harrison S. C. (1998) Structure of an I[kappa]B[alpha]/NF-[kappa]B Complex. Cell 95, 749–758 [DOI] [PubMed] [Google Scholar]
- 52. Berezovski M. V., Lechmann M., Musheev M. U., Mak T. W., Krylov S. N. (2008) Aptamer-facilitated biomarker discovery (AptaBiD). J. Am. Chem. Soc. 130, 9137–9143 [DOI] [PubMed] [Google Scholar]
- 53. Hoffmann A., Levchenko A., Scott M. L., Baltimore D. (2002) The IkappaB - NF-kappaB signaling module: Temporal control and selective gene activation. Science 298, 1241–1245 [DOI] [PubMed] [Google Scholar]
- 54. Lipniacki T., Paszek P., Brasier A. R., Luxon B., Kimmel M. (2004) Mathematical model of NF-kappaB regulatory module. J. Theor. Biol. 228, 195–215 [DOI] [PubMed] [Google Scholar]