

Abstract
Idiosyncratic drug hepatotoxicity represents a major problem in drug development due to inadequacy of current preclinical screening assays, but recently established rodent models utilizing bacterial LPS co-administration to induce an inflammatory background have successfully reproduced idiosyncratic hepatotoxicity signatures for certain drugs. However, the low-throughput nature of these models renders them problematic for employment as preclinical screening assays. Here, we present an analogous, but high-throughput, in vitro approach in which drugs are administered to a variety of cell types (primary human and rat hepatocytes and the human HepG2 cell line) across a landscape of inflammatory contexts containing LPS and cytokines TNF, IFNγ, IL-1α, and IL-6. Using this assay, we observed drug-cytokine hepatotoxicity synergies for multiple idiosyncratic hepatotoxicants (ranitidine, trovafloxacin, nefazodone, nimesulide, clarithromycin, and telithromycin) but not for their corresponding non-toxic control compounds (famotidine, levofloxacin, buspirone, and aspirin). A larger compendium of drug-cytokine mix hepatotoxicity data demonstrated that hepatotoxicity synergies were largely potentiated by TNF, IL-1α, and LPS within the context of multi-cytokine mixes. Then, we screened 90 drugs for cytokine synergy in human hepatocytes and found that a significantly larger fraction of the idiosyncratic hepatotoxicants (19%) synergized with a single cytokine mix than did the non-hepatotoxic drugs (3%). Finally, we used an information theoretic approach to ascertain especially informative subsets of cytokine treatments for most highly effective construction of regression models for drug- and cytokine mix-induced hepatotoxicities across these cell systems. Our results suggest that this drug-cytokine co-treatment approach could provide a useful preclinical tool for investigating inflammation-associated idiosyncratic drug hepatotoxicity.
Keywords: drug-induced liver injury, adverse drug reactions, pre-clinical assays, information theory, partial least-squares modeling
INTRODUCTION
Idiosyncratic drug hepatotoxicity is defined as drug-induced liver injury that occurs in a very small fraction of human patients, is unrelated to the pharmacologic target of the drug, and is host dependent (Ganey et al., 2004; Kaplowitz, 2005; Uetrecht, 2007). Idiosyncratic drug hepatotoxicity is poorly predicted by standard preclinical cell culture and animal models as well as in clinical trials, and, consequently, most idiosyncratic drug hepatotoxicities are not evident until after approval for human use. Due to the inability to predict idiosyncratic hepatotoxicities in the drug development process, idiosyncratic drug hepatotoxicity frequently leads to drug withdrawal or “black box” warnings and accounts for more than 10% of acute liver failure cases (Uetrecht, 2003; Kaplowitz, 2005). Multiple hypotheses have been suggested to explain the mechanisms underlying idiosyncratic drug hepatotoxicity. These include (i) variations in drug metabolism, particularly associated with alterations in the expression and/or activities of the cytochrome P450 family enzymes, due to variable environmental conditions and/or genetic polymorphisms in the human population (Uetrecht, 2008); and (ii) a relationship with concomitant liver inflammation associated with viral or bacterial infection or liver or inflammatory disease (Ganey et al., 2004). Moreover, it is likely that multiple factors -- both genetic and environmental -- contribute, at relative degrees which are not predictable at the present time, to a drug’s hepatotoxicity idiosyncrasies (Peters, 2005).
A number of preclinical models have been developed in attempts to predict idiosyncratic drug hepatotoxicity, including the assessment of reactive metabolites through glutathione (GSH) conjugation assays and the evaluation of animals models by toxicogenomic and metabolonomic approaches to identify common idiosyncratic hepatotoxicity-associated biomarkers, with little overall predictive success (Kaplowitz, 2005; Peters, 2005; Obach et al., 2008). Rodent models administered with bacterial lipopolysaccharide (LPS) have been recently developed to assess inflammation-associated idiosyncratic drug hepatotoxicity. In these rodent models, LPS exposure induces a mild inflammatory response that has been demonstrated to synergistically induce hepatotoxicity in the presence of a number of idiosyncratic hepatotoxic drugs, including diclonfenac, sulindac, trovafloxacin, ranitidine, chlorpromazine, but not non- or less-toxic control drugs (Buchweitz et al., 2002; Luyendyk et al., 2003; Deng et al., 2006; Shaw et al., 2007). In rats, LPS administration upregulates plasma concentrations of the cytokines tumor necrosis factor-α (TNF), interferon-γ (IFNγ ), interleukin-1α and -1β (IL-1α/β), interleukin-6 (IL-6), and the chemokine interleukin-10 (IL-10) (Bergheim et al., 2006). Of these, TNF, IFNγ, IL-1α/β, IL-6, and LPS itself all stimulate hepatocyte signaling responses through the activation of a diversity of intracellular signal transduction pathways, including the IKK–NF-κB, p38, and JNK pathways (associated with TNF, IL-1α/β, and LPS signaling) and the STAT1 and STAT3 pathways (associated with IFNγ and IL-6 signaling, respectively), which all are implicated in hepatocellular death in liver diseases and injuries (reviewed in (Luedde and Trautwein, 2006; Schwabe and Brenner, 2006; Malhi and Gores, 2008; Tacke et al., 2008)). In LPS-administered rat models, synergistic induction of hepatocellular death in the presence of the idiosyncratic hepatotoxicants ranitidine and trovafloxacin has been reported to be dependent on TNF signaling (Shaw et al., 2007; Tukov et al., 2007; Shaw et al., 2009). The observations in LPS-administered rodent models suggest that idiosyncratic drug hepatotoxicity can arise when mild drug-induced hepatocellular stresses synergize with LPS-induced inflammatory cytokine signaling to elicit acute hepatocellular death (Ganey et al., 2004; Kaplowitz, 2005). These stresses may be idiosyncratic in nature in human patients due variations in drug metabolism, exposure, and/or clearance. The sensitizing role of hepatocellular stress is supported by the fact that drug-induced depletion of glutathione is known to sensitize hepatocytes to TNF-induced apoptosis (Mari et al., 2008). Furthermore, both LPS and inflammatory cytokine signaling can alter hepatocyte expression of cytochrome P450 enzymes and thus lead to dysregulated drug metabolism and clearance in conditions of LPS-induced liver inflammation (Warren et al., 1999; Zolfaghari et al., 2007). Although they offer promise for improved predictability of idiosyncratic hepatotoxicity in preclinical screening, LPS-administered rodent models lack sufficient throughput for preclinical screening of candidate pharmaceuticals. Moreover, it has been shown that animal models are in general not highly predictive of human drug hepatotoxicity, as combined preclinical testing in rodents, dogs, and monkeys can only identify ~50% of known human hepatotoxicants (Olson et al., 2000).
Recent advances in the maintenance and characterization of in vitro hepatocyte culture systems offer substantial promise for their more wide-spread utilization in high-throughput preclinical screening approaches for theprediction of both non-idiosyncratic and idiosyncratic drug hepatotoxicity in humans. Amongst hepatocyte culture systems that are commonly employed for high-throughput preclinical studies, primary human hepatocytes are considered the “gold standard” for evaluating drug metabolism, transport, and toxicity (LeCluyse et al., 2005; Hewitt et al., 2007). In comparison, primary rat hepatocytes, while more readily available and similarly capable of maintaining differentiated hepatic function in time-scales of a few days in vitro, do not reproduce some aspects of human drug metabolism (Xu et al., 2004; Sivaraman et al., 2005). Immortalized and transformed human cell lines (e.g. HepG2 cells) are also frequently employed but have poor maintenance of liver-specific functions and are relatively insensitive to human hepatotoxicants in simple cytotoxicity assays (Xu et al., 2004; O’Brien and Haskins, 2007). A small number of hepatocyte cell culture models have been recently developed to assess idiosyncratic drug hepatotoxicity. Of note, Xu et al utilized human hepatocyte cell culture models to assay four sub-lethal hepatotoxicity injuries with high-throughput live-cell microscopy for over 300 drugs, including many that cause idiosyncratic liver toxicity in humans (Xu et al., 2008). Using a well-calibrated random forest prediction model of the imaging data, they were able to predict drug hepatotoxicity with a ~50% true-positive rate and ~5% false-positive rate. A rat hepatocyte-Kupffer cell co-culture model has been developed and shown to successfully predict chlorpromazine idiosyncratic hepatotoxicity through its synergistic induction of hepatocellular death following LPS treatment (Tukov et al., 2006). The further development and validation of hepatocyte cell culture models would provide much-needed tools for the preclinical evaluation of idiosyncratic drug hepatotoxicity and could offer greater predictive ability and higher throughput than LPS-administered animal models.
Here, we describe a model of inflammatory cytokine-associated idiosyncratic drug hepatotoxicity in three standard hepatocyte cell culture systems amenable to high-throughput preclinical screening -- primary rat and human hepatocytes and the HepG2 human hepatoblastoma cell line. We initially validate this model to demonstrate that a number of idiosyncratic hepatotoxic drugs (ranitidine, trovafloxacin, nefazodone, nimesulide, clarithromycin) synergistically induce hepatocellular death in vitro when co-administered with a cytokine mix containing the LPS-upregulated cytokines TNF, IFNγ, and IL-1α, and LPS itself. We then collect a hepatotoxicity data compendium comprised of combinations of drug and cytokine mix co-treatments covering ~1500 experimental conditions and analyze it to identify informative cytokine mix treatments and hepatocyte cell systems for predicting inflammation-associated idiosyncratic drug hepatotoxicity. Using this data compendium, we show that in vitro drug-cytokine synergies are predominantly potentiated by TNF, IL-1α, and LPS within the context of multi-cytokine mixes and that patterns of drug-cytokine mix synergies across a landscape of multi-cytokine environments can be shown to correlate to drug-induced sub-lethal hepatocyte injury signatures. Then, we demonstrate the screening utility of this drug-cytokine mix co-treatment model by assaying a set of 90 drugs in human hepatocytes and show that a significantly larger fraction of idiosyncratic hepatotoxicants synergize with a single cytokine mix at physiologically relevant dosing concentrations than do non-toxic drugs. Lastly, we also employ an information theoretic technique to identify subsets of cytokine co-treatment conditions that maintain the information contained across the full set of cytokine conditions in the compendium. We show that these informative condition sets can be transferred across cell systems and act as better trainings sets for predicting drug- and cytokine-induced hepatotoxicities in primary human hepatocytes. Our results indicate promise for employing our approach for efficient in vitro investigation of inflammation-associated idiosyncratic drug hepatotoxicity.
METHODS
Drugs and cytokines
Most drugs were obtained from Sigma (St. Louis, MO) or Sequoia Research Products (Pangbourne, UK). Trovafloxacin was obtained from Pfizer’s chemical sample bank (Groton, CT). Unless otherwise noted, the following drug concentrations were used: 450 μM ranitidine, 450 μM trovafloxacin, 70 μM nefazodone, 450 μM nimesulide, 175 μM clarithromycin, and 175 μM telithromycin. These drug concentrations were selected from initial dosing studies based on the criteria that the drug concentration (i) elicit minimal drug-only hepatotoxicity, (ii) induce robust supra-additive hepatotoxicity synergy with a representative cytokine mix, and (iii) be within a physiologically relevant dosing limit of 100-fold its Cmax value, which was satisfied for all drugs except ranitidine, for which a dose of 317*Cmax was selected (see Figures 1 and S6 for additional details). TPCA-1, an IKK-2 inhibitor, was obtained from Tocris Bioscience (Ellisville, MS). All drugs were suspended in 0.25% final DMSO.
Figure 1.

Identification of drug dose-dependent hepatotoxicity synergies between a cytokine mix and multiple idiosyncratic hepatotoxic drugs in primary rat hepatocytes (panels A-E) and HepG2 cells (panels F-J). Primary rat hepatocytes and HepG2 cells were cultured, treated, and assayed for LDH (at 24 or 48 hours post-treatment) as described in Methods. Drugs were dosed at varying concentrations in the presence or absence of a cytokine mix containing 100 ng/ml TNF, 100 ng/ml IFNγ, 20 ng/ml IL-1α, and 10 μg/ml LPS. LDH release values were fold-change normalized to DMSO/no cytokine control samples from the same cell system. (Note that LDH release axes are separately scaled for each plot.) Drugs from similar chemical class and/or molecular target are plotted together, with the less or non-hepatotoxic “comparison” drug in blue and the more idiosyncratic hepatotoxic drug in red. Data are presented as mean ± SEM of four biological samples. Results from additional time points, with drug doses plotted with respect to both molecular concentrations and drug Cmax values, are shown in Figures S1–S5.
Recombinant rat or human cytokines were obtained from R&D Systems (Minneapolis, MN) and were used at the following saturating concentrations: 100 ng/ml tumor necrosis factor-α (TNF), 100 ng/ml interferon-γ (IFNγ), 20 ng/ml interleukin-1α (IL-1α), and 20 ng/ml interleukin-6 (IL-6). Lipopolysaccharides (LPS) serotype 1 from E. coli 0111:B4 was used at 10 μg/ml, as previously (Geller et al., 1993). In most cell culture studies, especially involving monocyte or macrophages (e.g. Kupffer cells), lower LPS concentrations (~1–10 ng/ml) are used (Bellezzo et al., 1996). Though hepatocytes express the LPS receptor TLR4, they are substantially less responsive to LPS than are macrophages (Geller et al., 1993; Bellezzo et al., 1996). Consequently, a sufficiently high LPS concentration was selected to ensure that LPS was fully stimulating hepatocytes and not just the very small fraction of Kupffer cells (present at ~0.4% in both human and rat hepatocyte seeding isolates) that may have remained viable 2–3 days post-seeding. Unless noted, all reagents were obtained from Sigma.
Drug hepatotoxicity classifications and pharmacokinetic properties
Drug hepatotoxicity classifications were made according to a drug-induced liver injury (DILI) scale (see Table S1) based on clinical data collected from PubMed searches, as in (Xu et al., 2008). For select drugs, idiosyncratic hepatotoxicity classifications were assigned according to literature references (see Table S2). Therapeutically appropriate drug exposure levels were defined by average plasma maximum concentration (Cmax) values observed in humans upon single- or multi-dose administration at commonly recommended therapeutic doses. Cmax values were obtained from a combination of literature searches and available databases, as in (Xu et al., 2008), and are reported in Table S3. Unless noted otherwise, a concentration of 100-fold Cmax, encompassing a scaling factor to account for human population pharmacokinetic and toxicodynamic variabilities, was considered as a therapeutically relevant dosing limit for each drug, as previously discussed (Xu et al., 2008).
Liver cell isolation, culture, and stimulation
Primary rat hepatocytes were isolated from male Fisher rats using a modified collagenase perfusion and Percoll isolation, routinely yielding >90% viability, as described previously (Cosgrove et al., 2008). Cell type purity was assessed by flow cytometry and showed that rat hepatocyte isolates were routinely comprised of ~97% hepatocytes (albumin+-cytokeratin-18+ cells), ~0.4% Kupffer cells (ED2/CD163+), ~0.4% stellate cells (GFAP+), and ~0.2% sinusoidal endothelial cells (SE-1+), as previously reported (Cosgrove et al., 2008). Rat hepatocytes were seeded on collagen type I-coated 96-well plates (BD Biosciences, Franklin Lakes, NJ) at 1×10⁵ cells/cm2 in insulin-containing, serum-free hepatocyte growth medium (HGM; as in (Cosgrove et al., 2008) but supplemented with 1 μM trichostatin A). One day post-seeding, rat hepatocytes were overlayed with 0.25 mg/ml Matrigel (growth factor-reduced; BD Biosciences) in fresh HGM. One day following Matrigel overlay, primary rat hepatocytes were stimulated with drugs and/or cytokines in fresh HGM. For rat and human hepatocyte studies, multiple donors were used throughout this work, with a single donor used for each self-consistent data set. For rat hepatocytes, donor-to-donor variability was assessed by comparing two drug- and cytokine mix-induced hepatotoxicity data compendia (each consisting of the same 256 treatment conditions) collected from two separate primary rat hepatocyte isolations. The two separate data compendia showed a high degree of reproducibility (R = 0.98; see Figure S10).
Primary human hepatocytes were obtained in suspension from CellzDirect (Durham, NC). Cell type purity was assessed by flow cytometry and showed that human hepatocyte isolates were routinely comprised of ~97% hepatocytes (albumin+-cytokeratin-18+ cells), ~0.4% Kupffer cells (CD163+), ~0.3% stellate cells (GFAP+), ~0.03% endothelial cells (CD31+), and 0.03% bile epithelial cells (cytokeratin-19+) (L.G. Alexopoulos, B.D. Cosgrove, and P.K. Sorger, unpublished results). Human hepatocytes were seeded on collagen type I-coated 96-well plates at 1.5×10⁵ cells/cm2 in “plating medium” consisting of Dulbecco’s modified Eagle’s medium (DMEM) supplemented with 5% fetal bovine serum (FBS; Hyclone, Logan, UT), 100 U/ml penicillin, 100 μg/ml streptomycin, 0.58 mg/ml L-glutamine, 1 μM trichostatin A, 0.5 μM dexamethasone, and 5 μg/ml insulin. One day post-seeding, human hepatocytes were overlayed with 0.25 mg/ml Matrigel in “culturing medium” consisting of William’s E medium (WEM) supplemented with 15 mM HEPES, 100 U/ml penicillin, 100 μg/ml streptomycin, 0.29 mg/ml L-glutamine, 1 μM trichostatin A, 0.1 μM dexamethasone, 5 μg/ml insulin, 5 μg/ml transferrin, and 5 ng/ml sodium selenite. One day following Matrigel overlay, human hepatocytes were stimulated with drugs and/or cytokines in “dosing medium” (consisting of “culturing medium” but without transferrin and sodium selenite).
HepG2 cells were obtained from ATCC (Manassas, VA) and were maintained per ATCC recommendations. HepG2 cells were seeded on collagen type I-coated 96-well plates at 1×10⁵ cells/cm2 in Eagle’s minimum essential medium (EMEM; ATCC) supplemented with 10% FBS, 100 U/ml penicillin, and 100 μg/ml streptomycin. One day after seeding, medium was changed to fresh EMEM without FBS. One day after medium change, HepG2 cells were stimulated with drugs and/or cytokines in fresh EMEM without FBS. All cells were maintained at 37°C and 5% CO2.
Quantitative cell apoptosis and death assays
At 12, 24, or 48 hours post-drug and/or cytokine treatment, conditioned medium samples were collected to assay lactate dehydrogenase (LDH) release (indicator of necrotic and apoptotic cell death) and cells were assayed for caspase 3/7 activity (indicator of apoptotic cell death). LDH activity in culture supernatants was quantified using a CytoTox-ONE Homogeneous Membrane Integrity Assay (Promega, Madison, WI) according to manufacturer’s recommendations. Cellular caspase 3/7 activity was quantified using a Caspase-Glo 3/7 Assay (Promega) according to manufacturer’s recommendations. For each cell system and time-point, LDH and caspase 3/7 activity assay results were fold-change normalized to the average DMSO control/no cytokine treatment value from four or more biological samples from the same 96-well culture plate.
Quantitative sub-lethal hepatotoxicity imaging assays
Drug-induced sub-lethal hepatotoxicity phenotypes were quantitatively imaged in human hepatocytes in the absence of cytokine co-treatment, essentially as described previously (Xu et al., 2008). Briefly, human hepatocytes at 24 or 48 hours post-treatment were stained with four fluorescent probes: DRAQ5 (Biostatus, Shapshed, UK) to stain nuclei and lipids, CM-H2DCFDA (Invitrogen, Carlsbad, CA) to stain reactive oxygen species (ROS), TMRM (Invitrogen) to stain mitochondrial membrane potential (MtMP), and mBCl (Invitrogen) to stain glutathione (GSH). Automated live-cell, multi-color image acquisition was performed on a Kinetic Scan Reader (Cellomics, Pittsburgh, PA) using a 20× objective and a XP93 filter set (Omega Optical, Brattleboro, VT). Quantitative image analysis was performed using ImagePro Plus software (Media Cybermetrics, Bethesada, MD). In each image, five features were quantified: nuclei count and intracellular lipid (non-nuclear DRAQ5 stain), ROS, MtMP, and GSH contents. For each feature, the summed intensity value from each well was normalized by the total nuclei count (~500 imaged per well), and then the intensity-per-cell values were fold-change normalized to the average DMSO control value from eight or more biological samples from the same 96-well culture plate.
Factorial analysis
The drug-cytokine mix hepatotoxicity compendium was collected such that a full factorial design of the five cytokine or LPS treatments (25 = 32 mixes) was included for each drug co-treatment in each cell system. For each drug/cell system, the fold-change normalized toxicity assay values were subjected to factorial analysis. One-, two-, three-, four-, and five-factor effects and their associated errors were calculated according to standard factorial analysis formulae (Box et al., 1978).
Hierarchical clustering
The drug-cytokine mix combinatorial hepatotoxicity compendium was fused across all cell systems and assay types to generate a hepatotoxicity matrix spanning 192 “experimental” conditions (i.e., combinations of cell type, assay readout, and cytokine treatment) and 8 drug treatments. For each combination of cell system and assay type, the fold-change normalized values were linearly mapped to a scale from the minimum observed value (set to 0) and the maximum observed value (set to 1). The fused data compendium was subjected to two-way clustering using the unweighted pair group method with arithmetic mean and a Pearson distance metric.
Joint entropy-based representative subset selection
To identify subsets of cytokine treatments that maximally maintain the diversity of hepatotoxicity responses across different cell systems and assays, a representative subset selection technique was applied using an information theoretic scoring function. All subsets considered were constrained to include the no-cytokine treatment as well as all treatments containing only a single cytokine or LPS. To this set of six conditions, all possible combinations of other cytokine treatment combinations were added. Each candidate subset was then scored by computing the joint entropy of all drug hepatotoxicity responses (using the fold-change normalized data from both the caspase 3/7 and LDH release assays) across the subset using data from: (i) only primary human hepatocytes, (ii) only primary rat hepatocytes, (iii) only HepG2 cells, or (iv) both rat hepatocytes and HepG2 cells. Joint entropies were computed by first discretizing each drug response into three equiprobable bins and then applying the second-order Maximum Information Spanning Tree approximation (King and Tidor, 2009). Having scored all cytokine condition subsets, the maximum-entropy set of each size (i.e. number of cytokine treatment conditions) was identified. Additionally, a consensus set for each size was selected by including the conditions that were most prevalent in the top 100 subsets. See Supplementary Methods for additional details.
Partial least-squares (PLS) regression modeling
To examine the utility of the maximum entropy sets described above, we used them as a basis for training predictive PLS models of hepatotoxicity across, and within, cell types and drug treatments. PLS models were built using the PLSREGRESS function in MATLAB release 2008a (The Mathworks Inc., Natick, MA), which implements the SIMPLS algorithm. All variables were variance-scaled (with respect to the training set) prior to learning the model and all models used two principal components. Separate models were built treating the hepatotoxicity response profile of each drug in human hepatocytes across the cytokine conditions as the dependent variable. One class of models (“single drug”) was built in which only the response profiles to the same drug in rat hepatocytes and/or HepG2 cells were used as independent variables. In a second class of models, all drug profiles in rat hepatocytes and/or HepG2 cells were used. Models were built using the training sets (containing 25 of the 32 cytokine conditions) and then used to predict the values of the test sets (containing the remaining 7 conditions), and the correlation coefficient between predicted and observed values in the test set was computed. For the randomly chosen sets, all sets were enforced to include the no-cytokine and all five single-cytokine/LPS conditions, as this constraint was also applied to the maximum entropy consensus sets. See Supplementary Methods for additional details.
Statistical analysis
To identify drug-cytokine mix co-treatment conditions that elicited supra-additive hepatotoxicity synergies, additive projections of drug-cytokine mix co-treatments were estimated by adding mean values of drug-only and cytokine mix-only toxicities and propagating their associated variances. Supra-additive synergies were identified for conditions in which the observed drug-cytokine mix co-treatment results exceeded the additive projections as assessed by a two-sample, one-tailed (Student’s) t test with a false discovery rate correction for multiple comparison testing for multiple drug doses or multiple cytokine mixes. The statistical significance of each factorial effect and its associated error was assessed using a one-sample, two-tailed t test with a false discovery rate correction for multiple cytokine mixes. Statistical significance of drug-induced sub-lethal hepatotoxicities was assessed by a Student’s t test. In the 90-drug study, a threshold two-fold above the additive projection was used to identify supra-additive drug-cytokine mix synergy due to the limited number of replicate samples instead of a Student’s t test. The statistical significance of the observed number of synergistic drugs in the each hepatotoxic group was assessed using a hypergeometric test (see Table 1 for details). All tests were performed at a significance level of α = 0.05. False discovery rate-corrected P-values were calculated as: P = α (N+1)/(2N), where N is the number of comparisons.
Table 1.
Drug-cytokine hepatotoxicity synergies in the large-scale human hepatocyte toxicity study evaluated by DILI class and physiological dosing limit.
| Drug hepatotoxicity classification by DILI categories1 | N | Drugs with one or more dose with cytokine synergy within the applied physiological dosing limit2 | |||
|---|---|---|---|---|---|
| Using each drug’s Cmax value | Using the median Cmax value | ||||
| 100*Cmax | 33*Cmax | 100*Cmax | 33*Cmax | ||
| Idiosyncratic hepatotoxic (DILI P2) | 43 | 8 (19%) | 7 (16%) | 9 (21%) | 7 (16%) |
| Not or minimally hepatotoxic (DILI O2, N3-N1) | 36 | 1 (3%) | 0 (0%) | 7 (19%) | 0 (0%) |
| Hypergeometric test | P-value3 | 0.028 | 0.011 | 0.55 | 0.011 |
DILI categories are described in Table S1.
Hepatotoxicity in this large-scale primary human hepatocyte study was assayed by LDH release (see Figures 5 and S17). Drug-cytokine synergies that were at least two-fold (with respect to the LDH release, reported as fold-change compared to the DMSO/no cytokine control condition) greater than the calculated supra-additive synergy threshold were characterized as synergistic. This “rule-of-thumb” threshold was used instead of a supra-additive Student’s t test (see Methods and Figure S6) as two or three biological samples per condition were used due to the screening nature of this large-scale study, thus limiting the ability to satisfy statistical significance tests. Drug-cytokine synergy was assessed with regards to two different methods of defining a physiologically relevant dosing limit: (i) using each drug’s own 33*Cmax or 100*Cmax concentration, or (ii) using the median 33*Cmax (30 μM) or 100*Cmax (91 μM) concentration for all drugs in this study (as an general estimate of physiological exposure limit). If a drug demonstrated cytokine synergy at one or more dosing concentration within the physiological dosing limit applied, it was included in the aggregate for its hepatotoxicty class. See Figure 5 for a list (those drugs in red font) of the drugs that satisfied synergy condition using each drug’s 100*Cmax concentration limit.
The statistical significance of the observed number of synergistic drugs in the idiosyncratic hepatotoxic class was assessed using a hypergeometric test with a null hypothesis that synergistic drugs would not preferentially populate either of the hepatotoxicity groupings.
RESULTS
Several idiosyncratic hepatotoxic drugs, but not their control-paired compounds, exhibit drug-cytokine mix hepatotoxicity synergies in vitro
We developed an in vitro model of inflammation-associated idiosyncratic drug hepatotoxicity by co-administering drug compounds with known idiosyncratic hepatotoxicities in humans with a variety of inflammatory cytokines mixtures (comprised of the cytokines TNF, IFNγ, IL-1α, and IL-6, along with LPS) in multiple hepatocellular cell culture systems (primary human and rat hepatocytes and HepG2 human hepatoblastoma cells). In developing this model, we investigated drug-cytokine mix hepatotoxicity synergies for six idiosyncratic hepatotoxic drugs: ranitidine, trovafloxacin, nefazodone, nimesulide, telithromycin, and clarithromycin (a “comparison” compound for telithromycin also with idiosyncratic hepatotoxicity). For each drug compound associated with idiosyncratic hepatotoxicity, a less- or non-hepatotoxic “comparison” control compound was used. In this study, the term “comparison” compound wasapplied to drugs with similar molecular target and clinical indication and, where possible, similar chemical structure. See Table S2 for additional information on these drugs and their corresponding comparison compounds. Initially, this in vitro drug-cytokine mix co-treatment model was applied to primary rat hepatocytes and HepG2 cells treated with five pairs of drug compounds in the presence or absence of a single cytokine mix containing TNF, IFNγ, IL-1α, and LPS and assayed for LDH release as a marker of both apoptotic and necrotic cell death (Figures 1 and S1-S5). Synergistic induction of hepatocellular death was assessed by a supra-additive synergy criterion that compares the experimentally observed cell death induced by drug and cytokine co-treatment to the additive projection of cell death observed for drug-only and cytokine mix-only treatments (Figure S6).
In this co-treatment model, we observed drug-cytokine mix synergies for ranitidine but not cimetidine or famotidine (data not shown) in rat hepatocytes (but not HepG2 cells), matching similar observations in a LPS-administered rat model (Luyendyk et al., 2003). We observed drug-cytokine mix synergies for trovafloxacin but not levofloxacin in both rat hepatocytes and HepG2 cells, again matching similar observation in a LPS-administered mouse model (Shaw et al., 2007). For drugs not previously examined in LPS-administered animal models, we observed drug-cytokine mix synergies for nefazodone (but not buspirone) and clarithromycin in both rat hepatocytes and HepG2 cells, and nimesulide (but not aspirin) and telithromycin in only HepG2 cells. In this initial study, drug-cytokine mix synergies were observed only for the more idiosyncratic hepatotoxic drugs, except for clarithromycin and telithromycin, which both synergized with cytokine mix co-treatment and both have associated idiosyncratic hepatotoxicity with telithromycin having a greater incidence (see Table S2 and (Peters, 2005; Clay et al., 2006)). Drug-cytokine mix hepatotoxicity synergies were observed within 24 hr following co-treatment except for ranitidine in rat hepatocytes, which required 48 hr of co-treatment to elicit hepatotoxicity synergy, demonstrating that, at the drug and cytokine treatment concentrations used, this in vitro model captures acute, rather than chronic, hepatotoxicity responses. The delay in ranitidine-cytokine mix synergy compared to other compounds, in concert with the observation that it only occurs in rat hepatocytes and not HepG2 cells, indicates that a more prolonged mechanism (e.g. requiring significant accumulation of ranitidine metabolites) may be required to potentiate ranitidine-cytokine hepatotoxicity synergy.
Specific concentrations and time-points for each drug were selected for further investigation (see summary in Table S2) based on the criteria that the concentration induce robust supra-additive hepatotoxicity synergy with this representative cytokine mix (Figure S6) and elicit minimal drug-only hepatotoxicity. This selection criteria allowed for identification of drug concentrations within a physiologically relevant dosing limit of 100-fold its Cmax value (see Methods for additional explanation) for all cytokine-synergizing drugs except ranitidine, for which a dose of 450 μM or 317*Cmax was used.
Collection and analysis of a combinatorial drug- and cytokine mix-induced hepatotoxicity compendium from multiple hepatocyte cell systems
To characterize drug-cytokine mix synergies in a more diverse set of cytokine environments and to make comparisons across hepatocyte cell culture systems, we collected a multi-cue data compendium from all combinations of six idiosyncratic hepatotoxic drugs from the initial study -- each at one concentration and time-point -- and a DMSO control, and the 32 combinatorial mixtures of TNF, IFNγ, IL-1α, IL-6, and LPS. (Note that IL-6, not included in the initial study due to its presumed pro-survival effects (Luedde and Trautwein, 2006), was included in this combinatorial study.) Experiments were performed in rat hepatocytes, human hepatocytes, and HepG2 cells and then assayed for both LDH release and caspase 3/7 activity, a marker specific to apoptotic cell death (Figures 2 and S7-S9). The hepatotoxicity data compendium, comprised of ~1500 combinations of cell system, assay type, and drug-cytokine treatment, was observed to contain a diverse array of drug-cytokine synergy patterns not clearly interpretable by inspection alone, so we subjected it to four analytical approaches. (i) We discretized the hepatotoxicity data compendium into conditions that did or did not elicit supra-additive drug-cytokine mix synergy (Figure S11). (ii) We subjected the hepatotoxicity data compendium to factorial analysis to identify which underlying cytokine treatment factors potentiate cell death across the entire combinatorial landscape of cytokine environments (Figures S12-S15). (iii) We employed hierarchical clustering of the hepatotoxicity data compendium with respect to both drug treatments and “experimental” conditions (i.e., combinations of cell type, assay readout, and cytokine treatment; Figure 3A). (iv) We identified subsets of cytokine conditions that maximally maintained the information content of the response data (Figure 5).
Figure 2.

A drug- and cytokine mix-induced hepatotoxicity data compendium. Primary rat hepatocytes (far left), primary human hepatocytes (left center), and HepG2 cells (right center) were cultured, treated, and assayed for caspase 3/7 activity (top) or LDH release (bottom) at 24 or 48 hours post-treatment as described in Methods. In rat hepatocytes, the DMSO control and ranitidine treatment conditions at t = 48 hr are shown in expanded bar plots for both assay types (far right). Bar plot graphs for all combinations of cell type, assay type, and treatment condition are shown in Figures S7-S9. Caspase 3/7 activity and LDH release values were both fold-change normalized to DMSO/no cytokine samples from the same cell system. In the heatmaps, mean toxicity assay values of three to six biological samples are plotted using linear color-scales indexed separately to the minimum and maximum observed value for each combination of cell system and assay type. In the bar plots, data are plotted as mean ± SEM of four biological samples, with all conditions demonstrating statistically significant supra-additive drug-cytokine mix synergy labeled (*) (see Methods). The cytokine mix (TNF, IFNγ, IL-1α, and LPS) used in Figures 1 and S1-S5 is noted as “Mix”. Abbreviations: Cla, clarithromycin; Tel, telithromycin; Nef, nefazodone; Tro, trovafloxacin; Nim, nimesulide; Ran, ranitidine.
Figure 3.

Hierarchical clustering of the drug-cytokine mix hepatotoxicity compendium. (A) The drug-cytokine mix combinatorial hepatotoxicity compendium was fused across all cell systems and assay types into a single data matrix, which was then subjected to two-way Pearson clustering (top left; see Methods for additional details). First, clustering was used to re-sort a matrix of 192 “experimental” conditions, comprised of combinations of three cell systems, two assay types, and five cytokine treatment variables (top right). Second, this clustering was used re-sort to a sub-lethal hepatotoxicity data matrix of eight drug conditions and four drug (only)-induced sub-lethal hepatotoxicities (bottom). The sub-lethal hepatotoxicities (measured by quantitative imaging in primary human hepatocytes; see Figure S16) are plotted in the bottom heatmap using linear color-scales indexed separately to the minimum and maximum observed toxicity value for each assay type. (Note that the MtMP and GSH assay scales are inverted compared to Figures S16K-L.) Conditions used for the large-scale primary human hepatocyte toxicity study (see Figure 4) are noted: (1) no cytokines and (2) TNF, IL-1α, IL-6, and LPS. (B) Factorial effects ± errors of all one- and two-cytokine effects from the caspase 3/7 activity data at t = 24 hr in primary human hepatocytes for DMSO control, telithromycin, and trovafloxacin drug treatments. Statistically significant factorial effects (see Methods and Figure S12) are labeled (*). (C) Sub-lethal hepatotoxicities measured in primary human hepatocytes treated with DMSO control, telithromycin, or trovafloxacin are plotted on a normalized scale as in panel (A). Data are presented as mean ± SEM of five biological samples. For each assay type, treatments significantly different from the DMSO control are labeled as significant (*) if P < 0.05 by a Student’s t test. Abbreviations: RH, primary rat hepatocytes; HH, primary human hepatocytes; G2, HepG2 cells; Cla, clarithromycin; Tel, telithromycin; Nef, nefazodone; Tro, trovafloxacin; Nim, nimesulide; Ran, ranitidine; ROS, reactive oxygen species; MtMP, mitochondrial membrane potential; GSH, glutathione.
Figure 5.

Representative subset identification using joint entropy analysis. In panel A, subsets of cytokine co-treatments that maximally maintained the diversity of the full experimental human hepatocyte (HH) data set were identified by exhaustively scoring all possible subsets that contained the no cytokine and single-cytokine/LPS treatment conditions. The treatments contained in the highest scoring set of each size are indicated by the white boxes. Red bars represent the joint entropy of the maximally informative set. After 16–19 co-treatments are selected, additional co-treatments do not increase the joint entropy, indicating that the diversity of the full data set can be captured with a well-chosen set of 16–19 co-treatments. See Figure S18 for maximum entropy subset plots for the rat hepatocyte (RH) and HepG2 (G2) data sets. In panel B, maximally informative consensus subsets were chosen using only RH data, only G2 data, both RH and G2 data, or only HH data. The mean performance of the top 100 subsets chosen from each cell system when scored for joint entropy in the HH data is plotted, along with the mean and standard deviation joint entropy for all possible subsets for the HH data. Sets chosen based on RH and G2 data still perform well when scored against the HH data. In panel C, a single consensus set of each size was chosen from each cell system and the scored for joint entropy in the HH data. The probability of randomly choosing a subset with higher joint entropy is plotted as a function of set size. Low values indicate that it is unlikely to randomly select a set with higher information content than the evaluated set. The dashed line represents the average of all possible subsets.
From the first analysis approach, examining discretized drug-cytokine synergy classification (Figure S11), it is evident that higher-order (four- or five-factor) cytokine environments were more efficient at identifying possible drug synergies (~50% of possible synergies across combination of all cell systems and drugs) than were lower-order (one-, two-, or three-factor) environments (~15–35% of possible synergies). Of note, there are higher-order cytokine mixes other than the mix of TNF, IFNγ, IL-1α, and LPS (which was used in the initial study) that are more efficient at synergizing with these idiosyncratic drugs in human hepatocytes. This is in part due to the fact that the initial cytokine mix is mildly toxic by itself for human primary hepatocytes, limiting its ability to synergize with drug co-treatments in a supra-additive manner. Instead, slightly less-toxic five-factor mixes (in particular, the five-factor mixes that instead do not contain either TNF or IFNγ [the latter noted as “2” in Figure S11A]) are far more efficient at eliciting supra-additive hepatotoxicity synergies with these six idiosyncratic drugs in human hepatocytes, and therefore would likely serve as a more predictive cytokine environment for assessing drug-cytokine synergies in human hepatocytes.
In the second analysis approach, we applied factorial analysis to the hepatotoxicity data compendium to identify underlying cytokine effects potentiating drug-cytokine hepatotoxicity synergies across the entire landscape of cytokine environments (Figures S12-S15). As implemented here, factorial analysis calculates the effect of the addition or removal of component treatment “variables”, each containing one-to-four cytokines and/or LPS, from all treatment conditions in which they are present or absent, and, as such, summarizes the average effect of each cytokine treatment “variable” within the context of all other cytokine co-treatment conditions (Box et al., 1978). Higher-order factorial effects (those containing more than two cytokine variables) were generally modest, and, instead, one- and two-cytokine factorial effects dominated the observed drug- and cytokine mix-induced hepatotoxicities. The most significant effects, across all cell types and drug co-treatments, arose from the single-cytokine treatment variables of TNF and, to a lesser extent, IL-1α and LPS (see Supplemental Methods and Results for additional discussion). The identification via factorial analysis of TNF as a potentially important cytokine mediator of the inflammation-associated hepatotoxicity of multiple idiosyncratic drugs is in agreement with reports that TNF mediates the LPS-induced hepatotoxicity of both ranitidine (Tukov et al., 2007) and trovafloxacin (Shaw et al., 2007; Shaw et al., 2009).
Clustering of the drug-cytokine mix hepatotoxicity compendium to assess hepatotoxicity patterns with respect to cell system, assay type, and drug-induced hepatocellular injuries
Factorial analysis of the hepatotoxicity data compendium suggested a significant degree of variability in cytokine factors potentiating idiosyncratic drug hepatotoxicity synergies in different drug backgrounds and cell systems. To further assess these differences, we fused the hepatotoxicity data compendium into a single data matrix of 192 “experimental” conditions (comprised of all combinations of three cell systems, two assay types, and five cytokine/LPS treatment variables) by eight “drug” conditions (six idiosyncratic drugs and two DMSO controls). This hepatotoxicity data matrix was subjected to two-way hierarchical clustering to assess patterns of drug-cytokine mix synergies across both the 192 experimental conditions and the 8 drug or DMSO backgrounds (Figure 3). Pearson clustering yielded the most distinct separation with respect to assay readouts due to the fact that they are poorly correlated (R = 0.18) across the entire data set. A second notable grouping was that of the different cell types, with large sections of each assay type cluster consisting solely of the conditions from each cell system, showing that there was little overlap between the three hepatocyte cell systems. Inspection within the LDH and caspase data clusters revealed that neither rat hepatocytes nor HepG2 cells were distinctly better correlated with human hepatocytes in this data compendium.
It has been proposed that a conserved mechanism of inflammation-associated idiosyncratic toxicity is that sub-lethal hepatocellular injuries induced by idiosyncratic drugs and/or their metabolites sensitize hepatocytes to undergo cytokine-stimulated cell death (Kaplowitz, 2005). We hypothesized that there might exist correlations between the patterns of drug-cytokine mix lethal hepatotoxicities and a set of four sub-lethal hepatocyte injury measurements for the six idiosyncratic drugs in this study. Drug-induced sub-lethal hepatocyte injuries were measured in human hepatocytes, in the absence of any cytokines, using a high-throughput live-cell microscopy approach (Xu et al., 2008), which quantifies lipid content, reactive oxygen species (ROS), mitochondrial membrane potential (MtMP), and glutathione (GSH) depletion (Figure S16). It was difficult to discern clear correlations between sub-lethal injuries (measured in human hepatocytes) and cytokine synergy clustering patterns (across all three hepatocyte systems) for nimesulide, clarithromycin, and nefazodone due to the numerous sub-lethal hepatotoxicities induced by these drugs (Figure 3A), and thus synergy correlations possibly reflect the convolution of multiple sub-lethal injury-cytokine synergy mechanisms. In contrast, the only sub-lethal injury induced by both telithromycin and trovafloxacin that was statistically significant was MtMP depletion (Figures 4C and S16). In human hepatocytes, telithromycin and trovafloxacin elicited markedly similar patterns of cytokine synergy as assayed by caspase 3/7 activity and represented through factorial analysis (Figure 3B). For both drugs, cytokine synergy effects were evident, in decreasing magnitude, for LPS and IL-1α but not other treatment variables. This pattern of cytokine synergy effects was not shared by any other drugs at 24 hours post-treatment in human hepatocytes (Figure S14). This unique and specific sub-lethal injury-cytokine synergy relationship suggests that drug-induced mitochondrial injury may sensitize hepatocytes to apoptosis induced by LPS and IL-1α, as has been similarly hypothesized for alcoholic hepatitis-induced mitochondrial injury in hepatocytes (Hoek and Pastorino, 2002).
Figure 4.

Large-scale drug-cytokine mix hepatotoxicity study in primary human hepatocytes demonstrates the utility of cytokine co-treatment approach for identifying idiosyncratic hepatotoxic drugs. Primary human hepatocytes were cultured, treated, and assayed for LDH release (at 24 hours post-treatment) as described in Methods. Ninety drugs (see Table S3) were each dosed at seven non-zero concentrations (2.5× serial dilutions from a high concentration of 150 μM) in the presence or absence of a cytokine mix containing TNF, IL-1α, IL-6, and LPS. The differential between + and - cytokine mix co-treatment for each drug dose was calculated and is plotted in the heatmaps (see Figure S17 for raw data and additional details). The heatmaps are split into hepatotoxic (DILI classes P1, O1, and P2; left) and not or minimally hepatotoxic (DILI classes O2, N3, N2, and N1; right) drug groups, with these DILI classes sorted in order of decreasing hepatotoxicity (see Tables 1 and S1 for additional details). Note that DILI class P2 is substantially comprised of drugs with idiosyncratic hepatotoxicities in humans. Within each DILI class, drugs are sorted in order of 100*Cmax value (a physiologically relevant dosing limit). Drug 100*Cmax values are plotted in an overlayed line plot, with values exceeding 150 μM not shown. Individual drug doses that exhibited supra-additive drug-cytokine mix synergy (see Methods and Table 1) at concentrations less than their drug’s 100*Cmax limit are highlighted with gray boxes. Drugs with one or more dose exhibiting drug-cytokine mix supra-additive toxicity synergy at less than their 100*Cmax concentration are listed in red font. A representative DILI P2 drug (chlorpromazine) displaying drug-cytokine mix synergy at dosing concentrations less than 100*Cmax is shown in the expanded plot at the bottom right (data presented mean ± SEM of two biological samples). TPCA-1, a small molecule IKK inhibitor (IKKi), was used (at ten-fold lower concentrations than are noted by the axis labels for the other drugs) as a positive control for drug-cytokine mix synergy, but is not labeled in red as its Cmax is unknown.
Large-scale screen in primary human hepatocytes demonstrates the utility of cytokine co-treatment synergy model as a tool for identifying idiosyncratic hepatotoxic drugs
To test the drug-cytokine mix hepatotoxicity synergy model as a screening tool for identifying inflammation-associated idiosyncratic drug hepatotoxicity, we assayed drug-cytokine mix synergy for 90 drugs in human hepatocytes. This set of 90 drugs included 53 hepatotoxic drugs from DILI classes P1, O1, and P2 and 36 non-hepatotoxic drugs from DILI classes O2, N3, N2, and N1 (see Tables S1 and S3 for additional details). DILI class P2 is substantially comprised of drugs with idiosyncratic hepatotoxicities in humans and therefore assumed for analysis purposes here and previously (Xu et al., 2008) to represent idiosyncratic drugs. The non-hepatotoxic group (DILI O2, N3-N1) is used to provide corresponding non-toxic control compounds, although we note that the idiosyncratic drugs clarithromycin and ranitidine used in the initial study here are in DILI classes N1 and N3, respectively. In this 90-drug screen, comparisons were made by examining the differences between the idiosyncratic group (DILI P2) and the non-hepatotoxic group as not all idiosyncratic drugs could be individually paired with “comparison” control drugs.
Due to practical limitations in conducting medium-to-high-throughput screens in primary human hepatocytes, we assessed drug-cytokine mix synergy only for a single cytokine mix (TNF, IL-1α, IL-6, and LPS), which was equally effective at inducing hepatotoxicity synergies across the six idiosyncratic drugs as the full set of cytokine mixes in the initial drug-cytokine mix data compendium (see Figure S11A, mix noted as “2”). Human hepatocytes were treated with one of 90 drugs, each dosed between 0 and 150 μM, in the presence or absence of TNF, IL-1α, IL-6, and LPS and assayed for LDH release at 24 hr post-treatment (Figures 4 and S17). Supra-additive drug-cytokine synergy was assessed with regards to two different methods of defining a physiologically relevant dosing limit: (i) using each drug’s own 100*Cmax concentration, or (ii) using multiples (33× or 100×) of the median Cmax concentration for all drugs in this study (0.91 μM) as an general estimate of physiological exposure limit, which may be a necessary approximation if clinical human pharmacokinetic data is unavailable.
For doses less than each drug’s own 100*Cmax concentration, drug-cytokine mix synergy was observed for the P1 compounds benzbromarone, demeclocycline, azathioprine, amiodarone, retinoic acid; the O1 compound menadione; the P2 compounds trovafloxacin, diclofenac, quinine, chlorpromazine, riluzole, mexiletine, clomipramine, nortriptyline; and the N1 compound clarithromycin (which has reported idiosyncratic hepatotoxicity in humans (Peters, 2005; Clay et al., 2006) and was used as a test idiosyncratic hepatotoxicant in the initial study here). Among these cytokine mix synergy compounds, three of the six overtly hepatotoxic drugs (P1 compounds benzbromarone and azathioprine and the O1 compound menadione) and two of the eight idiosyncratic hepatotoxic drugs (P2 compounds quinine and chlorpromazine) also induced significant drug-only hepatotoxicity at doses less than each drug’s own 100*Cmax concentration (Figure S17 and data not shown). In this data set, drug-only hepatotoxicity was defined as greater than two-fold increase in LDH release. Using this approach to physiological concentration limit, a significantly larger fraction of the idiosyncratic hepatotoxic drugs (8 of 43 = 19%) demonstrated hepatotoxicity synergy with the cytokine mix than did the non-hepatotoxic drugs (1 of 36 = 3%; see Table 1). In contrast, using 100-fold the median Cmax concentration (91 μM) as an general estimate of physiologically relevant dosing limit, the idiosyncratic hepatotoxic drugs (9 of 43 = 21%) did not elicit more frequent hepatotoxicity synergy then the non-hepatotoxic drugs (7 of 36 = 19%). But in using 33-fold the median Cmax concentration (30 μM), the idiosyncratic hepatotoxic drugs (7 of 43 = 16%) did elicit more frequent hepatotoxicity synergy then the non-hepatotoxic drugs (0 of 36 = 0%).
This demonstrates that synergistic induction of hepatotoxicity with a cytokine mix, even when limited to a single hepatocyte cell system and cytokine mix, can be utilized as a screening tool for evaluating inflammation-associated idiosyncratic drug hepatotoxicity. As implemented here, optimized assessment requires knowledge of the drug’s Cmaxvalue, which necessitates human clinical pharmacokinetic data, but a reduced set of idiosyncrasies can be reproduced with a more conservative estimate of liver exposure (33*Cmax) based on a generalized Cmax estimate calculated from many drugs. Moreover, idiosyncratic hepatotoxic drugs (P2 compounds) largely induce drug-cytokine mix synergies in the absence of drug-only hepatotoxicities, which are more often evident for synergizing drugs that are associated with overt hepatotoxicity. This dependency on Cmax to optimally calibrate the drug-cytokine mix synergy model to distinguish between drugs with idiosyncratic hepatotoxicity and those with either no or overt hepatotoxicity is in concert with Paracelsus’ concept that “exposure makes a poison”.
Joint entropy analysis identifies informative cytokine environments in rat hepatocytes and HepG2 cells for characterizing human hepatocyte drug-cytokine mix death synergies
The poor correlation in drug-cytokine hepatotoxicity patterns between all three hepatocytic cell types (Figure 3) indicated it would be difficult to make accurate predictions of drug- and cytokine-induced hepatotoxicities in primary human hepatocytes from primary rat hepatocyte and/or HepG2 data. To examine this further, we asked whether a subset of the 32 cytokine conditions present in the drug-cytokine mix data compendium could be identified that maintained the diversity of the hepatotoxicity responses present in the full set of experiments. Such a subset could prove useful for motivating future experiments in a more compact experimental scope. To quantify the information content of a set of cytokine co-treatments, we computed the joint entropy of all drug hepatotoxicity responses across both assays and in all three cell systems using Maximum Information Spanning Trees, a framework for approximating high-dimensional information theoretic statistics with limited sample sizes (King and Tidor, 2009). This joint entropy metric quantifies the diversity of hepatotoxicity responses across the entire data compendium, accounting for relationships between drugs, assays, and cell systems. We assessed the information content of all possible subsets of cytokine co-treatments using the joint entropy metric, and selected the highest scoring subset of each size (Figure 5A) in the human hepatocyte data set, as well as a consensus set that considered the 100 most information-rich subsets of each size (data not shown). This analysis identified subsets containing 16–19 cytokine co-treatments with comparable information content (91–99%) to the full set of 32. The consensus subsets, while not as information-rich, also had similar information content to the full set (89–98%).
While the above results suggest that the number of conditions used could be reduced by as much as half while maintaining much of the information content, the selection scheme relied upon knowledge of the full data set. While primary human hepatocytes are considered to be the cell system with most predictive of human hepatotoxicity (Gomez-Lechon et al., 2003; LeCluyse et al., 2005), they are also less amenable to high-throughput investigation due to their higher cost and lower availability. We therefore asked whether a compact subset of highly informative treatment conditions for human hepatocyte studies could be identified using only the experimental data from primary rat hepatocytes and HepG2 cells. We repeated the joint entropy analysis described above using data from (i) only HepG2 cells, (ii) only rat hepatocytes, or (iii) both rat hepatocytes and HepG2 cells (Figure S18). We then evaluated the treatment subsets chosen from each data set by their joint entropy in the human hepatocyte data (Figures 5B-C). While the sets chosen without the human hepatocyte data were less informative than the optimal sets (e.g. 95% of the total possible entropy for the optimal 16-treatment set compared to 90% using a 16-treatment set chosen by rat hepatocyte and HepG2 data), they still performed significantly better than randomly chosen sets (which averaged 77% of the total possible entropy for 16-treatment sets). Additionally, the sets chosen using both the rat hepatocytes and HepG2 data generally outperformed sets chosen using either data set alone, suggesting that both cell systems were separately informative of the human hepatocyte hepatotoxicity observations. The results demonstrate that reduced-condition treatment sets can be identified from exhaustive data sets collected in cell systems more amenable to high-throughput investigations (rat hepatocytes and HepG2 cells) for more focused, but still fully informative, experiments in higher-cost systems (human hepatocytes).
Maximum entropy sets act as better training sets for partial least squares regression models of drug- and cytokine-induced toxicity in primary human hepatocytes
To examine the utility of the maximum entropy sets described above, we used them as a basis for training a predictive model. We took the approach of building statistical regression models to predict the drug- and cytokine mix-induced hepatotoxicity responses in human hepatocytes, based upon the analogous measurements in the rat hepatocyte and HepG2 cell systems. For each drug and hepatotoxicity assay, we built a partial least-squares (PLS) regression model that predicted the hepatotoxicity responses in human hepatocytes based upon training data from rat hepatocytes and/or HepG2 cells. We built the models using two different sets of inputs that reflect different experimental modalities. In one case (“single drug”), when building a model of the response of a given drug across the various cytokine backgrounds in human hepatocytes, we used as training data only the response to the same drug in both other cell systems and both assays. In a second case (“all drugs”), the response profiles of all drugs were used to predict each individual drug response. To evaluate the predictive performance of these PLS models, a subset of the cytokine conditions containing 25 cytokine conditions (training set) were used to train the model, and the trained model was then used to predict the response in the remaining 7 cytokine conditions (test set). These set sizes showed the best predictive performance as well as the most improvement using maximum entropy-selected sets compared to random sets (see Figure S19). As a comparison, we chose 1000 sets of each size at random and trained models from these sets, with the mean performance across all drug responses reported.
We examined whether the information-rich maximum entropy sets would act as better training sets when learning the PLS models. All maximum entropy consensus sets had higher mean correlation between predictions and observed values than the randomly chosen sets (Figure 6, Table S4). Importantly, the consensus sets identified using the data from HepG2 cells or both rat hepatocytes and HepG2 cells both lead to PLS models that performed much better than randomly-selected subsets. Additionally, the models trained using all of the drug data consistently outperformed the single drug models, suggesting that parallel drugs studies may prove useful in predicting the behavior of individual drugs. These modeling results show that, in addition to the identity of information-rich cytokine treatment conditions being transferable across cell systems, the subsets themselves can also act as superior training sets for predicting hepatotoxicity responses in unmeasured conditions.
Figure 6.
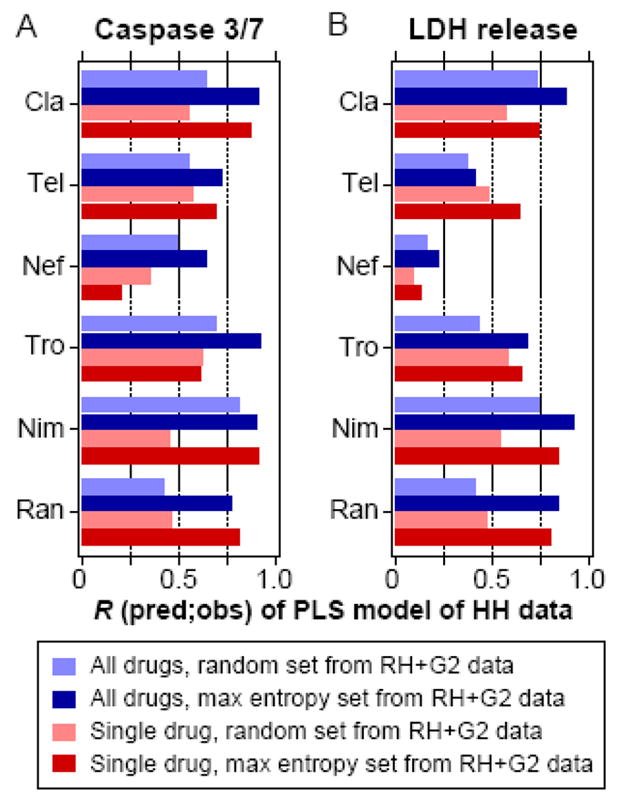
Predictive performance of partial least-squares (PLS) models trained on consensus maximum entropy sets and evaluated across cell systems. PLS regression models were built using specific cytokine condition sets containing 25 of the 32 possible cytokine treatments, selected based on data from rat hepatocytes (RH) and HepG2 cells (G2). They were evaluated for their ability to predict responses of the 7 remaining cytokine treatment conditions observed in human hepatocytes (HH). Pearson correlations (R) between the observed and predicted responses in HH of both the caspase 3/7 activity (panel A) and LDH release (panel B) responses are shown. Cytokine condition sets selected from RH and G2 data were chosen using either the consensus maximum entropy treatment sets or random treatment sets, of which the mean performance of 1000 random treatment sets is plotted, and these conditions sets were selected and evaluated using data from either all six drugs or single drugs. Abbreviations: Cla, clarithromycin; Tel, telithromycin; Nef, nefazodone; Tro, trovafloxacin; Nim, nimesulide; Ran, ranitidine.
DISCUSSION
Hepatotoxicity is a major cause of failures in both the clinical and post-approval stages of drug development and thus represents a major challenge for the pharmaceutical industry (Kaplowitz, 2001; Lee, 2003). Furthermore, drug hepatotoxicity represents a serious public health problem, as it is the leading cause of acute liver failure in the United States (Ostapowicz et al., 2002). Idiosyncratic drug hepatotoxicity -- a hepatotoxicity subset that occurs in a very small fraction of human patients (~1 in 10,000) and accounts for ~10% of acute liver failure cases -- is poorly predicted by standard preclinical models and in clinical trials and frequently leads to post-approval drug failure (Kaplowitz, 2005). Thus, the development and validation of novel preclinical tools that demonstrate successful identification of idiosyncratic drug hepatotoxicity is a paramount need for the pharmaceutical industry and the public health. Recent findings in LPS-administered rodent models suggest that idiosyncratic drug hepatotoxicity can arise when mild drug-induced hepatocellular stresses synergize with inflammatory cytokine signaling to elicit hepatocellular death, but these models lack sufficient throughput for preclinical hepatotoxicity screening (Ganey et al., 2004; Kaplowitz, 2005).
In this work, we developed and evaluated in vitro hepatocyte cell culture models of idiosyncratic drug hepatotoxicity, which are more suitable to the high-throughput demands of preclinical pharmaceutical screening. In our cell culture model, synergistic induction of hepatocellular death by drugs and inflammatory cytokines is used to reproduce known idiosyncratic drug hepatotoxicities. The in vitro cytokine synergy model developed herein and other complementary cell culture (Xu et al., 2008) and animal models (Buchweitz et al., 2002; Luyendyk et al., 2003; Shaw et al., 2007) offer much-needed preclinical tools for the assessment and prediction of idiosyncratic drug hepatotoxicity. This cytokine synergy model would be most useful simply for its ability to identify candidate idiosyncratic hepatotoxicity phenomenologies. Identification of candidate idiosyncratic hepatotoxicants in cell culture allows for more detailed follow-up experiments to parse the mechanisms of particular candidate idiosyncratic hepatotoxicants to help guide drug compound development. We focused the development of our cell culture model on the simple case of static, simultaneous drug-cytokine mix co-exposure over an acute time scale (24–48 hr). Cell culture models more consistent with idiosyncratic drug hepatotoxicity physiology would need to include the relative dynamics of both drug and cytokine exposure. Clinically, drug exposure can be quite cyclical (i.e., oscillating between Cmax and Cmin for a repeatedly administered drug at a pre-defined dosing interval). While cytokine exposure can be static (due to, for example, a pre-existing inflammatory event), cytokine levels can also be highly cyclical, especially in the case of hepatotoxicant-induced inflammation (Horn et al., 2000; Ganey et al., 2004).
We demonstrated that numerous idiosyncratic hepatotoxic drugs, but not comparison non-toxic control compounds, synergistically induce death in multiple hepatocyte cell systems when co-administered with multi-cytokine mixes associated with LPS-induced liver inflammation (Figure 1). In primary rat and human hepatocyte cultures in particular, drug-cytokine mix synergies were most frequently observed for higher-order (containing four or five cytokines or LPS) cytokine mixes (Figure S11), whose hepatotoxicity was potentiated in a drug- and cell system-specific manner by the additive combination of the single-factor effects of TNF, IL-1α, and/or LPS (Figure S12). Our results demonstrate that LPS itself can amplify drug hepatotoxicity, but this effect is predominantly observed when LPS is co-administered with other cytokines in the presence of multi-cytokine mixes (Figure S11A). When LPS was administered in the absence of other cytokines (mirroring in vivo studies when LPS is administered upon inhibition or removal of Kupffer cells), it yielded very infrequent drug synergies. Together, these observations confirm that other cytokines are necessary for LPS to have an effect in inducing hepatotoxicity in combination with idiosyncratic hepatotoxicants). This agrees with previous reports (Shaw et al., 2007; Tukov et al., 2007) that Kupffer cell-mediated cytokine release is necessary for LPS-induced hepatotoxicity in combination with idiosyncratic hepatotoxicants in animal models. Potentiation of drug-cytokine synergy by TNF, IL-1α, and LPS, more so than by IFNγ or IL-6, suggests that signal transduction pathways that are similarly downstream of the cytokine receptors TNFR and IL-1R and the LPS receptor TLR4 (Liu et al., 2002), such as IKK–NF-κB, p38 (Deng et al., 2008), and JNK (Wu and Cederbaum, 2008), are likely critical components of hepatocellular toxicity responses to idiosyncratic drug-inflammatory cytokine co-exposure.
Idiosyncratic hepatotoxicants are hypothesized to induce a diversity of sub-lethal injuries that sensitize hepatocytes to inflammatory cytokine-induced cell death (Kaplowitz, 2005). This hypothesis is supported by the demonstration that acetaminophen (APAP), at high doses, can elicit an idiosyncratic-like hepatotoxicity that is dependent on cytokine signaling as part of the innate immune response (Kaplowitz, 2005). At high doses, accumulation of a cytochrome P450-dependent APAP metabolite leads to depletion of GSH in hepatocytes, which is known to sensitize hepatocytes to TNF-induced apoptosis (Mari et al., 2008). In limiting our analysis to hepatotoxicants that induced only a single type of sub-lethal injury, we found clear correlations between injury mechanism and hepatotoxicity effects by different cytokine treatment variables via factorial analysis. In human hepatocytes, telithromycin and trovafloxacin both induced only one type of sub-lethal injury, mitochondrial membrane potential depletion (Figures 3C and S16) and elicited markedly similar patterns of cytokine synergy as assayed by caspase 3/7 activity and represented through factorial analysis that were not shared by other drug treatments (Figure S16). This unique and specific relationship between drug-induced injury and drug-cytokine synergy suggests that drug-induced mitochondrial injury may sensitize hepatocytes to apoptosis induced by LPS and IL-1α, as has been similarly hypothesized for alcoholic hepatitis-induced mitochondrial injury in hepatocytes (Hoek and Pastorino, 2002), but not TNF. Alternatively, idiosyncratic drug hepatotoxicity could arise when idiosyncratic hepatotoxicant-induced stresses amplify the hepatotoxic effects of pre-existing inflammatory cytokine signaling. Our findings do not distinguish between these hypothesized mechanisms. Instead they simply demonstrate that co-exposure of idiosyncratic hepatotoxicants and inflammatory cytokines frequently leads to the synergistic amplification of mild hepatotoxicities caused by each. Further investigation is necessary to clarify the mechanisms of inflammation-associated idiosyncratic drug hepatotoxicity both generally and for specific drugs.
The cytokine mix-specific responses evident in the hepatotoxicity data compendium collected here (Figures 2 and S11) suggest that inflammation-associated idiosyncratic drug hepatotoxicities might be avoided by limiting drug treatments to patients that do not have plasma cytokine signatures (due to pre-existing inflammatory episodes, for example) corresponding to known synergizing inflammatory environments. Further investigation of drug-cytokine mix synergies over across greater number of drug compounds and cytokine environments, beyond those associated with LPS-induced inflammation, would have to be conducted to more thoroughly capture the diversity of patient-specific drug-cytokine interactions in humans. This suggestion of “personalized” or “stratified” drug treatment (Trusheim et al., 2007) to avoid toxicity would likely be necessitated only for drugs for which comparably efficacious compounds are not available and could be combined with pharmaco-metabolonomic phenotyping approaches (Clayton et al., 2006) to avoid both inflammation- and metabolism-associated idiosyncratic hepatotoxicities in a patient-specific manner.
In a 90-drug screen in human hepatocytes, ~20% of idiosyncratic hepatotoxicants (those compounds associated with DILI category P2; see Table S1) elicited hepatocellular death synergy with a cytokine mix compared to only 3% of non-hepatotoxic drugs when using each drug’s 100*Cmax concentration as a physiological dosing limit (Figure 4). Using a generalized physiological dosing limit of 30 μM (based on 33-fold the median Cmax concentration across all drugs in the study), ~15% of idiosyncratic hepatotoxicants and none of non-hepatotoxic drugs elicited synergy. This demonstrates that, given drug pharmacokinetic parameters to define a physiologically relevant dosing window (ideally individually defined for each drug), in vitro drug-cytokine hepatocellular death synergy can be utilized as a much-needed preclinicaltool for identifying potential inflammation-associated idiosyncratic hepatotoxicants with reasonable throughput. As conducted here, identification of inflammation-associated idiosyncratic drug hepatotoxicity based on in vitro hepatocellular models depends on human pharmacokinetic data and would be most reasonably used within an iterative preclinical-clinical toxicity assessment paradigm. Furthermore, this work demonstrates the utility of a physiologically relevant drug dosing limit of 100*Cmax to obtain a low false-positive rate, as many non-hepatotoxic drugs synergistically induced human hepatocyte death at concentrations exceeding 100*Cmax (see Table 1).
At least for a subset of six drugs, this study demonstrates that, in addition to human hepatocytes, both rat hepatocytes and HepG2 cells can be useful hepatocellular systems for reproducing inflammation-associated idiosyncratic drug hepatotoxicities. This unexpected success in using hepatocellular systems more amenable to high-throughput screening suggests that cytokine mix synergy screens may be implemented for preclinical drug evaluation, but the utility of these cell systems may be limited to drugs whose toxicity is not dependent on in vivo-like metabolite formation. Moreover, we demonstrate an information theoretic approach that can identify particularly informative subsets of cytokine treatments in rat hepatocytes and HepG2 that are not only equivalently informative of larger data sets in human hepatocytes, but also are highly effective at training PLS regression models to predict drug- and cytokine mix-induced hepatotoxicities across these cell systems (Figures 5 and 6). The utility of rat hepatocytes and HepG2 cells for screening inflammation-associated idiosyncratic drug hepatotoxicity will need to be evaluated for a greater diversity drug compounds to generate more confidence in their accuracy.
This work suggests numerous improvements in the further development of high-throughput cell culture models used to predict inflammation-associated idiosyncratic drug hepatotoxicity. In the large-scale screen conducted here (Figure 4), the limited number of cytokine synergies with idiosyncratic hepatotoxicants (8 of 43 = 19%) was likely due to the use of only one cytokine environment and one hepatocyte cell system and the fact that not all DILI P2 drugs have idiosyncratic hepatotoxicities associated with inflammation. Increases in identification accuracy could be obtained using a multi-variate predictive model (Xu et al., 2008) calibrated from expanded measurements of drug-cytokine synergies at multiple doses (up to the 100*Cmax limit) across multiple hepatocyte cell systems, additional cytokine environments, and/or toxicity assays, which all were limited in the 90-drug screen here. Additionally, hepatocyte cell culture models, such as three-dimensional microreactor cultures using primary rat hepatocytes, that better maintain hepatic drug metabolism and biliary transport characteristics over a chronic time-scale (more than 7 days) and are scalable to medium-throughput screening demands (Domansky et al., 2005; Sivaraman et al., 2005; Hwa et al., 2007) could be utilized to develop more physiologically relevant models of inflammation-associated idiosyncratic drug hepatotoxicity. These systems could better capture the mix of chronic and acute hepatocyte responses to drugs and inflammatory cytokines (Ganey et al., 2004) and, moreover, could be used to recapitulate the cyclic changes in both drug and cytokine levels in a well-controlled manner, which were not examined in this study.
Nonetheless, the work presented here validates the use of synergistic induction of hepatocellular death by idiosyncratic hepatotoxicants and an inflammatory cytokine environment as a much-needed in vitro tool for assessing inflammation-associated idiosyncratic drug hepatotoxicity and provides a framework for further development of such in vitro models to capture a greater complexity of and to elucidate the mechanistic basis of inflammation-associated idiosyncratic drug hepatotoxicity.
Acknowledgments
The authors thank Arthur Smith and Margaret Dunn for assistance in conducting hepatotoxicity imaging assays and David de Graaf, Steve Tannenbaum, Ajit Dash, Walker Inman, Justin Pritchard, and Brian Joughin for helpful discussions. The authors acknowledge funding support from Pfizer Inc., the MIT Center for Cell Decision Processes (NIH grant P50-GM68762; D.A.L., P.K.S.), the MIT Biotechnology Process Engineering Center (L.G.G.), the MIT Center for Environmental Health Sciences (NIH grant U19ES011399; L.G.G.), a NIH/NIGMS Biotechnology Training Program Fellowship (NIH grant T32-GM008334; B.M.K.), and a Whitaker Foundation Graduate Fellowship (B.D.C.).
Abbreviations
- APAP
acetaminophen
- Cmax
average plasma maximum drug concentration
- CM-H2DCFDA
5-(and-6)-chloromethyl-2′7′-dichlorodihydrofluorescein diacetate acetyl ester
- TMRM
tetramethyl rhodamine ester
- DILI
drug-induced liver injury
- DRAQ5
1,5-bis{[2-(di-methylamino)ethyl]amino}-4,8-dihydroxyanthracene-9,10-dione
- GSH
glutathione
- HGM
hepatocyte growth medium
- IFNγ
interferon-γ
- IKK
inhibitor of NF-κB kinase
- IL
interleukin
- LDH
lactate dehydrogenase
- LPS
lipopolysaccharide
- mBCl
monochlorobimane
- MtMP
mitochondrial membrane potential
- NF-κB
nuclear factor-κB
- NSAID
non-steroidal anti-inflammatory drug
- PLS
partial least-squares
- p38
p38 mitogen-activated protein kinase
- ROS
reactive oxygen species
- SEM
standard error of the mean
- STAT
signal transducer and activator of transcription
- TNF
tumor necrosis factor-α
Footnotes
Conflict of interest statement
B.S.H. is employed by and holds stock in Pfizer. J.J.X. was a past employee of Pfizer, is employed by Merck & Co., and owns stock in Pfizer, Merck & Co., and other biopharmaceutical companies.
Animal experimentation statement
All animals received humane care according to the criteria outlined in the “Guide for the Care and Use of Laboratory Animals” prepared by the National Academy of Sciences and published by the National Institutes of Health (NIH publication 86-23).
Publisher's Disclaimer: This is a PDF file of an unedited manuscript that has been accepted for publication. As a service to our customers we are providing this early version of the manuscript. The manuscript will undergo copyediting, typesetting, and review of the resulting proof before it is published in its final citable form. Please note that during the production process errors may be discovered which could affect the content, and all legal disclaimers that apply to the journal pertain.
References
- Bellezzo JM, Britton RS, Bacon BR, Fox ES. LPS-mediated NF-kappa beta activation in rat Kupffer cells can be induced independently of CD14. Am J Physiol. 1996;270:G956–961. doi: 10.1152/ajpgi.1996.270.6.G956. [DOI] [PubMed] [Google Scholar]
- Bergheim I, Luyendyk JP, Steele C, Russell GK, Guo L, Roth RA, Arteel GE. Metformin prevents endotoxin-induced liver injury after partial hepatectomy. J Pharmacol Exp Ther. 2006;316:1053–1061. doi: 10.1124/jpet.105.092122. [DOI] [PubMed] [Google Scholar]
- Box GEP, Hunter WG, Hunter JS. Statistics for experimenters. Wiley; New York: 1978. [Google Scholar]
- Buchweitz JP, Ganey PE, Bursian SJ, Roth RA. Underlying endotoxemia augments toxic responses to chlorpromazine: is there a relationship to drug idiosyncrasy? J Pharmacol Exp Ther. 2002;300:460–467. doi: 10.1124/jpet.300.2.460. [DOI] [PubMed] [Google Scholar]
- Clay KD, Hanson JS, Pope SD, Rissmiller RW, Purdum PP, 3rd, Banks PM. Brief communication: severe hepatotoxicity of telithromycin: three case reports and literature review. Ann Intern Med. 2006;144:415–420. doi: 10.7326/0003-4819-144-6-200503210-00121. [DOI] [PubMed] [Google Scholar]
- Clayton TA, Lindon JC, Cloarec O, Antti H, Charuel C, Hanton G, Provost JP, Le Net JL, Baker D, Walley RJ, Everett JR, Nicholson JK. Pharmaco-metabonomic phenotyping and personalized drug treatment. Nature. 2006;440:1073–1077. doi: 10.1038/nature04648. [DOI] [PubMed] [Google Scholar]
- Cosgrove BD, Cheng C, Pritchard JR, Stolz DB, Lauffenburger DA, Griffith LG. An inducible autocrine cascade regulates rat hepatocyte proliferation and apoptosis responses to tumor necrosis factor-alpha. Hepatology. 2008;48:276–288. doi: 10.1002/hep.22335. [DOI] [PMC free article] [PubMed] [Google Scholar]
- Deng X, Lu J, Lehman-McKeeman LD, Malle E, Crandall DL, Ganey PE, Roth RA. p38 mitogen-activated protein kinase-dependent tumor necrosis factor-alpha-converting enzyme is important for liver injury in hepatotoxic interaction between lipopolysaccharide and ranitidine. J Pharmacol Exp Ther. 2008;326:144–152. doi: 10.1124/jpet.108.137497. [DOI] [PMC free article] [PubMed] [Google Scholar]
- Deng X, Stachlewitz RF, Liguori MJ, Blomme EA, Waring JF, Luyendyk JP, Maddox JF, Ganey PE, Roth RA. Modest inflammation enhances diclofenac hepatotoxicity in rats: role of neutrophils and bacterial translocation. J Pharmacol Exp Ther. 2006;319:1191–1199. doi: 10.1124/jpet.106.110247. [DOI] [PubMed] [Google Scholar]
- Domansky K, Inman W, Serdy J, Griffith L. Perfused microreactors for liver tissue engineering. Conf Proc IEEE Eng Med Biol Soc. 2005;7:7490–7492. doi: 10.1109/IEMBS.2005.1616244. [DOI] [PubMed] [Google Scholar]
- Ganey PE, Luyendyk JP, Maddox JF, Roth RA. Adverse hepatic drug reactions: inflammatory episodes as consequence and contributor. Chem Biol Interact. 2004;150:35–51. doi: 10.1016/j.cbi.2004.09.002. [DOI] [PubMed] [Google Scholar]
- Geller DA, Nussler AK, Di Silvio M, Lowenstein CJ, Shapiro RA, Wang SC, Simmons RL, Billiar TR. Cytokines, endotoxin, and glucocorticoids regulate the expression of inducible nitric oxide synthase in hepatocytes. Proc Natl Acad Sci U S A. 1993;90:522–526. doi: 10.1073/pnas.90.2.522. [DOI] [PMC free article] [PubMed] [Google Scholar]
- Gomez-Lechon MJ, Donato MT, Castell JV, Jover R. Human hepatocytes as a tool for studying toxicity and drug metabolism. Curr Drug Metab. 2003;4:292–312. doi: 10.2174/1389200033489424. [DOI] [PubMed] [Google Scholar]
- Hewitt NJ, Lechon MJ, Houston JB, Hallifax D, Brown HS, Maurel P, Kenna JG, Gustavsson L, Lohmann C, Skonberg C, Guillouzo A, Tuschl G, Li AP, LeCluyse E, Groothuis GM, Hengstler JG. Primary hepatocytes: current understanding of the regulation of metabolic enzymes and transporter proteins, and pharmaceutical practice for the use of hepatocytes in metabolism, enzyme induction, transporter, clearance, and hepatotoxicity studies. Drug Metab Rev. 2007;39:159–234. doi: 10.1080/03602530601093489. [DOI] [PubMed] [Google Scholar]
- Hoek JB, Pastorino JG. Ethanol, oxidative stress, and cytokine-induced liver cell injury. Alcohol. 2002;27:63–68. doi: 10.1016/s0741-8329(02)00215-x. [DOI] [PubMed] [Google Scholar]
- Horn TL, O’Brien TD, Schook LB, Rutherford MS. Acute hepatotoxicant exposure induces TNFR-mediated hepatic injury and cytokine/apoptotic gene expression. Toxicol Sci. 2000;54:262–273. doi: 10.1093/toxsci/54.1.262. [DOI] [PubMed] [Google Scholar]
- Hwa AJ, Fry RC, Sivaraman A, So PT, Samson LD, Stolz DB, Griffith LG. Rat liver sinusoidal endothelial cells survive without exogenous VEGF in 3D perfused co-cultures with hepatocytes. Faseb J. 2007;21:2564–2579. doi: 10.1096/fj.06-7473com. [DOI] [PubMed] [Google Scholar]
- Kaplowitz N. Drug-induced liver disorders: implications for drug development and regulation. Drug Saf. 2001;24:483–490. doi: 10.2165/00002018-200124070-00001. [DOI] [PubMed] [Google Scholar]
- Kaplowitz N. Idiosyncratic drug hepatotoxicity. Nat Rev Drug Discov. 2005;4:489–499. doi: 10.1038/nrd1750. [DOI] [PubMed] [Google Scholar]
- King BM, Tidor B. MIST: Maximum Information Spanning Trees for Dimension Reduction of Biological Data Sets. Bioinformatics. 2009 doi: 10.1093/bioinformatics/btp109. [DOI] [PMC free article] [PubMed] [Google Scholar]
- LeCluyse EL, Alexandre E, Hamilton GA, Viollon-Abadie C, Coon DJ, Jolley S, Richert L. Isolation and culture of primary human hepatocytes. Methods Mol Biol. 2005;290:207–229. doi: 10.1385/1-59259-838-2:207. [DOI] [PubMed] [Google Scholar]
- Lee WM. Drug-induced hepatotoxicity. N Engl J Med. 2003;349:474–485. doi: 10.1056/NEJMra021844. [DOI] [PubMed] [Google Scholar]
- Liu S, Gallo DJ, Green AM, Williams DL, Gong X, Shapiro RA, Gambotto AA, Humphris EL, Vodovotz Y, Billiar TR. Role of toll-like receptors in changes in gene expression and NF-kappa B activation in mouse hepatocytes stimulated with lipopolysaccharide. Infect Immun. 2002;70:3433–3442. doi: 10.1128/IAI.70.7.3433-3442.2002. [DOI] [PMC free article] [PubMed] [Google Scholar]
- Luedde T, Trautwein C. Intracellular survival pathways in the liver. Liver Int. 2006;26:1163–1174. doi: 10.1111/j.1478-3231.2006.01366.x. [DOI] [PubMed] [Google Scholar]
- Luyendyk JP, Maddox JF, Cosma GN, Ganey PE, Cockerell GL, Roth RA. Ranitidine treatment during a modest inflammatory response precipitates idiosyncrasy-like liver injury in rats. J Pharmacol Exp Ther. 2003;307:9–16. doi: 10.1124/jpet.103.054288. [DOI] [PubMed] [Google Scholar]
- Malhi H, Gores GJ. Cellular and molecular mechanisms of liver injury. Gastroenterology. 2008;134:1641–1654. doi: 10.1053/j.gastro.2008.03.002. [DOI] [PMC free article] [PubMed] [Google Scholar]
- Mari M, Colell A, Morales A, Caballero F, Moles A, Fernandez A, Terrones O, Basanez G, Antonsson B, Garcia-Ruiz C, Fernandez-Checa JC. Mechanism of mitochondrial glutathione-dependent hepatocellular susceptibility to TNF despite NF-kappaB activation. Gastroenterology. 2008;134:1507–1520. doi: 10.1053/j.gastro.2008.01.073. [DOI] [PubMed] [Google Scholar]
- O’Brien P, Haskins JR. In vitro cytotoxicity assessment. Methods Mol Biol. 2007;356:415–425. doi: 10.1385/1-59745-217-3:415. [DOI] [PubMed] [Google Scholar]
- Obach RS, Kalgutkar AS, Soglia JR, Zhao SX. Can in vitro metabolism-dependent covalent binding data in liver microsomes distinguish hepatotoxic from nonhepatotoxic drugs? An analysis of 18 drugs with consideration of intrinsic clearance and daily dose. Chem Res Toxicol. 2008;21:1814–1822. doi: 10.1021/tx800161s. [DOI] [PubMed] [Google Scholar]
- Olson H, Betton G, Robinson D, Thomas K, Monro A, Kolaja G, Lilly P, Sanders J, Sipes G, Bracken W, Dorato M, Van Deun K, Smith P, Berger B, Heller A. Concordance of the toxicity of pharmaceuticals in humans and in animals. Regul Toxicol Pharmacol. 2000;32:56–67. doi: 10.1006/rtph.2000.1399. [DOI] [PubMed] [Google Scholar]
- Ostapowicz G, Fontana RJ, Schiodt FV, Larson A, Davern TJ, Han SH, McCashland TM, Shakil AO, Hay JE, Hynan L, Crippin JS, Blei AT, Samuel G, Reisch J, Lee WM. Results of a prospective study of acute liver failure at 17 tertiary care centers in the United States. Ann Intern Med. 2002;137:947–954. doi: 10.7326/0003-4819-137-12-200212170-00007. [DOI] [PubMed] [Google Scholar]
- Peters TS. Do preclinical testing strategies help predict human hepatotoxic potentials? Toxicol Pathol. 2005;33:146–154. doi: 10.1080/01926230590522121. [DOI] [PubMed] [Google Scholar]
- Schwabe RF, Brenner DA. Mechanisms of Liver Injury. I. TNF-alpha-induced liver injury: role of IKK, JNK, and ROS pathways. Am J Physiol Gastrointest Liver Physiol. 2006;290:G583–589. doi: 10.1152/ajpgi.00422.2005. [DOI] [PubMed] [Google Scholar]
- Shaw PJ, Ganey PE, Roth RA. Tumor necrosis factor alpha is a proximal mediator of synergistic hepatotoxicity from trovafloxacin/lipopolysaccharide coexposure. J Pharmacol Exp Ther. 2009;328:62–68. doi: 10.1124/jpet.108.143792. [DOI] [PMC free article] [PubMed] [Google Scholar]
- Shaw PJ, Hopfensperger MJ, Ganey PE, Roth RA. Lipopolysaccharide and trovafloxacin coexposure in mice causes idiosyncrasy-like liver injury dependent on tumor necrosis factor-alpha. Toxicol Sci. 2007;100:259–266. doi: 10.1093/toxsci/kfm218. [DOI] [PubMed] [Google Scholar]
- Sivaraman A, Leach JK, Townsend S, Iida T, Hogan BJ, Stolz DB, Fry R, Samson LD, Tannenbaum SR, Griffith LG. A microscale in vitro physiological model of the liver: predictive screens for drug metabolism and enzyme induction. Curr Drug Metab. 2005;6:569–591. doi: 10.2174/138920005774832632. [DOI] [PubMed] [Google Scholar]
- Tacke F, Luedde T, Trautwein C. Inflammatory Pathways in Liver Homeostasis and Liver Injury. Clin Rev Allergy Immunol. 2008 doi: 10.1007/s12016-008-8091-0. [DOI] [PubMed] [Google Scholar]
- Trusheim MR, Berndt ER, Douglas FL. Stratified medicine: strategic and economic implications of combining drugs and clinical biomarkers. Nat Rev Drug Discov. 2007;6:287–293. doi: 10.1038/nrd2251. [DOI] [PubMed] [Google Scholar]
- Tukov FF, Luyendyk JP, Ganey PE, Roth RA. The role of tumor necrosis factor alpha in lipopolysaccharide/ranitidine-induced inflammatory liver injury. Toxicol Sci. 2007;100:267–280. doi: 10.1093/toxsci/kfm209. [DOI] [PubMed] [Google Scholar]
- Tukov FF, Maddox JF, Amacher DE, Bobrowski WF, Roth RA, Ganey PE. Modeling inflammation-drug interactions in vitro: a rat Kupffer cell-hepatocyte coculture system. Toxicol In Vitro. 2006;20:1488–1499. doi: 10.1016/j.tiv.2006.04.005. [DOI] [PubMed] [Google Scholar]
- Uetrecht J. Screening for the potential of a drug candidate to cause idiosyncratic drug reactions. Drug Discov Today. 2003;8:832–837. doi: 10.1016/s1359-6446(03)02816-2. [DOI] [PubMed] [Google Scholar]
- Uetrecht J. Idiosyncratic drug reactions: current understanding. Annu Rev Pharmacol Toxicol. 2007;47:513–539. doi: 10.1146/annurev.pharmtox.47.120505.105150. [DOI] [PubMed] [Google Scholar]
- Uetrecht J. Idiosyncratic drug reactions: past, present, and future. Chem Res Toxicol. 2008;21:84–92. doi: 10.1021/tx700186p. [DOI] [PubMed] [Google Scholar]
- Warren GW, Poloyac SM, Gary DS, Mattson MP, Blouin RA. Hepatic cytochrome P-450 expression in tumor necrosis factor-alpha receptor (p55/p75) knockout mice after endotoxin administration. J Pharmacol Exp Ther. 1999;288:945–950. [PubMed] [Google Scholar]
- Wu D, Cederbaum A. Cytochrome P4502E1 sensitizes to tumor necrosis factor alpha-induced liver injury through activation of mitogen-activated protein kinases in mice. Hepatology. 2008;47:1005–1017. doi: 10.1002/hep.22087. [DOI] [PubMed] [Google Scholar]
- Xu JJ, Diaz D, O’Brien PJ. Applications of cytotoxicity assays and pre-lethal mechanistic assays for assessment of human hepatotoxicity potential. Chem Biol Interact. 2004;150:115–128. doi: 10.1016/j.cbi.2004.09.011. [DOI] [PubMed] [Google Scholar]
- Xu JJ, Henstock PV, Dunn MC, Smith AR, Chabot JR, de Graaf D. Cellular Imaging Predictions of Clinical Drug-Induced Liver Injury. Toxicol Sci. 2008;105:97–105. doi: 10.1093/toxsci/kfn109. [DOI] [PubMed] [Google Scholar]
- Zolfaghari R, Cifelli CJ, Lieu SO, Chen Q, Li NQ, Ross AC. Lipopolysaccharide opposes the induction of CYP26A1 and CYP26B1 gene expression by retinoic acid in the rat liver in vivo. Am J Physiol Gastrointest Liver Physiol. 2007;292:G1029–1036. doi: 10.1152/ajpgi.00494.2006. [DOI] [PMC free article] [PubMed] [Google Scholar]