Abstract
Models of human disease have long been used to understand the basic pathophysiology of disease and to facilitate the discovery of new therapeutics. However, as long as models have been used there have been debates about the utility of these models and their ability to mimic clinical disease at the phenotypic level. The application of genetic studies to both humans and model systems allows for a new paradigm, whereby a novel comparative genomics strategy combined with phenotypic correlates can be used to bridge between clinical relevance and model utility. This study presents a comparative genomic map for “candidate hypertension loci in humans” based on translating QTLs between rat and human, predicting 26 chromosomal regions in the human genome that are very likely to harbor hypertension genes. The predictive power appears robust, as several of these regions have also been implicated in mouse, suggesting that these regions represent primary targets for the development of SNPs for linkage disequilibrium testing in humans and/or provide a means to select specific models for additional functional studies and the development of new therapeutics.
Genetic studies of multifactorial disorders such as hypertension in human populations remain challenging because of multiplicity of genes underlying complex phenotypes, the modest nature of gene effects, and the inevitable heterogeneity of the patient population. Because of the limited success in identifying genes involved in complex traits using linkage studies, map-based association studies and linkage disequilibrium tests have gained momentum as novel approaches, supported by the rapid development of “third generation” markers based on single-nucleotide polymorphisms (SNPs) (Wang et al. 1998; Marshal 1999). These studies require a very high density of genetic markers and sophisticated statistical tools to analyze large marker sets (Lander 1996; Collins et al. 1997; Kruglyak 1997). Once a region is established to harbor a major disease gene, there is potential for advanced “finished” sequencing of these regions (Collins et al. 1998). The huge human and economic cost of hypertension warrants an accelerated discovery pathway for SNP development and advance finished sequencing of regions containing the disease genes. However, little is known about the genetic basis of human hypertension or any other multifactorial disorder (e.g., diabetes, myocardial infarction, psychiatric disease), limiting these novel strategies until a high-density SNP map is available.
Studies on the genetic basis of hypertension have discovered multiple quantitative trait loci (QTLs) predominantly in rat models (Hamet et al. 1998) and encouraged studies in human populations using the candidate gene approach (Jeunemaitre et al. 1992a,b; Casari et al. 1995). However, with the exception of rare monogenic forms (Shimkets et al. 1994; Simon et al. 1996a,b), limited progress has been made in the identification of underlying genetic factors of essential hypertension and case/control studies using the candidate gene approach have yielded conflicting results (Jeunemaitre et al 1992a,b; Harrap et al. 1993; Iwai et al. 1994; Casari et al. 1995; Kato et al. 1998; Brand et al. 1998; Niu et al. 1998). A recent study in the mouse has also identified QTLs within the mouse genome contributing to hypertension (Wright et al. 1999). Therefore, we developed a novel comparative genomics strategy for using QTLs from various rat models for genetic hypertension to prioritize regions of the human genome for focused SNP discovery and linkage disequilibrium testing. A sufficient number of high-quality genetic studies conducted in human and mouse provided a means to validate our strategy. In addition to prioritized regions for high-density genotyping in humans using SNPs, the data presented here
also provide investigators with valuable phenotype and mapping information on blood pressure phenotypes that may be beneficial for positional cloning efforts and drug discovery, for example, using congenic animals. Here, we report a total of 67 QTLs for 39 blood pressure traits in the progenies of seven F2 rat intercrosses for genetic hypertension on the basis of which 26 homologous regions are prioritized target regions for human genetic studies. Importantly, when validating our strategy by comparing our results with those from recent genome-wide scans in human populations (Julier et al. 1997; Mansfield et al. 1997; Krushkal et al. 1998), five out of the six known QTLs for human hypertension were correctly predicted based on our studies using rat models. Additionally, seven QTLs for blood pressure identified recently in the mouse (Wright et al. 1999) fall within four intervals identified in our rat studies, one of which has been confirmed in humans (Krushkal et al. 1999). Therefore, the predicted human regions represent genetically validated targets for linkage disequilibrium testing using SNPs.
RESULTS
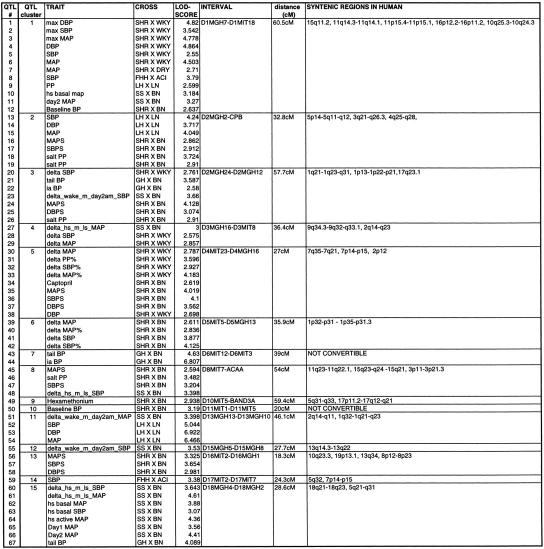
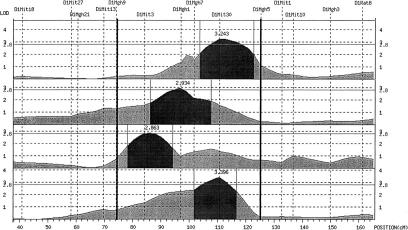
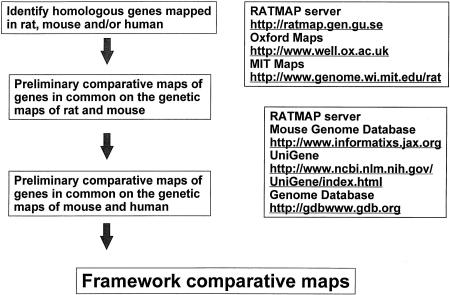
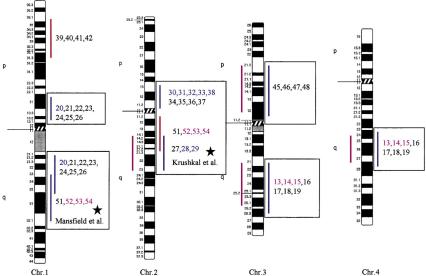
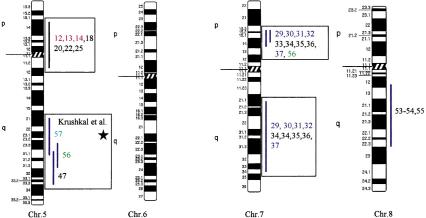
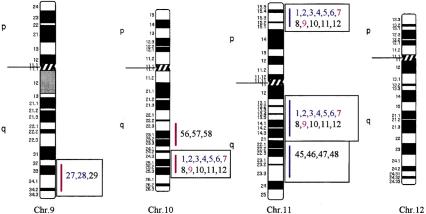
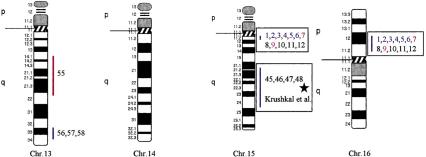
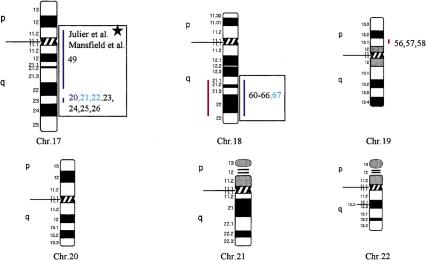
Using the total genome scan approach, we identified a total of 67 QTLs for a total of 39 blood pressure-related traits (see Methods for details) in seven F2 progenies (Table 1) derived from different genetically hypertensive rat strains. These 67 QTLs were integrated on an integrated map and clustered in 15 independent genomic regions. An example for construction of a cluster is shown in Figure 1. Table 1 shows the location of the QTLs identified, including the genetic markers flanking the combined 99% confidence interval (C.I.), genetic distance covered, and lod scores for the given trait in the respective rat intercross, in total, ∼500 cM, ∼30% of the rat genome. Comparative maps were constructed based on conserved genomic regions and evolutionary breakpoints between rat, mouse, and human genomes (Fig. 2) using homologous genes as anchors. Based on these comparative maps, the 67 QTLs identified in the rat were translated to 26 chromosomal segments that are located on 16 autosomes in the human genome (Fig. 3; Table 2). Of these segments, 20 come from 8 distinct QTL clusters (regions of overlapping QTLs) identified on rat chromosomes 1, 2, 3, 4, 8, 13, and 18 (Table 1) and are designated as first priority regions covering ∼22.5% of the human autosomal genome. These clusters represent areas where multiple blood pressure-related traits were linked in multiple crosses and, therefore, are likely to be essential regions. Five regions predicted based on our rat studies (1q, 2p13, 5q31, 15q22, and 17q) were recently identified in genome-wide scans for human hypertension (Julier et al. 1997; Mansfield et al 1997; Krushkal et al. 1998) (Fig. 3, flagged with a star). Table 2 provides the 26 predicted chromosomal segments of the human genome based on cytogenetics as well as a list of the 412 genetic markers currently available based on GeneMap98 at the National Center for Biotechnology Information (NCBI). This table also lists some of the obvious candidate genes within each interval.
Table 1.
Hypertension-Related QTLs Identified in the Progenies of Genetically Hypertensive Rats and Syntenic Chromosomal Regions in Human Genome Based on Cytogenetics
Data shown represent the 99% C.I. for each QTL trait. The total genetic distance covered by QTLs in the rat was 567.6 cM based on a drop of 1.6 lod units from the peak. For detailed phenotype description and abbreviation please see Table 3. QTLs 10, 11, 23, 27, 55, 61, 62, 63, 64, 65, and 66 were mapped nonparametrically using the ‘np scan’ option available in MAPMAKER/QTL (v.1.9).
Figure 1.
Demonstration of QTL clustering. The dark-shaded area of the QTL profile represents the 99% C.I. of each QTL. The dark vertical lines indicate the boundary of the QTL cluster, which is defined by the nearest two markers flanking the combined 99% C.I, in this example D1Mgh9 and D1Mgh5.
Figure 2.
Flow chart showing the algorithm for constructing framework comparative maps between rat, mouse, and human genomes based on publicly available databases.
Figure 3.
Human chromosomal regions implicated in hypertension based on rat–human comparative maps for 67 QTLs identified in seven different progenies from genetically hypertensive rats. Distribution of the 26 predicted genomic regions in the human genome located on 16 different autosomes based on cytogenetics. Human chromosomes 6, 12, 14, 20, 21, and 22 do not contain positional candidate loci predicted by the rat studies, and the sex chromosomes were not evaluated in this study. Regions of the genome in which multiple blood pressure-related phenotypes cluster from more than one cross are designated first priority regions. There are 20 of 26 regions that fall into this category (boxed regions). We predict six “second priority regions” based on QTLs identified in a single rat cross that may represent either areas of interest for a distinct subtype of hypertension or areas harboring modifier genes for blood pressure (nonboxed regions). Confidence level for placement of syntenic regions designated by vertical bars: (Red) Highest, (blue) high, (black) moderate. Numbers: (Black) SHR × BN, (purple) SS/MCW × BN, (blue) SHR × WKY, (red) SHR × DRY, (dark green) ACI × FHH, (light green) GH × BN, (magenta) LH × LN. Mouse syntenic QTLs are represented by the vertical bars to the left of the human idiograms. (Star) Genomic region reported with significant or suggestive linkage in genome scans for hypertension in humans.
Table 2.
Predicted Chromosomal Segments in the Human Genome Based on Synteny to Blood Pressure QTLs in the Rat
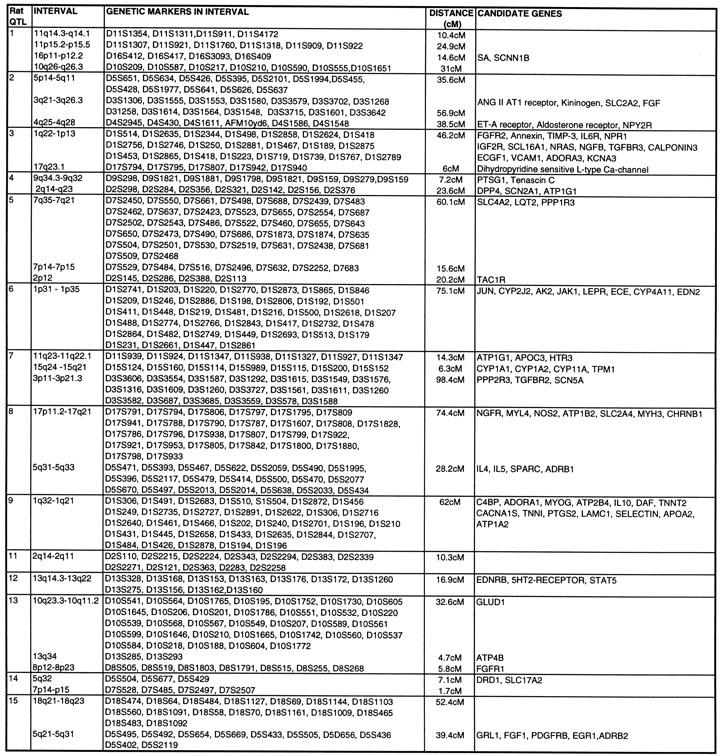 |
Genetic markers and candidate genes provided represent markers, as mapped and listed in GeneMap98. Homologous regions are listed in relation to the respective genetic location in the rat, and putative candidate genes were chosen based on MIM-Maps and verified for map position in the syntenic region in mouse/rat using the MGD. Of 67 QTLs, 64 were converted to discrete homologous regions in the human genome; 3 QTLs (QTLs 43, 44, and 50) could not be converted because of incomplete coverage of the rat genetic map or lack of homologous genes being mapped between rat, mouse, and human.
The 26 regions in the human genome represent ∼30% of the genome, suggesting that the overlap between the rat and human data could be a chance occurrence. Estimates on the bin size of QTL regions in rat and human genomes, respectively, showed that our predictions of target regions in the human genome were not due to chance (z-test, P < 0.001; see Methods for details). Furthermore, five out of six regions have been identified in genome scans in humans, with two of the predicted regions (5q and 17q) confirmed in two independent studies. Moreover, recent studies in the mouse have identified several QTLs that contribute to high blood pressure in this model. The mouse QTLs are syntenic with the QTLs on rat chromosomes 2, 3, 8, and 18 and on predicted regions on human chromosomes 2q14–q23, 3p11–3p21.3, 3q21–q26.6, 4q25–q28, 5p14–q12, and 18q21–q23, further suggesting conserved regions contributing to blood pressure regulation (Fig. 3).
DISCUSSION
The recent improvement of analytical techniques in molecular genetics has provided powerful tools to identify the genes involved in heritable diseases. However, polygenic disorders in humans remain challenging. Power estimates suggest that identification of genes responsible for common polygenic disorders will most likely come from association studies (Risch and Merikangas 1996). Unfortunately, association studies require specific candidate genes or closely spaced markers (at an average spacing of at most 150 kb) to be tested. Given that the third generation map of the human genome is not immediately available, there is a need to select candidate regions for early SNP development. Our strategy is to use animal models. Prior to this publication, investigators have used QTLs in the rat to select candidate genes for testing in human populations. For example, we and others have reported that a QTL identified in the rat harboring the angiotensin converting enzyme (ACE) gene was linked to high blood pressure (Hilbert et al. 1991; Jacob et al. 1991). Quickly following these publications, Jeunemaitre et al. (1992a) reported that ACE was not linked to hypertension in humans. Nonetheless, ACE was tested in many populations with the majority of the studies concluding that the human ACE gene was not linked to hypertension (Staessen et al. 1997). However, other genes in the vicinity of ACE could not be ruled out. Two recent publications reporting that QTLs in the region of ACE were linked to high blood pressure in humans (Julier et al. 1997; Mansfield et al. 1997) suggested that QTLs identified in the rat may be predictive. Therefore, we constructed a comparative genomic map for “candidate hypertension loci in humans” based on translating QTLs between rat and human, and vice versa. As this is a novel strategy, it was fundamental to validate the approach. For validation, we compared our predictions with results from the literature (Julier et al. 1997; Mansfield et al. 1997), the Family Blood Pressure Program (Krushkal et al. 1998, 1999) as well as results from studies in the mouse (Wright et al. 1999). Strikingly, there was tremendous overlap between the QTLs identified in the rat, mouse, and human. The identification of a genomic interval where blood pressure QTLs were identified across human (2q14–q23), mouse (chromosome 2), and rat (chromosome 3) genomes further supports the power of comparative mapping and validates the use of this strategy. As more studies are underway, for example, in the mouse, we expect additional QTLs to be identified that are likely to coincide with blood pressure loci in the syntenic regions of the rat.
We studied seven different rat crosses that represent five of the nine inbred strains of genetically hypertensive rats (Stoll and Jacob 1999) and identified 67 QTLs for 39 blood pressure traits. Many of the loci presented in Table 1 have also been reported by other investigators (Hamet et al. 1998), providing additional evidence that these loci play a major role in high blood pressure in the rat. Interestingly, none of the QTLs in the rat were found in all seven crosses, illustrating the degree of locus heterogeneity (different genes) that exists even in a simplified model. We have also found that age and method of blood pressure measurement affect QTL mapping (data not shown). Because the different genetically hypertensive rats display different etiologies of hypertension, we reasoned that the integration of the results from all crosses would collectively mimic the heterogeneous clinical picture of hypertension and the homologous human region candidates for investigation. The data presented here could be used in human association studies. Such a strategy has been used to investigate sequence variation across two candidate genes, ACE (Keavney et al. 1998; Rieder et al. 1999) and lipoprotein lipase gene (Nickerson et al. 1998), illustrating the power of using SNPs and haplotype structure (even within a single gene) in the localization and identification of high-risk susceptibility mutations for complex diseases. As a starting point for developing SNPs in the regions implicated, we provide a list of the 412 genetic markers currently available for the 26 regions of the human genome in Table 2. These markers can be used to determine ESTs that are harbored within the interval, which in turn can be used to develop SNPs in coding regions. Furthermore, the limited number of “first priority regions” (representing 22.5% of the autosomal genome) implicated in blood pressure regulation could be rapidly developed and tested in the existing collections of patient populations for essential hypertension. As more genetic studies are completed in humans, we predict that the number of syntenic regions for the blood pressure QTLs will also increase, many in the regions predicted here.
Although the predictive power of comparative mapping can be used to prioritize regions to develop large numbers of SNPs, the most likely important aspect of these data is that they provide investigators with a means to select a model system that shares phenotypic and genomic content with a clinical population. In this regard, developing specific congenics (designer congenics) that share phenotypic and genotypic characteristics would yield a powerful platform for functional studies, especially with respect to the physiology and pharmacology of the cardiovascular system. Furthermore, well-defined genetic models open a wide range of possibilities for the identification of targets and the development of new therapeutics. Finally, the cloning and functional characterization of susceptibility genes for multifactorial diseases will most probably require animal model systems. Here, we illustrated that as comparative maps improve and more biological traits are linked to the genome, it will become increasingly easier to integrate the power of functional studies in animal models into a greater understanding of human diseases and, hopefully, improved therapeutic outcomes.
METHODS
Linkage Analysis of Hypertension-Related Traits in Various Genetically Hypertensive Rat Intercrosses
This study used five different hypertensive rat strains: the spontaneously hypertensive rat (SHR); the Dahl salt-sensitive rat rederived at the Medical College of Wisconsin (SS/MCW); the Lyon hypertensive (LH) rat; the fawn hooded hypertensive rat developed at Erasmus University (FHH/EUR) and the genetically hypertensive rat (GH); and four different normotensive strains, the Brown–Norway (BN), the Lyon normotensive (LN) rat, August, Copenhagen, and Irish (ACI), and Donryu (DRY). Seven sets of F2 intercross progeny from mating genetically hypertensive and normotensive inbred strains (SHR × WKY, SHR × BN, SS × BN, LH × LN, FHH/EUR × ACI, GH × BN, and SHR × DRY) totaling 1687 animals and 39 blood pressure-related phenotypes were studied. The protocols for each study and the methods for estimating blood pressure varied between the seven studies; therefore, each estimate of blood pressure is treated as an independent estimate to avoid biasing the data set. The details of the specific experimental protocols used for some of the studies were described previously (Harris et al. 1995; Schork et al. 1995; Brown et al. 1996; Innes et al. 1998) and are summarized in Table 3. For linkage analysis, genomic DNA was extracted from liver and spleen using standard methods (Jacob et al. 1995). Genome-wide scans for all autosomes were performed independently in each cross using between 180 and 250 polymorphic simple sequence length polymorphism (SSLP) markers with an average spacing of 10 cM as described previously (Schork et al. 1995; Brown et al. 1996; Innes et al. 1998). Phenotype distributions were tested for normality using the Kolmogorov-Smirnov (KS) test (Fisher and van Belle 1996) prior to parametric and/or nonparametric linkage analysis using the MAPMAKER/QTL computer package (v. 1.9) (Lander et al. 1987). Thresholds for the lod scores were established for our cross structure in accordance with Lander and Kruglyak (1995), where a lod score >2.8 was suggestive and a lod score >4.3 was significant for an F2 intercross. Eighty-two percent (55 out of 67) of the rat QTLs were >2.8. In addition, 12 QTLs with an lod score of >2.5 were included under the premise that they were located in a genomic region that contained at least one more QTL that reached a minimal lod score of 2.8. The 99% C.I. for each QTL in a given cross was determined by calculating the genetic distance based on the drop of 1.6 lod units from the peak. The use of the 1.6 lod unit drop to define the C.I., rather than the traditional lod drop of 1, results in an expansion of the interval by ∼25%. However, we believe this more conservative approach is critical to minimize the number of type II errors (missed linkages), when translating between species in a predictive way.
Table 3.
Phenotype Designation Key for Mapped QTLs in Progenies from Hypertensive Rat Strains
| Rat cross | Phenotype description | |
|---|---|---|
| Max DBP | SHR × SKY | maximal diastolic blood pressure |
| Max SBP | SHR × WKY | maximal systolic blood pressure |
| Max MAP | SHR × WKY | maximal mean arterial blood pressure |
| DBP | SHR × WKY | diastolic blood pressure (baseline) |
| SBP | SHR × WKY | systolic blood pressure (baseline) |
| MAP | SHR × WKY | mean arterial blood pressure (baseline) |
| MAP | SHR × DRY | mean arterial blood pressure |
| SBP | FHH × ACI | systolic blood pressure |
| PP | LH × LN | pulse pressure |
| Hs basal MAP | SS × BN | mean arterial blood pressure, arterial catheter implanted, 4 weeks high salt diet (8%) mean of measurements on 3 consecutive days, basal state—lights on and rat asleep |
| Day2 MAP | SS × BN | mean arterial blood pressure, 4 weeks high salt diet (8%), day 2 measurement |
| Baseline BP | SHR × BN | baseline blood pressure average of 30 min on regular diet |
| SBP | LH × LN | systolic blood pressure |
| DBP | LH × LN | diastolic blood pressure |
| MAP | LH × LN | mean arterial blood pressure |
| MAPS | SHR × BN | mean arterial blood pressure average of 30 min after 14 days high salt diet on 1% NaCl |
| SBPS | SHR × BN | systolic blood pressure average of 30 min after 14 days high salt diet on 1% NaCl |
| DBPS | SHR × BN | diastolic blood pressure average of 30 min after 14 days high salt diet on 1% NaCl |
| Salt PP | SHR × BN | pulse pressure average of 30 min after 14 days high salt diet on 1% NaCl |
| ΔSBP | SHR × WKY | systolic blood pressure, change from baseline after ‘startle’ |
| Tail BP | GH × BN | blood pressure measured by sphygomanometer |
| ia BP | GH × BN | intra-arterial blood pressure |
| Δ_wake_m_day2a m_SBP | SS × BN | systolic blood pressure, high salt diet, p.m. active state value minus a.m. basal state |
| Delta_hs_m_ls_MAP | SS × BN | mean arterial pressure, high salt minus low salt, basal state—lights on and rat asleep |
| ΔMAP | SHR × WKY | mean arterial pressure, change from baseline after startle |
| ΔPP% | SHR × WKY | pulse pressure, percent change from baseline after startle |
| ΔSBP% | SHR × WKY | systolic blood pressure, percent change from baseline after startle |
| ΔMAP% | SHR × WKY | mean arterial pressure, percent change from baseline after startle |
| ΔMAP | SHR × BN | delta mean arterial pressure after 14 days (1% NaCl) minus mean arterial pressure on low salt |
| ΔMAP% | SHR × BN | delta mean arterial pressure after 14 days (1% NaCl) minus mean arterial pressure on low salt expressed as percentage |
| ΔSBP% | SHR × BN | delta systolic blood pressure after 14 days (1% NaCl) minus systolic blood pressure on low salt expressed as percentage |
| ΔSBP | SHR × BN | delta systolic blood pressure after 14 days (1% NaCl) minus systolic blood pressure on low salt |
| Delta_wake_m_day2a m_MAP | SS × BN | mean arterial blood pressure, high salt diet, p.m. active state value minus a.m. basal state |
| Delta_hs_m_ls_SBP | SS × BN | systolic blood pressure, high salt minus low salt, basal state—lights on and rat asleep |
| Hs basal SBP | SS × BN | systolic blood pressure, arterial catheter implanted, 4 weeks high salt diet (8%) mean of measurements on three consecutive days, basal state—lights on and rat asleep |
| Hs active MAP | SS × BN | mean arterial pressure, arterial catheter implanted, high salt diet, active state—lights off and rat awake |
| Day1 MAP | SS × BN | mean arterial blood pressure, 4 weeks high salt diet (8%), day 2 measurement |
| Captopril | SHR × BN | mean arterial blood pressure after administration of Captopril |
| Hexamethonium | SHR × BN | mean arterial blood pressure after administration of Captopril and Hexamethonium |
Generation of QTL Clusters Among the Various Crosses
Blood pressure-related QTLs (99% C.I.) with a lod score >2.8 lod units identified in the rat progenies were integrated into a map that was constructed based on genetic information of all crosses used. Clusters of QTLs in the same genomic region were defined as the genomic region in which two or more pressure-related QTLs overlapped within their 99% confidence intervals. The boundary for each “QTL cluster” was defined by the two nearest markers flanking the “combined 99% C.I.” as opposed to the average 99% C.I. (Fig. 1).
Construction of Comparative Maps Between Rat and Human
Map construction was initiated by building framework maps, which were constructed by identifying genes in evolutionarily conserved genomic regions among mammalian species (human, mouse, and rat) that were mapped in rat and mouse and were listed in at least one database containing rat genome data (http://ratmap.gen.gu.se; http://www.well.ox.ac.uk). Conserved regions and evolutionary breakpoints between rat and mouse genomes were identified using the Mouse Genome Database (MGD) with the mapped genes serving as anchoring points within the published genetic maps for both species. The order of genes was determined in the mouse using linkage groups available at MGD (http://www.informatics.jax.org) identifying conserved regions and evolutionary breakpoints between rat and mouse genomes. This information was used to define regions of conserved gene order and evolutionary breakpoints with the human genome, using mapping information of homologous genes in the human genome available in MGD, The Genome Database (http://gdbwww.gdb.org), and the UniGene set at the NCBI (http://www.ncbi.nlm.nih.gov). (Fig. 2).
Integration of QTL Clusters onto the Homologous Regions of the Human Genome
Based on the comparative maps between rat, mouse, and human genomes, rat QTL clusters were integrated onto the human genome at three confidence levels. The criteria for placement were as follows: (1) highest confidence level: Both markers flanking the 99% C.I. were gene based and define a region of conserved gene order between rat and human and several additional genes within the interval provide additional confidence. (2) High confidence level: one flanking marker is gene based; the other flanking markers is anonymous but in close proximity (∼5 cM) of a gene mapped in both species. Several additional markers or genes within the interval agree with the defined conserved region. (3) Moderate confidence level: Flanking markers are anonymous but in the vicinity of mapped genes (∼5 cM). Additional markers within the interval help to include or exclude genomic regions. The cytogenetic location and, when possible, the respective human genetic markers defining the boundaries for the predicted genomic regions were established based on mapped genes in the Human GeneMap98 at NCBI (http://www.ncbi.nlm.nih.gov/genemap98) (Deloukas et al. 1998).
Likelihood to Identify Predicted QTLs in Human Studies
To determine accuracy of QTL prediction across species, various statistical tests were performed to assay for likelihoods that the observed correct predictions of five QTLs identified in human studies were not a chance occurrence. For this, z-tests and χ2 tests were performed based on the following assumptions: The genomic distance covered by rat QTLs and by predicted regions was ∼30% of the complete autosomal genome. If this hypothesis was correct, we would have expected that two of the six (one-third) confirmed human regions would map to the predicted region by chance. Yet five of six (five-sixths) did. In a more stringent test, the genomic regions were binned based on the observed average genomic distance covered by a QTL (30 cM in the rat) and the average size of the homologous region in the human genome (50 cM). In the rat, 15 out of 50 bins showed a linkage with suggestive/significant lod scores for blood pressure QTLs, whereas in the human genome, 26 out of 60 bins were predicted. A z-test showed a significant difference between the frequencies with a P < 0.001, confirming that our observation was not a chance occurrence.
Acknowledgments
This work has been accomplished by a large group of people. Here, we cite them and their contributions as suggested by Rennie et al. (1997) for manuscripts with large author lists. (Initials are given for authors of this paper.) Overall Project Leadership: H.J.J.
Jacob laboratory (Medical College of Wisconsin and formerly from Massachusetts General Hospital): Project leader: M.S.; Comparative maps: M.S., A.E.K.-B.; Genotyping: O. Scott Atkinson, Donna M. Brown, Alec Goodman, Mary Granados, Brendan Innes, George Koike, A.E.K.-B., Rebecca R. Majewski, Michael McLaughlin, Marcelo Nobrega, Carole Roberts, Masahide Shiozawa, Chang Sim, Jason S. Simon, M.S., Maria R. Trolliet, and Eric Winer.
Bioinformatics: Peter J. Tonellato and Zhitao Wang.
Phenotyping of rat crosses: FHH × ACI: A.P.P. (Director), Ineke Hekking-Weyma, Cordula Luhrman-Schlomski, John Mahabier, Mathijs Van Aken, Richard van Dokkum; GH × BN: E.L.H. (Director), E. Linton Phelan, William K. Porteous, Augustine Chen; LH × LN: J.S. (Director), Madeleine Vincent, Nilesh Samani (Leicester); SHR × BN: J.E.K. (Director), Edson D. Moreira, Fumiu Ida,Vera L. Longo, Edna A.D. Paula, Renata Carmona; SHR × DRY: S.B.H. (Director), Mirek Kapuscinski, Fadi Charchar, Tracey Norman; SHR × WKY: M.P.P. (Director), Sadao Nakajima, Laura Breen, Natalia Rioseco-Camacho, Lan Ma, Darrell Farnestil; SS/MCW × BN: A.W.C. (Director), Mary Kaldunski, Terry Kurth, Phyllis Regozzi, Carol Thomas, Kim Bork. This work was supported by grants to M.S. from DFG; to H.J.J. from NHLBI (U10HL54508, IP50HL54998, 5RO1HL58411, 5R01HL55726) and sponsored research from Bristol-Myers Squibb; to M.P.P. from NIH (5PO1 HL35018); to J.E.K. from FAPESP (95 4668-6), CNPq (520696/95-6), and FINEP (66.93.0023.00); and to S.B.H. by the National Health and Medical Research Council of Australia.
The publication costs of this article were defrayed in part by payment of page charges. This article must therefore be hereby marked “advertisement” in accordance with 18 USC section 1734 solely to indicate this fact.
Footnotes
E-MAIL jacob@post.its.mcw.edu; FAX (414) 456-6516.
REFERENCES
- Brand E, Chatelain N, Keavney B, Caulfield M, Citterio L, Connell J, Grobbee D, Schmidt S, Schunkert H, Schuster H, Sharma AM, Soubrier F. Evaluation of the angiotensinogen locus in human essential hypertension. Hypertension. 1998;31:735–729. doi: 10.1161/01.hyp.31.3.725. [DOI] [PubMed] [Google Scholar]
- Brown DM, Provoost AP, Daly MJ, Lander ES, Jacob HJ. Renal disease susceptibility and hypertension are under independent genetic control in the fawn-hooded rat. Nat Genet. 1996;12:44–51. doi: 10.1038/ng0196-44. [DOI] [PubMed] [Google Scholar]
- Casari G, Barlassina C, Cusi D, Zagato L, Muirhead R, Righetti M, Nembri P, Amar K, Gatti M, Macciardi F, Binelli G, Bianchi G. Association of the alpha-adducin locus with essential hypertension. Hypertension. 1995;25:320–326. doi: 10.1161/01.hyp.25.3.320. [DOI] [PubMed] [Google Scholar]
- Collins FS, Guyer MS, Charkravarti A. Variations on a theme: Cataloging human DNA sequence variation. Science. 1997;278:1580–1581. doi: 10.1126/science.278.5343.1580. [DOI] [PubMed] [Google Scholar]
- Collins FS, Patrinos A, Jordan E, Chakravarti A, Gesteland R, Walters L. New goals for the U.S. Human Genome Project: 1998-2003. Science. 1998;282:682–689. doi: 10.1126/science.282.5389.682. [DOI] [PubMed] [Google Scholar]
- Deloukas P, Schuler GD, Gyapay G, Beasley EM, Soderlund C, Rodriguez-Tome P, Hui L, Matise TC, McKusick KB, Beckmann JS, et al. A physical map of 30,000 human genes. Science. 1998;282:744–746. doi: 10.1126/science.282.5389.744. [DOI] [PubMed] [Google Scholar]
- Fisher LD, van Belle G. Biostatistics. A methodology for health sciences. New York, NY: John Wiley & Sons; 1996. p. 332. [Google Scholar]
- Hamet P, Pausova Z, Adarichev V, Adaricheva K, Tremblay J. Hypertension: Genes and environment. J Hypertens. 1998;16:397–418. doi: 10.1097/00004872-199816040-00001. [DOI] [PubMed] [Google Scholar]
- Harrap S, Davidson BR, Connor J, Soubrier F, Corvol P, Fraser R, Foy CJ, Watt GC. The angiotensin I-converting enzyme gene and predisposition to high blood pressure in man. Hypertension. 1993;21:455–460. doi: 10.1161/01.hyp.21.4.455. [DOI] [PubMed] [Google Scholar]
- Harris EL, Phelan EL, Thompson CM, Millar AJ, Grigor MR. Heart mass and blood pressure have separate genetic determinants in the New Zealand genetically hypertensive (GH) rat. J Hypertens. 1995;13:397–404. [PubMed] [Google Scholar]
- Hilbert P, Lindpaintner K, Beckmann JS, Serikawa T, Soubrier F, Dubay C, Cartwright P, De Gouyon B, Julier C, Takahasi S, Vincent M, Ganten D, Georges M, Lathrop GM. Chromosomal mapping of two genetic loci associated with blood pressure regulations in hereditary hypertensive rats. Nature. 1991;353:521–529. doi: 10.1038/353521a0. [DOI] [PubMed] [Google Scholar]
- Innes BA, McLaughlin MG, Kapuscinski MK, Jacob HJ, Harrap SB. Independent genetic susceptibility to cardiac hypertrophy in inherited hypertension. Hypertension. 1998;3:741–746. doi: 10.1161/01.hyp.31.3.741. [DOI] [PubMed] [Google Scholar]
- Iwai N, Ohmichi N, Hanai K, Nakamura Y, Kinoshita M. Human SA gene locus as a candidate locus for essential hypertension. Hypertension. 1994;23:375–380. doi: 10.1161/01.hyp.23.3.375. [DOI] [PubMed] [Google Scholar]
- Jacob HJ, Lindpaintner K, Lincoln SE, Kusumi K, Bunker RK, Mao YP, Ganten D, Dzau VJ, Lander ES. Genetic mapping of a gene causing hypertension in the stroke-prone spontaneously hypertensive rat. Cell. 1991;67:213–224. doi: 10.1016/0092-8674(91)90584-l. [DOI] [PubMed] [Google Scholar]
- Jacob HJ, Brown D, Bunker R, Daly MJ, Dzau VJ, Goodman A, Koike G, Kren V, Kurtz T, Lernmark A, Levan G, Mao Y, Petterson A, Pravenec M, Simon JS, Spzirer C, Spzirer J, Trolliet MR, Winer ES, Lander ES. Genetic linkage map of the laboratory rat, Rattus norvegicus. Nat Genet. 1995;9:63–69. doi: 10.1038/ng0195-63. [DOI] [PubMed] [Google Scholar]
- Jeunemaitre X, Lifton RP, Hunt SC, Williams RR, Lalouel JM. Absence of linkage between the angiotensin converting enzyme locus and human essential hypertension. Nat Genet. 1992a;1:72–75. doi: 10.1038/ng0492-72. [DOI] [PubMed] [Google Scholar]
- Jeunemaitre X, Soubrier F, Kotelevtsev YV, Lifton RP, Williams CS, Charru A, Hunt SC, Hopkins PN, Williams RR, Lalouel JM, Corvol P. Molecular basis of human hypertension: Role of angiotensinogen. Cell. 1992b;71:169–180. doi: 10.1016/0092-8674(92)90275-h. [DOI] [PubMed] [Google Scholar]
- Julier C, Delepine M, Keavney B, Terwilliger J, Davis S, Weeks DE, Bui T, Jeunemaitre X, Velho G, Froguel P, Ratcliffe P, Corvol P, Soubrier F, Lathrop GM. Genetic susceptibility for human familial essential hypertension in a region of homology with blood pressure linkage on rat chromosome 10. Hum Mol Genet. 1997;6:2077–2085. doi: 10.1093/hmg/6.12.2077. [DOI] [PubMed] [Google Scholar]
- Kato N, Sugiyama T, Nabika T, Morita H, Kurihara H, Yazaki Y, Yamori Y. Lack of association between alpha-adducin locus and essential hypertension in the Japanese population. Hypertension. 1998;31:730–733. doi: 10.1161/01.hyp.31.3.730. [DOI] [PubMed] [Google Scholar]
- Keavney B, McKenzie CA, Connell JM, Julier C, Ratcliffe PJ, Sobel E, Lathrop M, Farrall M. Measured haplotype analysis of the angiotensin-I converting enzyme gene. Hum Mol Genet. 1998;11:1745–1751. doi: 10.1093/hmg/7.11.1745. [DOI] [PubMed] [Google Scholar]
- Kruglyak L. The use of a genetic map of biallelic markers in linkage studies. Nat Genet. 1997;17:21–24. doi: 10.1038/ng0997-21. [DOI] [PubMed] [Google Scholar]
- Krushkal J, Xiong M, Ferrell R, Sing CF, Turner ST, Boerwinkle E. Linkage and association of adrenergic and dopamine receptor genes in the distal portion of the long arm of chromosome 5 with systolic blood pressure variation. Hum Mol Genet. 1998;7:1379–1383. doi: 10.1093/hmg/7.9.1379. [DOI] [PubMed] [Google Scholar]
- Krushkal J, Ferrell R, Mockrin SC, Turner ST, Sing CF, Boerwinkle E. Genome-wide linkage analyses of systolic blood pressure using discordant sibling pairs. Circulation. 1999;99:1407–1410. doi: 10.1161/01.cir.99.11.1407. [DOI] [PubMed] [Google Scholar]
- Lander ES. The new genomics: Global views of biology. Science. 1996;274:536–539. doi: 10.1126/science.274.5287.536. [DOI] [PubMed] [Google Scholar]
- Lander ES, Kruglyak L. Genetic dissection of complex traits: Guidelines for interpreting and reporting linkage results. Nat Genet. 1995;11:241–247. doi: 10.1038/ng1195-241. [DOI] [PubMed] [Google Scholar]
- Lander ES, Green P, Abrahamson J, Barlow A, Daly MJ, Lincoln SE, Newburg L. MAPMAKER: An interactive computer package for constructing primary genetic linkage maps of experimental and natural populations. Genomics. 1987;1:174–181. doi: 10.1016/0888-7543(87)90010-3. [DOI] [PubMed] [Google Scholar]
- Mansfield TA, Simon DB, Farfel Z, Bia M, Tucci JR, Lebel M, Gutkin M, Vialettes B, Christofilis MA, Kauppinen-Makelin R, Mayan H, Risch N, Lifton RP. Multilocus linkage of familial hyperkalaemia and hypertension, pseudohypo-aldosteronism type II, to chromosomes 1q31-42 and 17p11-q21. Nat Genet. 1997;16:202–205. doi: 10.1038/ng0697-202. [DOI] [PubMed] [Google Scholar]
- Marshal E. Drug firms to create public database of genetic mutations. Science. 1999;284:406–407. doi: 10.1126/science.284.5413.406. [DOI] [PubMed] [Google Scholar]
- Nickerson DA, Taylor SL, Weiss KM, Clark AG, Hutchinson RG, Stengard J, Salamoo V, Vartiainen V, Boerwinkle E, Sing CF. DNA sequence diversity in a 9.7 kb region of the human lipoprotein lipase gene. Nat Genet. 1998;19:233–240. doi: 10.1038/907. [DOI] [PubMed] [Google Scholar]
- Niu T, Xu X, Rogus J, Zhou Y, Chen C, Yang J, Fang Z, Schmitz C, Zhao J, Rao VS, Lindpaintner K. Angiotensinogen gene and hypertension in Chinese. J Clin Invest. 1998;101:188–194. doi: 10.1172/JCI119876. [DOI] [PMC free article] [PubMed] [Google Scholar]
- Rennie D, Yank V, Emanuel L. When authorship fails. A proposal to make contributors accountable. J Am Med Assoc. 1997;279:22. doi: 10.1001/jama.278.7.579. [DOI] [PubMed] [Google Scholar]
- Rieder MJ, Taylor SL, Clark AJ, Nickerson DA. Sequence variation in the human angiotensin converting enzyme. Nat Genet. 1999;22:59–62. doi: 10.1038/8760. [DOI] [PubMed] [Google Scholar]
- Risch N, Merikangas K. The future of genetic studies of complex human diseases. Science. 1996;273:1516–1517. doi: 10.1126/science.273.5281.1516. [DOI] [PubMed] [Google Scholar]
- Schork NJ, Krieger JE, Trolliet M, Franchini KG, Koike G, Krieger EM, Lander ES, Dzau VJ, Jacob HJ. A biometrical genome search in rats reveals the multigenic basis of blood pressure variation. Genome Res. 1995;5:164–172. doi: 10.1101/gr.5.2.164. [DOI] [PubMed] [Google Scholar]
- Shimkets RA, Warnock DG, Bositis CM, Nelson-Williams C, Hansson JH, Schambelan M, Gill JR, Jr, Ulick S, Milora RV, Findling JW, et al. Liddle's syndrome: Heritable human hypertension caused by mutations in the beta subunit of the epithelial sodium channel. Cell. 1994;79:407–414. doi: 10.1016/0092-8674(94)90250-x. [DOI] [PubMed] [Google Scholar]
- Simon DB, Karet FE, Hamdan JM, DiPietro A, Sanjad SA, Lifton RP. Bartter's syndrome, hypokalaemic alkalosis with hypercalciuria, is caused by mutations in the Na-K-2Cl cotransporter NKCC2. Nat Genet. 1996a;13:183–188. doi: 10.1038/ng0696-183. [DOI] [PubMed] [Google Scholar]
- Simon DB, Karet FE, Rodriguez-Soriano J, Hamdan JH, DiPietro A, Trachtman H, Sanjad SA, Lifton RP. Genetic heterogeneity of Bartter's syndrome revealed by mutations in the K+ channel, ROMK. Nat Genet. 1996b;14:152–156. doi: 10.1038/ng1096-152. [DOI] [PubMed] [Google Scholar]
- Staessen JA, Wang JG, Ginocchio G, Petrov V, Saavedra AP, Soubrier F, Vlietinck R, Fagard R. The deletion/insertion polymorphism of the angiotensin converting enzyme gene and cardiovascular-renal risk. J Hypertens. 1997;15:1579–1592. doi: 10.1097/00004872-199715120-00059. [DOI] [PubMed] [Google Scholar]
- Stoll M, Jacob HJ. Improved strategies for the mapping of quantitative trait loci in the rat model. In: Dominiczak AF, et al., editors. Molecular genetics of hypertension. Oxford, UK: BIOS Scientific Publishers; 1999. pp. 31–52. [Google Scholar]
- Wang DG, Fan J, Siao C, Berno A, Young P, Sapolsky R, Ghandour G, Perkins N, Winchester E, Spencer J, et al. Large-scale identification, mapping, and genotyping of single nucleotide polymorphisms in the human genome. Science. 1998;280:1077–1081. doi: 10.1126/science.280.5366.1077. [DOI] [PubMed] [Google Scholar]
- Wright FA, O'Connor DT, Roberts E, Kutey G, Barry CC, Yoneda LU, Timberlake D, Schlager G. Genome scan for blood pressure loci in mice. Hypertension. 1999;34:625–630. doi: 10.1161/01.hyp.34.4.625. [DOI] [PubMed] [Google Scholar]


