Summary
Temperature is an important factor influencing teleost muscle growth, including a lasting (‘imprinted’) influence of embryonic thermal experience throughout all further life. However, little is still known about the cellular processes behind this phenomenon. The present study uses digital morphometry and immunolabelling for Pax7, Myogenin, and H3P to quantitatively examine thermal history effects on muscle precursor cell (MPC) behaviour and muscle growth in pearlfish (Rutilus meidingeri) until adult stage. Fish were reared at three different temperatures (8.5°, 13°, 16°C) until hatching and subsequently kept under the same (ambient) thermal conditions. Cellularity data are combined with a quantitative analysis of Pax7+ MPC including such that are mitotically active (Pax7+/H3P+) or have entered differentiation (Pax7+/Myogenin+). Results demonstrate that at hatching, body lengths, fast and slow muscle cross sectional areas, and fast fibre numbers are lower at 8.5° and 13° than at 16°C. During the larval period, this situation becomes inverted in the 13°-fish, so that these fish are finally the largest. Effects observed can be related to divergent cellular mechanisms at the MPC level which are initiated in the embryo during the imprinting period. 16°-fish embryos have reduced MPC proliferation but increased differentiation and thus give rise to larger hatchlings. However, their limited MPC reserves finally lead to smaller adults. By contrast, embryos of 13°-fish and, to a lesser extent, 8.5°-fish show enhanced MPC proliferation but reduced differentiation, thus leading to smaller hatchlings but allowing for a larger MPC pool utilisable for enhanced posthatching growth, finally resulting in larger adults.
Keywords: muscle growth, hyperplasia, hypertrophy, fibre type, temperature, Pax7, fish muscle, muscle precursor cells
Introduction
Muscle development in the ectothermic teleost fish is strongly modulated by ambient temperature. Certainly the most exciting among a variety of complex and partly contradictory effects in this context is the phenomenon of ‘thermal imprinting’. This means that the temperature experienced during embryonic life is likely to determine some sort of ‘organismic memory’, thus exerting a lasting (perhaps life-long) influence on the animals’ muscle structure and whole body growth. Within an individual species, this may lead to the situation that fish that are large at hatching end up as small adults, and vice versa, as a result of their early thermal history. Early comprehensive descriptions of effects of such kind date back to studies from the 1990s measuring fibre sizes and nuclei densities of Atlantic salmon and herring transferred to natural habitat conditions after having been reared at different temperatures (Nathanilides et al., 1995; Johnston et al., 1998). Since then, the phenomenon has turned out to be more widespread and variable among teleosts. Thermally dependent persistent programming of muscle growth has been shown to occur in the Atlantic salmon Salmo salar (Nathanilides et al., 1995; Johnston et al., 2000, 2003; Albokhadaim et al., 2007; Macqueen et al., 2008), the halibut Hippoglossus hippoglossus (Galloway et al., 1999), the haddock Melanogrammus aeglefinus (Martell and Kieffer, 2007), the sea bass Dicentrarchus labrax (Alami-Durante et al., 2007), and the zebrafish Danio rerio (Johnston et al., 2009). As with the (non-memory) effects of continued direct thermal influence on teleost myogenesis (reviewed by Johnston and Hall, 2004; Johnston, 2006), thermal imprinting has been shown to interact with teleost muscle differentiation and growth in a complex manner, affecting cellular variables in various ways. Effects detected seem to depend upon factors such as species-specific response patterns, the duration of the imprint, and the developmental interval tested. For example, fast fibre hyperplasia in the larval and/or juvenile periods may be promoted by embryonic rearing at either moderately cold (Nathanilides et al., 1995; Johnston et al., 2003; Albokhadaim et al., 2007; Macqueen et al., 2008), or intermediate (Johnston et al., 2009), or warm (Galloway et al., 1999; Martell and Kieffer, 2007) temperatures within the species’ thermal range. Also, the capacity to recruit new fast fibres in response to the annual rise of water temperature in spring is higher in sea bass juveniles that were reared at low temperature (Alami-Durante et al., 2007).
However, while the studies on the issue to date have certainly provided most valuable ‘mosaic pieces’ of information, our understanding of the process of thermal imprinting as a whole is rather incomplete. This is mainly because only limited allowance has been made for the true spectrum of cellular and molecular mechanisms upon which, and by which, thermal imprinting is likely to act. In regard to cellular mechanisms, studies are frequently confined to effects on fast fibres which constitute the dominant mass-generating (i.e. economically important) tissue. Slow fibre effects, although certainly being of high importance in relation to endurance swimming and flesh quality (Johnston, 1999), have been paid much less attention. Their frequent existence is, however, very probable in the light of strong non-memory responses to continued thermal impact (eg. Egginton and Sidell, 1989; Galloway et al., 1998; Stoiber et al., 2002) and of some imprinting studies (Galloway et al., 1999; Albokhadaim et al., 2007).
Also, the circumstances under which thermal imprinting modulates the supply of myogenic precursor cells (MPCs) to the growing muscle are all only incompletely understood. Combined evidence from two studies of Atlantic salmon suggests that MPC densities in juvenile fast muscle are highest when the embryos are imprinted within an ‘optimum thermal range’, while colder conditions and heating experiments lead to reduced densities (Johnston et al., 2000, 2003). This begs the question whether the phenomenon of thermal imprinting is simply caused by different rates of MPC accumulation until the end of the imprinting period or (also) depends on changes of the proliferation and differentiation rates of these cells later in development. Expression profiles of regulatory microRNAs in thermally imprinted zebrafish point towards sustained responses, including determination of when the adult fish finally desist from investing MPCs into hyperplasia and stay with hypertrophy as the only remaining mode of muscle growth (Johnston et al., 2009).
A promising approach to clarify some of the uncertainties related to temperature-induced cellularity change in fish muscle comes from current advances in determining the origins of teleost MPCs. Recent work has demonstrated that early myogenic development in fish involves cell supply from a dermomyotome (DM), just as in the amniotes (Devoto et al., 2006; Stellabotte and Devoto, 2007). It has been shown that after primary myotome formation, it is DM cells that account for stratified hyperplasia (2nd phase myogenesis) at the myotomes’ dorsal and ventral extremes and at the lateral boundaries of their fast muscle domains (Steinbacher et al., 2006, 2007; Hollway et al., 2007; Stellabotte et al., 2007). Myogenic cells from the posterior DM lip that are transiently stockpiled in the lateral fast muscle continue to promote stratified growth even into the larval period, after the dissociation of the DM (Steinbacher et al., 2008; Marschallinger et al., 2009). Together, this seems to account for the well-known initial surge of teleost body growth until mosaic hyperplasia (3rd phase) is up-regulated during the larval period (muscle growth during this phase is termed “mosaic” because small new fibres become inserted between larger preexisting fibers, thus giving cross sections a mosaic appearance). The results of Hollway et al. (2007) make it very plausible that this 3rd phase of myogenesis also receives MPCs from the DM, again as in the amniotes (cf. Gros et al., 2005; Relaix et al., 2005). From these results, it is further likely that during this phase, the teleost myotome is additionally infiltrated by myogenic cells that do not immediately differentiate but remain as quiescent ‘satellite cells’ required for muscle growth and repair during later life (Hollway et al., 2007). - All this identifies the DM as the pivotal growth engine of teleost myogenesis and makes it plausible that the DM is the prime target for thermal influence on this process in the teleost embryo. Temperature modulation of DM cell dynamics would then be the fundamental determinant of the life-long ‘imprinted’ thermal effects on muscle phenotype and fish growth.
However, despite these advances, knowledge is still missing about whether the thermal memory effect involves modulation of as yet uninvestigated factors such as a possible genuine heterogeneity of the myogenic DM cells, or their detachment behaviour, migratory spread and proliferation/differentiation balance.
The present study investigates the long term effects of embryonic temperature on muscle growth in the cyprinid pearlfish Rutilus meidingeri Heckel in the developmental period from hatching to adult (1+) stage. This is achieved using a combined approach involving (1) digital analysis of muscle cellularity at high-definition on semithin sections to unravel patterns of hyperplastic and hypertrophic growth, (2) an evaluation of myonuclear densities in fast fibres to monitor nuclear domain size and nuclei uptake during hypertrophy, and (3) an immunostaining based characterisation of the proliferation-differentiation balance of MPCs.
Materials and Methods
Rearing and sampling of fish
Investigations were carried out on developmental stages of the European pearlfish Rutilus meidingeri Heckel (Cyprinidae) from hatching to yearling stage. Parent animals were caught at the natural spawning sites in the Seeache river, a tributary to the Attersee, a lake at the northern rim of the Austrian alps in April 2008. To perform imprinting, artificially inseminated eggs were kept at three different temperatures (8.5°C, 13°C and 16°C, ± 0.3°C each) until hatching. Temperatures chosen are all within the species’ range of thermal tolerance during embryogenesis and may, depending upon weather conditions, all occur at the natural spawning sites (Siligato and Gumpinger, 2005). From hatching onwards, all fish were kept under the same (season-dependent) water temperatures as prevailing in the water supplies of the Scharfling Institute. Temperatures rose from 14.5°C in larval life (May-July) to 16°C towards the larva/juvenile transition (August, September), fell to 12°C during the following winter, and rose again to 14.5°C in spring 2009. Fish were kept under natural photoperiod and ad libitum-fed live plankton until mid-August and then switched to commercial fish food of appropriate particle size. Rates of water flow and recirculation were kept equal for all thermal groups at any particular phase of the experiment. Random samples (n≥5 per group and technique) were taken of the following developmental stages: (1) hatching, (2) onset of exogenous feeding at around 11 days post hatching (dph), (3) mid-larval period at 40 dph, (4) advanced larval stage at 82 dph, (5) juvenile stage at 195 dph, (6) and yearling stage at 360 dph. All fish were overanaesthetised with MS-222 (3-aminobenzoic acid ethyl ester, Sigma, Vienna, Austria) and body lengths measured (n≥10 at 0 and 11 dph, and ≥30 at all further stages sampled) prior to any further treatment. Larger animals were cut into smaller pieces to allow sufficient fixative penetration.
Light microscopy and morphometry
Specimens for semithin sectioning for light microscopy and morphometry (5 animals per thermal group and developmental stage) were immersion-fixed at 4°C using Karnovsky’s paraformaldehyde-glutaraldehyde fixative (Karnovsky, 1963) diluted to half-concentration with PBS, postfixed in 1% osmium tetroxide (3 h, 4°C), dehydrated in a graded series of ethanols and embedded into Glycid ether 100 epoxy resin (Serva, Heidelberg, Germany). Semithin transverse sections (1.5 μm) at the level of the anus were cut on a Reichert Ultracut S microtome and mounted on glass slides. For clearer visualisation of cell borders, the osmium contrast was amplified by treatment with 1,4-paraphenylendiamine (Merck-Schuchardt, Hohenbrunn, Germany) (Böck, 1984). Results were photographed through a Reichert Polyvar microscope.
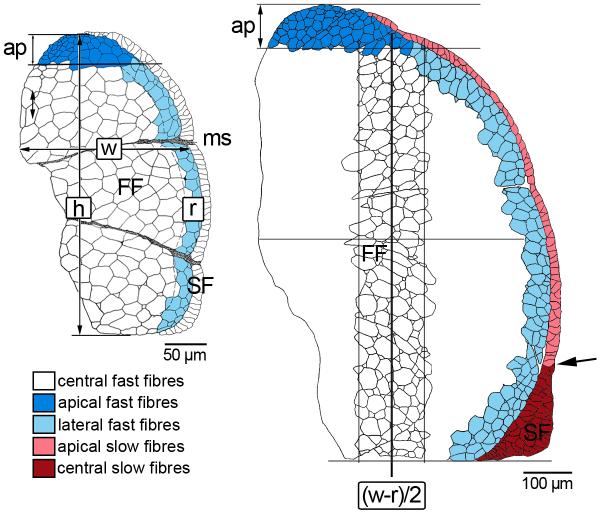
For morphometric analysis of cellularity, contours of the muscle cells within one epaxial and one hypaxial quadrant of the trunk per individual were digitally traced from the semithin sections and measured using an adapted version of the Image J software. To precisely analyse the local variations of hyperplastic growth within the myotome (cf. Steinbacher et al., 2006), quadrants were divided into distinct subregions according to a body-size dependent schedule (Fig. 1): apical, lateral (stratified growth) and central (mosaic growth) in fast muscle, apical and central (stratified growth) in slow muscle. From the 82 dph stage onwards, fibre size measurement in the central fast muscle region was confined to a representative transect (Fig. 1). Fast fibre numbers were always determined for the entire central subregion. Slow muscle subdivision was begun when a mulit-layered slow muscle wedge at the level of the horizontal septum had formed (from 82 dph onwards). To exclude measuring errors of the Image J software, a few implausibly small values (« 2 μm2) were deleted from the dataset.
Fig. 1.
Zonal subdivision of fast and slow muscle for fibre size measurement as exemplified for epaxial quadrants of pearlfish at onset of exogeneous feeding (left) and at 82 dph (right): w width (maximum medio-lateral extension of fast muscle), h height (maximum dorso-ventral extension); boundary of lateral fast muscle growth zone delineated at r = 1/10 w; separating line of apical growth zone at ap = 1/10 h. From 82 dph onward, examination of the central fast fibre zone was confined to a representative transect centred at (w-r)/2, width defined as (w-r)/4, height as h-ap. Also beginning at 82 dph, the slow muscle domain was subdivided into monolayered apical zones and a multilayered central zone at the horizontal septum (demarcation indicated by arrow). FF fast fibres, ms myoseptum, SF slow fibres.
Myonuclei counting
The protocol for evaluation of myonuclear densities was modified after that of Brack et al. (2005). Briefly, 5-10 myotomes were dissected from the anal area of fish previously fixed in 4% paraformaldehyde (PFA) at 4°C for 8 h. After removal of the slow fibre layer and the adhering skin with fine forceps, the myotomes were incubated in 40% NaOH for 5-10 min, rinsed several times in PBS + 0,1% Tween 20, and pipetted up and down vigorously to separate individual fibres. Fibre nuclei were stained with 10μg/ml Hoechst 33258 (Sigma, Vienna, Austria). The nuclei of 40-50 fibres per individual fish from 5 individuals per developmental stage and thermal group were counted, and fibre lengths and diameters measured using Photoshop CS3. Results are expressed as the ratio of myonuclei number to fibre volume (l r2 π), briefly termed nuclei/volume ratio.
Immunolabelling
Immunolabelling of transverse cryostat sections was employed to analyse the temperature-dependent variation of the presence of Pax7+ MPCs within the DM and the myotome. For immunolabelling procedures, freshly killed animals were coated with cryostat embedding medium (Tissue-Tek O.C.T. compound, Miles, Elkhart, USA), cryofixed by plunging into 2-methylbutane cooled to near its freezing point (158°C) by liquid nitrogen, and sectioned as described by Stoiber et al. (2002). All sectioning was confined to positions close to the anal vent.
To discriminate between different subsets of MPCs (proliferating or differentiating cells), the Pax7 antibody was combined with either a marker of proliferation (H3P) or a marker of myogenic differentiation (Myogenin). The following primary antibodies were used: monoclonal mouse anti-chicken paired box transcription factor 7 IgG1 (Pax7; 1:20; DSHB, Iowa, USA), polyclonal rabbit anti-Phospho-Histone H3 (H3P, 1:100; Upstate, Lake Placid, NY, USA) and polyclonal rabbit anti-rat Myogenin (Mgn, 1:100; Santa Cruz Biotechnology, Santa Cruz, California, USA). Molecular Probes Alexa 488-conjugated goat anti-rabbit (1:800) and Molecular Probes Alexa 546-conjugated goat anti-mouse IgG1 (1:800; Invitrogen, Lofer, Austria) were applied as secondary antibodies. Nuclei were counterstained with Hoechst 33258. Detailed protocols are provided in Steinbacher et al. (2006).
Numbers of MPCs were evaluated in the area immediately lateral to the slow fibres (site occupied by the DM/external cell layer in the embryos) and in the lateral fast muscle immediately underneath the slow fibres (lateral stratified growth zone). In fish at hatching, analysis of these two areas was undertaken in the entire epaxial and hypaxial quadrants. In all other stages, evaluation was confined to individual somites/myotomes, i.e. areas delimited by two successive myosepta (cf. Steinbacher et al., 2008). One set of specimens was used to determine numbers of Pax7+/H3P− and Pax7+/H3P+ cells (10-20 somites/myotomes per individual, resulting in a total of about 60 somites/myotomes from 5-7 individuals per developmental stage and thermal regime). A second set of specimens was used to evaluate numbers of Pax7+/Mgn− and Pax7+/Mgn+ cells within the lateral fast muscle (cell numbers given per 100 μm distance along lateral fast muscle surface on myotome cross sections). Note that the central areas of the myotomes (mosaic growth zone) were not included into Pax7+ cell evaluation because, with a very few exceptions, such cells were not detected at these sites (see also Steinbacher et al., 2006; Marschallinger et al., 2009).
Statistical analysis
Standard software packages (SPSS 16, SPSS Inc., Chicago, Illinois, USA) were used for statistical analyses. In all cases, a Kolmogorov-Smirnov test was applied to test for normal distribution of the data. Levene’s test was used to ascertain that the homogeneity of variances assumption is satisfied. Differences between temperature groups were analysed using a one-way analysis of variance (ANOVA) combined with Levene’s test for homogeneity of variances. Fisher’s LSD procedure was used to explore differences between groups where equivalence of variances was assumed, Games-Howell test was used if variances were heterogeneous. Differences were considered statistically significant at p ≤ 0.05. Means (± s.d.) are used as measure of central tendency.
Results
Fish growth
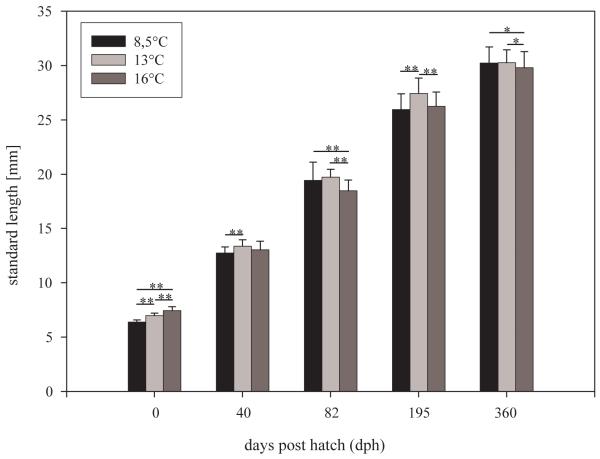
Onset of substantial hatching (about 10% of embryos hatched) was achieved at 7, 11 and 23 days post fertilisation in the 16°C, 13°C and 8.5°C rearing groups, respectively. Mean body size (SL) at hatching was significantly larger in the 16°C group than in the 13°C and 8.5°C groups (p<0.01 each; Fig. 2). Hatchlings at 13°C, in turn, were significantly larger than hatchlings at 8.5°C (p<0.01; Fig. 2). During the following larval period, the 13°- and the 8.5°-fish both exhibited substantial catch-up growth, resulting in that from 40 dph onwards, the 13°-fish were always the largest (Fig. 2). The 8.5°-fish, being the smallest at hatching, were about the same size as the 16°-fish at 40 dph and at 195 dph, and were larger than the 16°-fish at 82 dph and again at 360 dph (Fig. 2).
Fig. 2.
Mean body lengths of thermally imprinted fish groups throughout the experiment; whiskers indicate s.d., significant differences from Fisher’s LSD test are assigned at p≤0.01 (**) and p≤0.05 (*).
Muscle cellularity
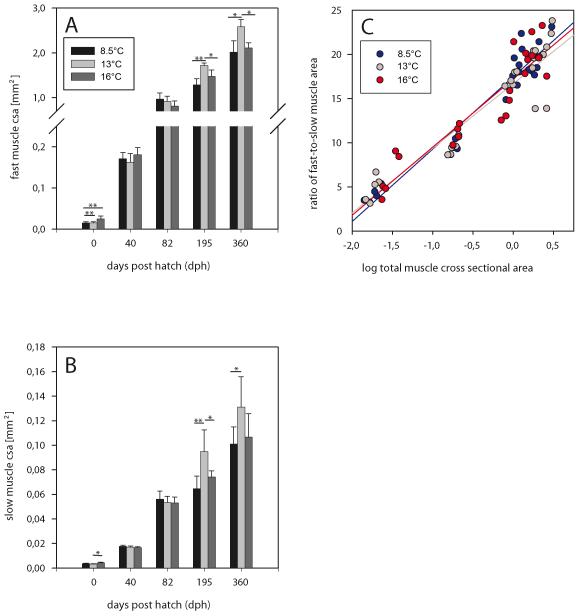
At hatching, the total cross sectional area (csa) of the fast muscle within one half of the trunk is significantly larger in fish incubated at 16°C than in fish incubated at either 8.5°C or 13°C (p<0.01 each, Fig. 3A) which have similar fast muscle csa. At 40 dph, 16°-fish continue to be the largest in fast muscle size, but the differences to the other thermal groups are no longer statistically significant. A changed situation is present at 82 dph, when 16°-fish fast muscle csa is smaller than that of both other groups and 8.5°-fish transiently exhibit largest values. Further development is characterised by a long-lasting surge of fast muscle growth in the 13°-fish which attain the largest fast muscle size at late juvenile stage (195 dph, p<0.001) and keep it until yearling stage (360 dph, p<0.001). By contrast, the 8.5°-fish at these two stages exhibit the smallest fast muscle csa. In other terms, the increase in fast muscle mass experienced by the thermal groups in the time between hatching and 360 dph is 171-fold for 13°-fish, 135-fold for 8.5°-fish, but only 84-fold for 16°-fish.
Fig. 3.
Development of muscle mass. (A) Total cross-sectional area (csa) of fast muscle in one half of the trunk. (B) Total slow muscle csa in one half of the trunk; differences between thermal groups are significant at p≤0.01 (**) and p≤0.05 (*) (Fisher’s LSD test). (C) Correlation of slow muscle relative proportion (fast-to-slow muscle ratio) with fish size as given by total muscle csa; regression line equations: 8.5°C: y = 8.19x + 17.49 (r2 = 0.93, p<0.01), 13°C: y = 7.32x + 16.70 (r2 = 0.88, p<0.01), 16°C: y = 7.71x + 17.24 (r2 = 0.87, p<0.01).
Similar to fast muscle, slow muscle csa at hatching is larger in the 16°-fish than in the 13°- and 8.5°-fish (p=0.01 for 13°-fish but n.s. for 8.5°-fish, Fig. 3B). At 40 and 82 dph, there are no significant differences between the slow muscle csa of the temperature groups. At 195 and 360 dph, largest slow muscle csa is found in the 13°-fish. This means that the increase of slow muscle mass between hatching and 360 dph is 41-fold in 13°-fish, but only 28-fold and 25-fold in 8.5°-fish and 16°-fish, respectively. The relatively low increase in 8.5°-fish corresponds to the observation that these fish have a very high proportion of slow muscle at hatching, a typical effct of cold acclimation in cyprinids (Stoiber et al., 2002). This is also reflected by the low fast-to-slow muscle ratio of the 8.5°-fish at hatching (Fig. 3C). Regression lines of fast-to-slow ratio data of the whole investigating period lie close together with only little difference in slope. No statistically significant differences occurred between either fast or slow muscle csa from the epaxial and hypaxial quadrants in all fish analysed (not shown).
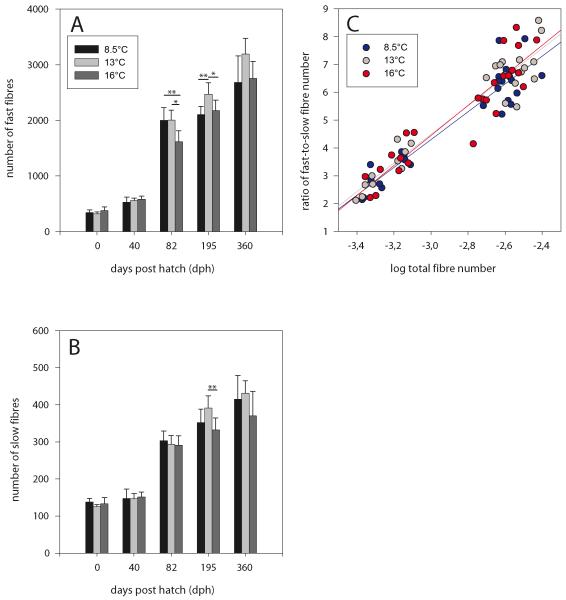
The second determinant of muscle cellularity, muscle fibre number, evolved along a roughly similar course. At hatching and at 40 dph, there is a trend for higher fast fibre numbers in the 16°-fish (Fig. 4A), although without statistical significance. A clear increase in fast fibre numbers is then seen in all temperature groups at 82 dph when mosaic hyperplasia had begun. This development is about equally intense in 8.5° and 13°-fish, but clearly weaker in 16°-fish. From 195 dph onwards until the end of the investigation, fast fibre numbers of 13°-fish are always higher than those of the two other thermal groups (Figs. 4A). Increase in fast fibre number over the entire period investigated (from hatching to 360 dph), taken as a measure of hyperplastic growth intensity, is 10.0-fold for 13°-fish (corresponding to an increase of 8.0 fibres/day), but only 7.8-fold for 8.5°-fish (6.5 fibres/day) and 7.3-fold for 16°-fish (6.6 fibres/day). In contrast to fast fibres, slow fibre numbers exhibited almost no differences between thermal groups in the time from hatching to 82 dph (Fig. 4B). The course of quantitative development of these fibres was also similar for the three groups, with stagnant values until 40 dph followed by a sharp increase afterwards. Juveniles at 195 dph and yearlings at 360 dph then both showed highest slow fibre numbers in the 13°C group. Plotting the ratio of fast/slow fibre number against total fibre number demonstrates an almost similar course of the numeral development of the two fibre types in the thermal groups (Fig. 4C). A minor divergence is only seen with the 8.5°-fish which have a slightly higher proportion of slow fibres in large fish.
Fig. 4.
Relationship between total fibre number in one half of the trunk and developmental time. (A) Fast fibres, (B) slow fibres; differences between thermal groups significant at p≤0.01 (**) and p≤0.05 (*) (Fisher’s LSD test). (C) Correlation of fast-to-slow fibre number ratio with total fibre number; regression line equations: 8.5°C: y = 5.00x + 19.31 (r2 = 0.88, p<0.01), 13°C: y = 5.16x + 19.99 (r2 = 0.91, p<0.01), 16°C: y = 5.42x + 20.71 (r2 = 0.86, p<0.01).
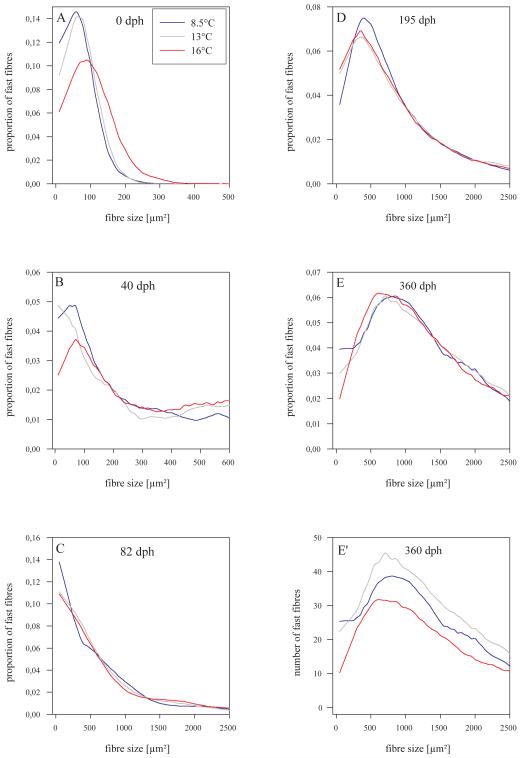
Smooth distributions of proportional fast fibre amounts within size (csa) classes show that 16°-fish have clearly more larger fibres at hatching (peak density at 100 μm2) than the fish of both other thermal groups (peak densities at 60-70 μm2, Fig. 5A). During ongoing development, these distributions become quite similar for all groups, except that there are more small fibres ≤ 50 μm2 in 8.5°- and 13°-fish than in 16°-fish in most of the stages (Fig. 5B-E) (fibres ≤ 50 μm2 assumed to be recently formed, upper delimitation of size category arbitrary). At the end of the investigated period (360 dph), proportional data continue to indicate similar trends for all three groups (Fig. 5E) while plotting of absolute fibre numbers per size class shows that 13°-fish have the most fibres along almost the entire size range, only the smaller fibres (≤ 50 μm2) are more abundant in 8.5°-fish (Fig. 5E’). By contrast, 16°-fish have generally the fewest fibres, indicating lowest rates of both hypertrophy and hyperplasia.
Fig. 5.
Smooth distributions of fast fibre csa of the developmental stages investigated. Amounts of fibres in csa classes are plotted in relative numbers (proportion of total number) in A-E, but in absolute numbers in E’. Curves were fitted to the data points by a Sigma Plot 9-based local smoothing technique using polynomial regression and weigths computed from the Gaussian density function.
Numbers of small fibres ≤ 50 μm2 were also taken as a measure to specifically examine how the influence of thermal imprinting is distributed among the stratified and mosaic hyperplastic growth modes. This was undertaken separately within the three fast muscle zones defined in Fig. 1 whereby stratified growth is represented in the apical and lateral zones, mosaic growth in the central zone. Results demonstrate that at hatching, a small surplus of such fibres was allocated to the 16°-fish in the apical growth zone, and to the 8.5°-fish in the lateral growth zone (Fig. S1A,B). In the central zone, small fibre numbers of both 8.5°- and 13°-fish are clearly ahead of those of 16°-fish (p<0.01 each, Fig. S1C). In terms of relative amounts, 16°-fish contained lower proportions of fibres ≤ 50 μm2 in all three zones (apical: 87,9%; lateral: 91.6%, central: 39.7%) than 8.5°- and 13°-fish (apical: 97,3% and 97,2%; lateral: 98.7% and 99.1%; central: 76.7% and 70.7%). During subsequent development, fast fibre formation in the apical zone turned out to be widely unaffected by effects that could be attributed to thermal history. This except for the 82 dph stage, at which 8.5°-fish launched a sudden and conspicuous surge of small fibres which finds no parallel in the 13°- and 16°-fish (p=0.02 and p<0.01, respectively, Fig. S1A-C). A clearly different situation is encountered when the lateral zone is analysed. In this zone, there is a clear trend towards less small fibres in the 16°-fish than in the 8.5°- and 13°-fish. Similar to the apical zone, 8.5°-fish show a boost of fast fibre recruitment at 82 dph which is, however, followed by a prominent decline at 195 dph. In most stages, the lowest numbers of fibres ≤ 50 μm2 in the central zone are observed in the 16°-fish while highest numbers are with one exception always found in the 8.5°C-fish (Fig. S1C). Note that bars in Fig. S1C from the 82 dph stage onwards only represent fibre numbers from a dorso-ventral transect (see Fig. 1). Note also that transect-derived numbers at the 82 dph stage are higher than those from full-myotome measurement at 40 dph, thus indicating a period of intense mosaic hyperplasia in the period in between.
To specifically enquire about slow muscle hyperplasia, numbers of small fibres ≤ 50 μm2 were separately analysed in the whole slow fibre layer until 40 dph and separately for two distinct zones (central, apical, see Fig. 1) in all following stages. From this it emerged that the fish of the 8.5°C group tended to have more small slow fibres than the fish of the other two thermal groups throughout the experiment. Zonal evaluation in the more advanced stages rendered the same trend, quite homogeneously in the central zone and most distinctly in the apical zone at 195 dph (p<0.01 for 8.5°- vs. 16°-fish, Fig. S1D,E).
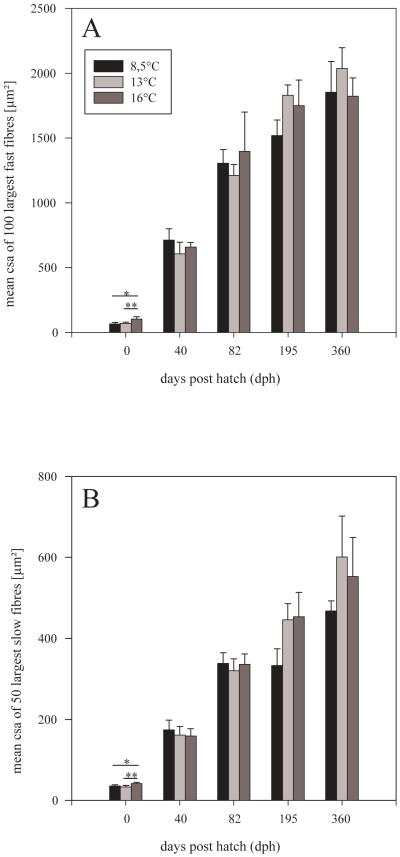
Mean csa of the 100 largest fast muscle fibres within one half of the trunk served as a measure of hypertrophy. Using this measure, it was found out that the 16°-fish were clearly ahead of the 13°- and 8.5°-fish at hatching (p=0.01 each, Fig. 6A). However, this advance was subsequently compensated for by enhanced fast fibre growth in both of the latter groups, resulting in the situation that the largest ‘100 largest’ fast fibres at 195 dph and 360 dph then occurred in the 13°-fish. Size increase of these 100 largest fibres between hatching and 360 dph, taken as a measure of hypertrophic growth intensity, was 27.7-fold for 8.5°-fish (corresponding to an increase in mean fibre size of 5.0 μm2/d), 29.3-fold for 13°-fish (5.5 μm2/d), but only 17.5-fold for 16°-fish (4.8 μm2/d).
Fig. 6.
Relationship between mean size of largest fibres (csa + s.d.) and developmental time. (A) the 100 largest fast fibres, (B) the 50 largest slow fibres; intergroup differences significant at p≤0.01 (**) and p≤0.05 (*) (Fisher’s LSD test).
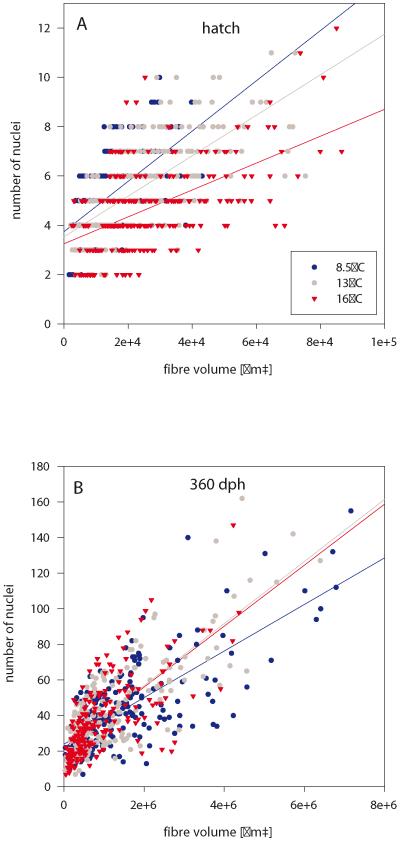
Analyses of myonuclear density reveal that at hatching, the 16°-fish had a lower nuclei/volume ratio than 13°- and 8.5°-fish (Fig. 7A). Thus, at the end of the imprinting period, 16°-fish had less nuclei per given volume (or larger fibres per given number of nuclei), i.e. larger nuclear domains than the fish of the two other thermal groups. Similar to ‘largest fibre’ development, this situation became inverted during the post-imprinting period, with lowest nuclei/volume ratios being obtained in the 8.5°-fish of all further stages investigated until 360 dph (Fig. 7B).
Fig. 7.
Myonuclear densities of isolated fast fibres. Relationship of nuclei/fibre volume at hatching (A) and 360 dph (B). Images exemplify nuclei visualisation in isolated single fast muscle fibres of 13°-fish using Hoechst 33258. Scale bars: 100 μm. Regression line equations: (A) 8.5°C: y = 1.02x + 3.74 (r2 = 0.36, p<0.01), 13°C: y = 8.21x + 3.54 (r2 = 0.48, p<0.01), 16°C: y = 5.46x + 3.25 (r2 = 0.29, p<0.01); (B): 8.5°C: y = 1.31x + 24.00 (r2 = 0.55, p<0.01), 13°C: y = 1.74x + 21.94 (r2 = 0.66, p<0.01), 16°C: y = 1.71x + 21.72 (r2 = 0.48, p<0.01).
The 50 largest fibres within the slow muscle of one half of the trunk were measured to determine slow muscle hypertrophy. Similar to fast fibres, hypertrophy at hatching was most advanced in the 16°-fish (p<0.01 vs. both other groups, Fig. 6B). Subsequently, a spell without significant differences in the larval period (40 and 82 dph) gave rise to a phase with reduced large slow fibre hypertrophy in the 8.5°-fish which lasted until the end of the investigation (p<0.01 vs. 13°- and 16°-fish at 195 dph; ANOVA test only at p=0.07 at 360 dph).
Muscle precursor cells
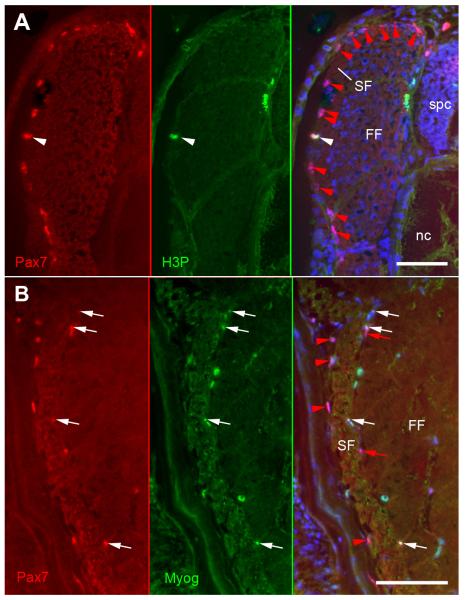
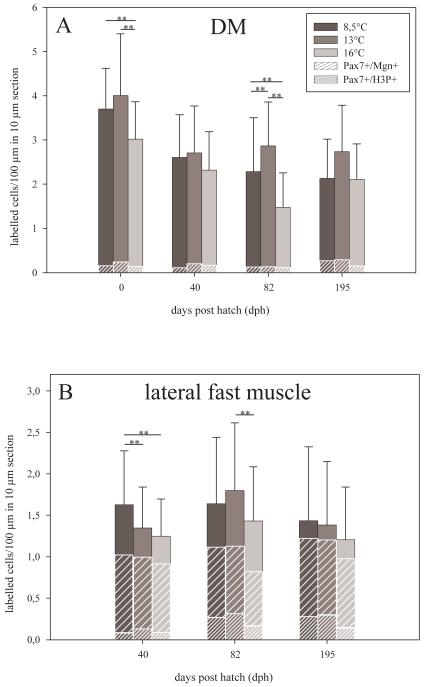
Molecular tracing of MPCs was undertaken to assess how patterns of precursor cell behaviour correlate with those of the temperature-induced modulation of cellularity. MPCs were detected by immunolabelling for Pax7+, a reliable and currently most widely used marker of such cells in vertebrates (eg. Buckingham and Relaix, 2007). Co-staining for H3P served to assess whether thermal history also affects the mitotic activity of these cells. All data are given in relative numbers (labelled cells per 100 μm of myotome cross sectional length). Results demonstrate that by the time of hatching, Pax7+ MPCs almost exclusively occurred within the DM epithelium constituting the lateral covering of the myotomes’ slow muscle layer (hence, cell counts at this stage were confined to the DM of one trunk quadrant, see also Fig. 8A). Highest numbers of Pax7+ MPCs were found in in the DM of the 13°-fish (p<0.01 vs. 16°-fish, Fig. 9A), 16°-fish contained the lowest numbers (p<0.01 vs. 8.5°- and 13°-fish). Double-immunolabelling for Pax7 and H3P shows that the DM of the 13°-fish also harbours the largest fraction of proliferating (Pax7+/H3P+) MPCs (6.5% as compared to 4.4% and 4.5% recorded in the 16°- and 8.5°-fish, respectively). Note that differentiating (Pax7+/Mgn+) MPCs within the DM were only rarely observed and not quantified. Immunostaining results further reveal that throughout the larval and juvenile periods, Pax7+ cells continue to reside at the position of the previous DM layer (i.e. along the lateral surface of the myotome) (Fig. 8B). Similar to the hatching stage, such cells were most present in the 13°-fish and least present in the 16°-fish, with 8.5°-fish exibiting intermediate values throughout the investigated period (Fig. 9A). In contrast to hatching stage, relative numbers of H3P+ (mitotically active) Pax7+ cells at the original DM site did no longer significantly vary between the three thermal groups, indicating that proliferation kinetics of such residual DM cells are directly temperature-dependent rather than pre-determined by thermal imprinting.
Fig. 8.
Lateral myotome images from sections immunostained for Pax7 (red) illustrating MPC assessment. (A) 8.5°-fish at hatching, section co-stained for H3P (green) to test for mitotically active Pax7+ cells (white arrowheads). Note that all Pax7+ cells (arrowheads) are exclusively located at the site of the previous DM. (B) 13°-fish at 195 dph, section co-stained for Mgn (green) to test for Pax7+ cells entering myogenic differentiation (white arrows). Note that Pax7+ cells occur in both the area of the previous DM (arrowheads) and the lateral fast muscle (arrows). Nuclei are counterstained with Hoechst 33258. FF fast fibres, nc notochord, SF slow fibres, spc spinal cord. Scale bars: 50 μm.
Fig 9.
Quantification of muscle precursor cells (MPCs) in double-immunostained 10 μm myotomal cross-sections for the developmental period from hatching to 195 dph. (A) Numbers of total Pax7+ cells and of Pax7+/H3P+ cells at the site of the previous dermomyotome (DM) per 100 μm distance in the section plane. (B) Percentages of Pax7+ cells in the lateral fast muscle growth zone that have entered proliferation (Pax7+/H3P+) or differentiation (Pax7+/Mgn+). Intergroup differences significant at p≤0.01 (**) and p≤0.05 (*), means + s.e.
From 40 dph onwards, immunostaining demonstrates that Pax7+ MPCs also occur within the lateral fast muscle growth zone beneath the slow muscle layer (Fig. 8B), a main target of MPC translocation from the DM (Steinbacher et al., 2008, Marschallinger et al., 2009). Results conform with the above findings for non-translocated (DM-residing) MPCs in that the lowest numbers of Pax7+ cells always occurred in the 16°-fish (not shown). Co-staining for H3P served to analyse whether the early thermal experience of the fish influences MPC proliferation at this site. The H3P+ subpopulation of these cells failed to vary between groups at 40 dph, but did so at 82 and 195 dph when Pax7+/H3P+ cells were clearly less numerous in 16°-fish than in the other groups (22.4%, 15.1% and 9.7% at 82 dph, and 14.4%, 17.7% and 9.3% at 195 dph for 8.5°, 13° and 16°-fish, respectively, Fig. 9B). Note that, due to the absence of Pax7+ cells in the central areas of the myotomes, no conclusions can be drawn concerning MPC behaviour behind the observed imprinting responses of the mosaic growth mode (see cellularity results).
Double-immunolabelling for Pax7 and Mgn served to trace a possible influence of thermal imprinting on the differentiation of lateral fast muscle MPCs. Highest relative amounts of Pax7+/Mgn+ cells were found in the 16°-fish at 40 and 82 dph (49.7%, 54.9% and 58.5% at 40 dph, and 36.2%, 39.3% and 42.3% at 82 dph for 8.5°, 13° and 16°-fish, respectively, Fig. 9B), while no relevant inter-group differences in content of such differentiating cells were detected later on, at 195 dph (74.1%, 71.7% and 71.6%).
Provided that differentiating (Mgn+) MPCs are not at the same time dividing (H3P+) MPCs (highly likely but not tested in the present study), the ratio of such cells (percentage Pax7+/H3P+ divided by percentage Pax7+/Mgn+) provides further valuable indication as to the modulatory effects exerted by thermal imprinting on the proliferation/differentiation balance of the MPCs. At 40, 82 and 195 dpf, these ratios are 0.14, 0.19 and 0.13 for 16°-fish, but 0.23, 0.38 and 0.24 for 13°-fish, and 0.15, 0.63 and 0.19 for the 8.5°-fish. This suggests that in the developmental period from 40 to 195 dpf, the differentiation/proliferation equilibrium of Pax7+ cells in 16°-fish lies stably further towards differentiation than in 13°-fish, while it runs a marked back-and-forth course with a prominent shift towards proliferation at 82 days in 8.5°-fish (Fig. 9B).
Discussion
The present study demonstrates clearly that the European pearlfish is susceptible to thermal imprinting which exerts a variety of effects on body growth and muscle cellularity that persist into adult life and are, in slightly different ways, already known from other species.
The most readily identifyable among these effects is certainly that differences in fish size between thermal groups arising during the imprinting period become, to varying extents, compensated for in post-imprinting life under similar thermal conditions (Fig. 2). In the pearlfish, this lead to the situation that animals reared at 16°C, being significantly larger and exhibiting more muscle mass (fast and slow muscle csa) at hatching, were subsequently smaller than the fish of both other groups whereby the 13°-fish proved most efficient in generating catch-up growth, followed by the 8.5°-fish (Figs. 2,3).
This macroscopic effect is reflected by the development at the cellularity level. Also here, the 16°-fish are characterized by largest fast and slow fibres and highest overall numbers of fast fibres at hatching, before the 8.5°-fish and especially the 13°-fish catch up with them or surpass them in all relevant variables (Figs. 4-7). However, combined analysis of fibre size distributions and myonuclear densities (Figs. 5,7) reveals that the advanced fast fibre hypertrophy in 16°-fish at hatching comes along with larger nuclear domains indicated by reduced myonuclear density. Assuming that the nuclear domains of these fish are to some extent ‘elastic’ (cf. Brack et al., 2005), this can be interpreted in two ways: (i) imprinting at 16°C favours instant utilisation of this elasticity without requirement of enhanced nuclear uptake from MPCs while imprinting at lower temperatures has no such effect; (ii) warm imprinting reduces MPC availability for fusion to growing fibres thus enforcing early nuclear domain expansion. While the present data do not allow to finally answer this question, all this entails that muscle precursor cells of 16°-fish until hatching have a higher differentiation rate than those of their colder reared counterparts. This enables these fish to run hypertrophy and hyperplasia most efficiently as long as the direct impact of warm rearing is present. However, this advantage cannot be permanently sustained under the aligned thermal conditions later on, when the 13°- and 8.5°-fish succeed to achieve catch-up growth, although based on different cellular mechanisms. 13°-fish perform a combined strong up-regulation of both fast fibre hypertrophy (29.3-fold increase in size of 100 largest fibres) and hyperplasia (10.0-fold increase in fibre number). 8.5°-fish, by contrast, favour fast fibre hypertrophy (27.7-fold increase) while hyperplasia is moderate (6.5-fold increase in fibre number). These different mechanisms conform with those of other fish from temperate habitats, eg. Atlantic salmon (Nathanailides et al., 1995), herring (Johnston et al., 1998) and haddock (Martell and Kiefer, 2007), thus suggesting that the imprinting responses of muscle cellularity of such fish follow a common trend: cold-imprinting favours hypertrophy over hyperplasia, warm-imprinting favours hyperplasia over hypertrophy, imprinting at intermediate temperatures fosters both. A different developmental course is also apparent in relation to fast fibre nuclei/volume ratios. These ratios are about similar for 13°- and 16°-fish, but as 13°-fish have much larger fibres they acquired more nuclear uptake from the MPC pool to keep their nuclear domains at the same size as the 16°-fish. By contrast, the clearly lower ratios of 8.5°-fish at this developmental stage indicate that their fast fibre hypertrophy preferentially utilises the nuclei already stockpiled within the fibres and thus occurs at the cost of domain expansion (as in 16°-fish at hatching). Interestingly, these diverging response patterns of nuclear domains bear some resemblance with those found in thermally ‘imprinted’ (warm vs. ambient-reared) Atlantic salmon (Johnston et al., 2003), specifically if larger domains were a long-term consequence of sub-optimal thermal imprint (i.e. cold in pearlfish, but warm in salmon).
Regarding the question whether the slow muscle plays a role on its own in the imprinting responses of the teleost muscle, the present data show clearly that this is not the case. Slow muscle trends are broadly similar to fast muscle trends in terms of both overall mass and cellularity, thus leaving the relative proportion of the slow muscle compartment (fast/slow-ratio) largely unaffected (Fig. 3).
As to the question whether cellularity responses to thermal imprinting involve relevant shifts of muscle cell recruitment between myotomal growth zones (lateral, apical and central), the present data show that this is clearly not the case (Fig. S1). Before the background that teleost MPCs have been shown to be heterogeneous as to their origin, location and molecular regulation (eg. Devoto et al., 1996; Barresi et al., 2001; Groves et al., 2005; Marschallinger et al., 2009), this provides indication that all different types of MPCs potentially present in the myotome are equally influenced by thermal history.
Results from immunostaining for Pax7, H3P and Mgn together with morphometric analyses suggest that the driving forces behind the cellularity differences include two mechanisms at the MPC level: One is influence on the proliferation behaviour of MPCs during the imprinting period, with the consequence that 13°-fish at hatching are furnished with the highest amounts of residual Pax7+ cells and proliferating Pax7+/H3P+ cells within the DM while 16°-fish have lowest amounts (Fig. 8A). The second is influence on the differentiation behaviour of the MPCs. This seems to come into operation already during the imprinting period, entailing that 16°-fish have more muscle fibres at hatching than 13°-fish (Fig. 4, see above). Perhaps more importantly, the present results provide clear indication that thermal imprinting exerts a lasting effect on MPC proliferation in the lateral fast muscle domains of the post-hatching stages. At this known site of MPC accumulation (Steinbacher et al., 2008; Marschallinger et al., 2009), the proliferation/differentiation balance of the Pax7+ MPCs is shifted towards proliferation in 13°-fish (and partly also in 8.5°-fish) but not in 16°-fish (Fig. 9B).
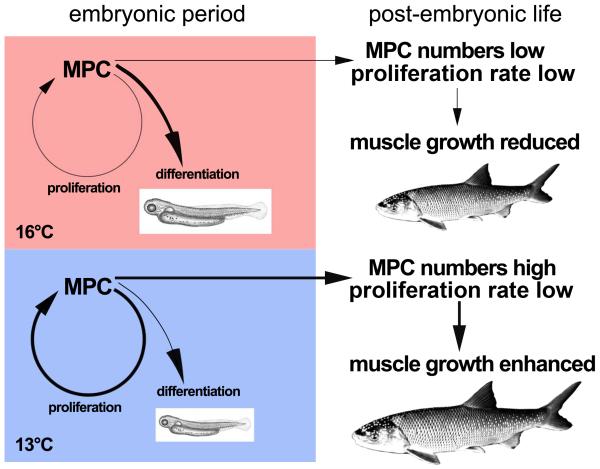
Together this suggest that the DM-derived Pax7+ MPCs of the warm-reared 16°-animals tend to reduce proliferation in favour of early differentiation, resulting in limited MPC reserves employable for further growth, and finally in smaller muscle mass and total body size (Fig. 10). An inverse trend is displayed by the 13°-fish and, to a lesser extent, also in the 8.5°-fish. These animals exhibit more intense MPC proliferation generating sustained reserves that provide them with a higher muscle growth potential than available in 16°-fish (cf. amounts of Pax7+/Mgn+ at hatching and 195 dph, Fig. 9B) and to finally attain larger muscle mass and total size. All this is in concordance with evidence from two studies of Atlantic salmon suggesting that densities of c-met+ MPCs in juvenile fast muscle are highest when the embryos are imprinted within an ‘optimum thermal range’, while colder conditions and heating experiments lead to reduced densities (Johnston et al., 2000, 2003).
Fig. 10.
Diagram summarising and explaining the main results of the present study at the MPC level. Warm-imprinted (16°C) pearlfish embryos tend to reduce MPC proliferation in favour of early differentiation. This generates large and massive hatchlings but leaves only limited MPC reserves with reduced proliferative activity for further growth, finally resulting in smaller adults. Embryos imprinted at medium temperature (13°C) and, to a lesser extent, also the cold-imprinted (8.5°C) embryos tend to enhance MPC proliferation at the cost of early differentiation. This leads to smaller hatchlings but ongoing proliferation allows for sustained MPC reserves to compensate for the initially delayed growth, finally resulting in larger adults.
Together this demonstrates that pearlfish are clearly best conditioned for post-hatching growth if the embryos are imprinted at moderate (medium, non-extreme) temperatures (in this case 13°C) with respect to the species’ range of embryonic thermal tolerance and natural spawning site conditions (Kainz and Gollmann, 1997; Siligato and Gumpinger, 2005). Only the second best result is achieved from cold-rearing at 8.5°C, a temperature not sustainable during immediate posthatching development (Kainz and Gollmann, 1997). By contrast, fish imprinted at 16°C, the value previously regarded as favourable for efficient rearing of the species (Kainz and Gollmann, 1997), exhibit the lowest muscle growth potential. This provides support for a type of response to thermal imprinting that may indeed be more widespread among teleost species than judged on first impression. This because particularly some of the earlier studies on the issue suggest that, for example, enhanced hyperplasia of the dominant fast muscle tissue in the larval and/or juvenile period is promoted by either rather cold (Nathanilides et al., 1995; Johnston et al., 2003; Albokhadaim et al., 2007) or rather warm (Martell and Kieffer, 2007; Galloway et al., 1999) rearing during the embryonic period. However, more recent studies rather conform to the present pearlfish data. In zebrafish adults that had been imprinted at 22, 26 and 31°C, final fast fibre numbers showed an optimum in the 26°-group (Johnston et al., 2009), and in Atlantic salmon imprinted at 2, 5, 8 and 10°C, fast fibre number at onset of smoltification was highest in the 5°-group (Macqueen et al., 2008).
In a more general sense, the present study reveals that the degree of variation between pearlfish groups in response to thermal imprinting is much lower than in Atlantic salmon as demonstrated by the study of Albokhadaim et al. (2007) which certainly reports some of the strongest imprinting effects measured to date. This raises the question whether the responsiveness of teleost embryos to thermal imprinting may simply vary between species or even populations (cf. Johnston et al., 2000), or whether the responses may also (and perhaps strongly) depend on the thermal conditions chosen for post-imprinting development. If the latter is true, then equilibration to moderate temperature levels with respect to the species’ range of thermal tolerance (as in the present study) may allow for only limited moderate patterns of modulation. These responses may then differ from the much more vigorous ones achieved when warm-imprinted embryos are downcooled to the thermal level of the cold-reared batch (Albokhadaim et al., 2007). Further research will be required to examine how exactly the imprinting response of the teleost muscle depends upon the nature of the post-imprinting thermal environment. Testing of species (or even populations) in this direction appears certainly useful and necessary in the economic, phylogenetic and not the least, in the climatic context.
Supplementary Material
Acknowledgements
We thank Synnoeve Tholo (University of Salzburg, Austria) and Hans-Peter Gollmann (BAW Scharfling, Mondsee, Austria) for their excellent technical support. Special thanks go to Albert Jagsch (BAW Scharfling, Mondsee, Austria) for “making the whole thing possible”. The work was supported by Austrian Science Foundation (FWF) grant P20430.
List of symbols and abbreviations
- csa
cross sectional area
- DM
dermomyotome
- dph
days post hatching
- H3P
phosphohistone H3
- Mgn
Myogenin
- MPC
muscle precursor cell
- Pax7
paired box transcription factor 7
- SL
standard length
References
- Alami-Durante H, Olive N, Rouel M. Early thermal history significantly affects the seasonal hyperplastic process occurring in the myotomal white muscle of Dicentrarchus labrax juveniles. Cell Tissue Res. 2007;327:553–570. doi: 10.1007/s00441-006-0321-2. [DOI] [PubMed] [Google Scholar]
- Albokhadaim I, Hammond CL, Ashton C, Simbi BH, Bayol S, Farrington S, Stickland N. Larval programming of post-hatch muscle growth and activity in Atlantic salmon (Salmo salar) J. Exp. Biol. 2007;210:1735–1741. doi: 10.1242/jeb.003194. [DOI] [PubMed] [Google Scholar]
- Barresi MJF, D’Angelo JA, Hernández LP, Devoto SH. Distinct mechanisms regulate slow-muscle development. Curr. Biol. 2001;11:1432–1438. doi: 10.1016/s0960-9822(01)00428-6. [DOI] [PubMed] [Google Scholar]
- Böck P. Der Semidünnschnitt. J. F. Bergmann publishers; Munich: 1984. p. 172. [Google Scholar]
- Brack AS, Bildsoe H, Hughes SM. Evidence that satellite cell decrement contributes to preferential decline in nuclear number from large fibres during murine age-related muscle atrophy. J. Cell Sci. 2005;118:4813–4821. doi: 10.1242/jcs.02602. [DOI] [PubMed] [Google Scholar]
- Buckingham M, Relaix F. The role of Pax genes in the development of tissues and organs: Pax3 and Pax7 regulate muscle progenitor cell functions. Annu. Rev. Cell Dev. Biol. 2007;23:645–673. doi: 10.1146/annurev.cellbio.23.090506.123438. [DOI] [PubMed] [Google Scholar]
- Devoto SH, Stoiber W, Hammond CL, Steinbacher P, Haslett JR, Barresi MJF, Patterson SE, Adiarte EG, Hughes SM. Generality of vertebrate developmental patterns: evidence for a dermomyotome in fish. Evol. Dev. 2006;8:101–110. doi: 10.1111/j.1525-142X.2006.05079.x. [DOI] [PMC free article] [PubMed] [Google Scholar]
- Egginton S, Sidell BD. Thermal acclimation induces adaptive changes in subcellular structure of fish skeletal muscle. Am. J. Physiol. 1989;256:1–9. doi: 10.1152/ajpregu.1989.256.1.R1. [DOI] [PubMed] [Google Scholar]
- Galloway TF, Kjorsvik E, Kryvi H. Effect of temperature on variability of axial muscle development in embryos and yolk sac larvae of the Northeast Arctic cod (Gadus morhua) Mar. Biol. 1998;132:559–567. [Google Scholar]
- Galloway TF, Kjorsvik E, Kryvi H. Muscle growth in yolk-sac larvae of the Atlantic halibut as influenced by temperature in the egg and yolk-sac stage. J. Fish Biol. 1999;55:26–43. [Google Scholar]
- Gros J, Manceau M, Thome V, Marcelle C. A common somitic origin for embryonic muscle progenitors and satellite cells. Nature. 2005;435:954–958. doi: 10.1038/nature03572. [DOI] [PubMed] [Google Scholar]
- Groves JA, Hammond CL, Hughes SM. Fgf8 drives myogenic progression of a novel lateral fast muscle fibre population in zebrafish. Development. 2005;132:4211–4222. doi: 10.1242/dev.01958. [DOI] [PubMed] [Google Scholar]
- Hollway GE, Bryson-Richardson RJ, Berger S, Cole NJ, Hall TE, Currie PD. Whole-somite rotation generates muscle progenitor cell compartments in the developing zebrafish embryo. Dev. Cell. 2007;12:207–219. doi: 10.1016/j.devcel.2007.01.001. [DOI] [PubMed] [Google Scholar]
- Johnston IA. Muscle development and growth: potential implications for flesh quality in fish. Aquaculture. 1999;177:99–115. [Google Scholar]
- Johnston IA. Environment and plasticity of myogenesis in teleost fish. J. Exp. Biol. 2006;209:2249–2264. doi: 10.1242/jeb.02153. [DOI] [PubMed] [Google Scholar]
- Johnston IA, Hall TE. Mechanisms of muscle development and responses to temperature change in fish larvae. Am. Fish. Soc. Symp. 2004;40:85–116. [Google Scholar]
- Johnston IA, Cole NJ, Abercromby M, Vieira VLA. Embryonic temperature modulates muscle growth characteristics in larval and juvenile herring. J. Exp. Biol. 1998;201:623–646. doi: 10.1242/jeb.201.5.623. [DOI] [PubMed] [Google Scholar]
- Johnston IA, McLay HA, Abercromby M, Robins D. Early thermal experience has different effects on growth and muscle fibre recruitment in spring- and autumn-running Atlantic salmon populations. J. Exp. Biol. 2000;203:2553–2564. doi: 10.1242/jeb.203.17.2553. [DOI] [PubMed] [Google Scholar]
- Johnston IA, Manthri S, Alderson R, Smart A, Campbell P, Nickell D, Robertson B, Paxton CM, Burt LM. Freshwater environment affects growth rate and muscle fibre recruit-ment in seawater stages of Atlantic salmon (Salmo salar L.) J. Exp. Biol. 2003;206:1337–1351. doi: 10.1242/jeb.00262. [DOI] [PubMed] [Google Scholar]
- Johnston IA, Lee H-T, Macqueen DJ, Paranthaman K, Kawashima C, Anwar A, Kinghorn JR, Dalmay T. Embryonic temperature affects muscle fibre recruitment in adult zebrafish: genome-wide changes in gene and microRNA expression associated with the transition from hyperplastic to hypertrophic growth phenotypes. J. Exp. Biol. 2009;212:1781–1793. doi: 10.1242/jeb.029918. [DOI] [PubMed] [Google Scholar]
- Kainz E, Gollmann HP. Beiträge zur Biologie und Aufzucht des Perlfisches Rutilus frisii meidingeri (Nordmann) Öst. Fisch. 1997;50:91–98. [Google Scholar]
- Karnovsky MJ. A formaldehyde-glutaraldehyde fixative of high osmolarity for use in electron microscopy. J. Cell Biol. 1963;27:137A–138A. [Google Scholar]
- Macqueen DJ, Robb DHF, Olsen T, Melstveit L, Paxton CGM, Johnston IA. Temperature until the ‘eyed stage’ of embryogenesis programmes the growth trajectory and muscle phenotype of adult Atlantic salmon. Biol. Lett. 2008;4:294–298. doi: 10.1098/rsbl.2007.0620. [DOI] [PMC free article] [PubMed] [Google Scholar]
- Marschallinger J, Obermayer A, Sänger AM, Stoiber W, Steinbacher P. A novel mechanism of proliferative Pax7+ cell immigration accounts for postembryonic fast muscle growth in teleost fish. Dev. Dyn. 2009;238:2442–2448. doi: 10.1002/dvdy.22049. [DOI] [PMC free article] [PubMed] [Google Scholar]
- Martell DJ, Kieffer JD. Persistent effects of incubation temperature on muscle development in larval haddoch (Melanogrammus aeglefinus L.) J. Exp. Biol. 2007;210:1170–1182. doi: 10.1242/jeb.002188. [DOI] [PubMed] [Google Scholar]
- Nathanailides C, Lopez-Albors O, Stickland NC. Influence of prehatch temperature on the development of muscle cellularity in posthach Atlantic salmon (Salmo salar) Can. J. Fish. Aquat. Sci. 1995;52:675–680. [Google Scholar]
- Relaix F, Rocancourt D, Mansouri A, Buckingham M. A Pax3/Pax7-dependent population of skeletal muscle progenitor cells. Nature. 2005;435:948–953. doi: 10.1038/nature03594. [DOI] [PubMed] [Google Scholar]
- Siligato S, Gumpinger C. Der Perlfisch – Eine weltweite zoologische Rarität im Mondsee-Attersee-Gebiet. Öko L. 2005;27:3–9. [Google Scholar]
- Steinbacher P, Haslett JR, Six M, Gollmann HP, Sänger AM, Stoiber W. Phases of myogenic cell activation and possible role of dermomyotome cells in teleost muscle formation. Dev. Dyn. 2006;235:3132–3143. doi: 10.1002/dvdy.20950. [DOI] [PubMed] [Google Scholar]
- Steinbacher P, Haslett JR, Obermayer A, Marschallinger J, Bauer HC, Sänger AM, Stoiber W. MyoD and Myogenin expression during myogenic phases in brown trout: a precocious onset of mosaic hyperplasia is a prerequisite for fast somatic growth. Dev. Dyn. 2007;236:1106–1114. doi: 10.1002/dvdy.21103. [DOI] [PubMed] [Google Scholar]
- Steinbacher P, Stadlmayr V, Marschallinger J, Sänger AM, Stoiber W. Lateral fast muscle fibres originate from the posterior lip of the teleost dermomyotome. Dev. Dyn. 2008;237:3233–3239. doi: 10.1002/dvdy.21745. [DOI] [PMC free article] [PubMed] [Google Scholar]
- Stellabotte F, Dobbs-McAuliffe B, Fernandez DA, Feng X, Devoto SH. Dynamic somite cell rearrangements lead to distinct waves of myotome growth. Development. 2007;134:1253–1257. doi: 10.1242/dev.000067. [DOI] [PubMed] [Google Scholar]
- Stellabotte F, Devoto SH. The teleost dermomyotome. Dev. Dyn. 2007;236:2432–2443. doi: 10.1002/dvdy.21253. [DOI] [PubMed] [Google Scholar]
- Stoiber W, Haslett JR, Wenk R, Steinbacher P, Gollmann HP, Sänger AM. Cellularity changes in developing red and white fish muscle at different temperatures: simulating natural environmental conditions for a temperate freshwater cyprinid. J Exp Biol. 2002;205:2349–2364. doi: 10.1242/jeb.205.16.2349. [DOI] [PubMed] [Google Scholar]
Associated Data
This section collects any data citations, data availability statements, or supplementary materials included in this article.


