Abstract
Objectives
The current study was designed to see how hearing-impaired individuals judge level differences between speech sounds with and without hearing amplification. It was hypothesized that hearing-aid compression should adversely affect the user’s ability to judge level differences.
Design
Thirty-eight hearing-impaired participants performed an adaptive tracking procedure to determine their level-discrimination thresholds for different word and sentence tokens, as well as speech-spectrum noise, with and without their hearing aids. Eight normal-hearing participants performed the same task for comparison.
Results
Level discrimination for different word and sentence tokens was more difficult than the discrimination of stationary noises. Word level discrimination was significantly more difficult than sentence level discrimination. There were no significant differences, however, between mean performance with and without hearing aids, and no correlations between performance and various hearing-aid measurements.
Conclusions
There is a clear difficulty in judging the level differences between words or sentences relative to differences between broadband noises, but this difficulty was found for both hearing-impaired and normal-hearing individuals, and had no relation to hearing-aid compression measures. The lack of a clear adverse effect of hearing-aid compression on level discrimination is suggested to be due to the low effective compression ratios of currently fit hearing aids.
1. INTRODUCTION
The perception of sound level is fundamental to hearing our environment and in treating hearing hearing impairment, from restoring dynamic range to achieving comfortable levels of gain in a hearing aid. The ability to discriminate the levels of different sounds is vital to our perception of the environment (e.g., Coleman, 1963; Brungart & Scott, 2001) as well as communication (e.g., Monrad-Krohn, 1963; Mitchell et al., 2003). The effect of hearing impairment (HI) and amplification on this ability has, however, only been experimentally tested with pure tones or, in rare circumstances, noises. Little is known about how well hearing-impaired populations, with or without hearing aids, judge the level of realistic sounds or how hearing aids affect this ability.
In a questionnaire on auditory disability, Noble and Gatehouse (2006) found that aided participants reported that sounds were perceived much more as being located inside the participant’s head (i.e., internalized) than unaided participants. A possible cause for this internalization problem is the hearing-aid compressor. The hearing-aid compressor, however, is its vital component; it attempts to compensate for the loss in dynamic range. This technology, along with other hearing aid technology (e.g., noise reduction), depends on proper estimations of the acoustic environment. To better inform how hearing aids can make relevant estimations of the levels of everyday sounds, it is necessary to know how the relative levels of everyday sounds are perceived by hearing-aid wearers, and how current hearing aids impact their judgment.
Many of the level discrimination studies to date have been concerned with how normal-hearing (NH) and HI auditory systems are able to encode a wide dynamic range with neurons individually capable of only a narrow range (Viemeister, 1988). These studies have almost exclusively used sinusoids, or amplitude-modulated sinusoids (Fastl & Schorn, 1981), or band-limited noise (Viemeister, 1974; Moore & Raab, 1975). Other studies examined broadband signals, but only steady-state noise (Montgomery, 1935; Miller, 1947; Harris, 1950; Pollack, 1951; Houtsma et al., 1980). In a two-alternative forced-choice procedure, Harris (1950) showed no effect of sensation level (SL) for broadband noise above 5 dB SL, with level-discrimination thresholds relatively constant at 0.6 dB. We know of no published data on level discrimination for speech, either for NH or HI individuals.
There have been many studies on the ability of HI individuals to discriminate the level of two sinusoids (Florentine et al., 1993; Schroder et al., 1994; Baer et al., 2001). Another study included broadband noise as a stimulus (Buus et al., 1995), but none have examined the effect of impairment on the ability to discriminate the level of (non-stationary) complex sounds. Level discrimination thresholds for 500-ms pulsed tones at equal sensation level have been shown to be approximately 1 dB worse for presbycutic HI compared to NH individuals (Fastl & Schorn, 1981). Thresholds for 500-ms broadband noise at roughly equal sensation level, however, have been shown to have negligible differences between HI and NH individuals (0.76 dB for HI at 90 dB SPL compared to 0.86 dB for NH at 63 dB SPL; Buus et al., 1995). Despite the loss of dynamic compression in sensioneural hearing loss, impairment does not result in improved level discrimination performance in general (Hirsh et al., 1954). For both NH and HI populations, binaural intensity-discrimination performance is better than monaural performance (Hall & Fernandes, 1983).
An important and influential study of level discrimination with linear hearing aids was conducted by Robinson & Gatehouse (1996). They used 800-ms tone complexes with fundamental frequency of 125 Hz and half-octave bandwidths centred at 250 and 3000 Hz. The stimuli were presented monaurally over headphones to four HI listeners unilaterally fit with linear hearing aids. Their results showed no effect of linear amplification on level discrimination for the low-frequency complex; for the high-frequency complex, the aided ear showed worse performance at lower sound levels and better performance at higher sound levels. The hearing aids had negligible gain at 250 Hz, so the improved performance at higher levels was considered to be a result of acclimatization to high-frequency amplification (cf. Munro, 2008). This acclimatization benefit at higher frequencies shown by Robinson and Gatehouse (1996) could be lessened by the compressive nature of current hearing-aid amplification, as the level difference between two sounds would be decreased.
A recent study of interaural level discrimination has examined the effect of compressive hearing aids (Musa-Shufani et al., 2006). The nature of each hearing aid’s compressor is broadly defined by three measures: (1) compression ratio (CR), the change in input required for a one-decibel change in output measured by the difference between input and output over a given range, (2) attack time, the time elapsed before the compressor output stabilises following a sudden increase in acoustic level, and (3) release time, the time elapsed before the output stabilises following a sudden decrease in level. Musa-Shufani et al. (2006) showed an effect of CR and attack time on just-noticeable differences (JNDs) in interaural level difference (ILD) using a hearing-aid simulation. NH and HI participants judged whether narrowband (third-octave bandwidth) noises centred at 500 and 4000 Hz presented over headphones were to the left or right of midline in an adaptive task. Stimuli were pre-processed with compression systems with CRs of 1:1 (linear), 3:1 or 8:1, as well as attack times of 2 or 200 ms. The average JNDs in ILD of both low- and high-frequency stimuli for 3:1 and 8:1 compression with a 2-ms attack time increased (i.e., worsened) two- and four-fold, respectively, compared to linear compression for HI participants. There was, though, no significant effect of compression with a 200-ms attack time for HI participants. For NH participants listening to the same hearing-aid simulation, the same compression effects were seen for 500-Hz stimuli, but a larger effect was seen for 4000-Hz stimuli. From the studies of Robinson and Gatehouse (1996) and Musa-Shufani et al. (2006), it can be concluded that increasing CR well above 1:1 (linear amplification) has a detrimental effect on basic level judgments.
It would also be expected that compression should affect a listener’s other level-based perceptions, such as distance. Akeroyd (2010) examined the effects of hearing aids on simulated distance perception. Speech stimuli (a male-talker and female-talker sentence) were presented in a sound-dampened room through an array of loudspeakers, mimicking the reflections from a source at varying distances. HI participants, wearing their own devices, were asked to judge which of the two sentences was perceived as further away. There was no effect found of CR, and no difference in performance compared to a previous study without hearing aids (Akeroyd et al., 2007). Nevertheless, because the stimulus was speech, it is possible that effective CR for these stimuli was lower than the CR measured with tones. Hearing-aid compression is usually measured with pure tones in standardised procedures (ANSI, 2003), but there is evidence that the effective CRs for speech sounds, measured by comparing the dynamic range of the input and output (e.g., Stone & Moore, 1992), are always lower than these nominal or standardised CRs. Several studies have found effective compression to be dramatically less for syllables (Stelmachowicz et al., 1995; Souza & Turner, 1999) and continuous speech (Verschuure et al., 1996; Henning & Bentler, 2008). For example, a hearing aid programmed with a 2:1 standardised CR can result in a 1.2:1 effective CR (Henning & Bentler, 2008). Shorter release times have been hypothesised to result in greater effective (closer to standardised) CRs. In the Akeroyd (2010) study of distance, the median CRs at 1 and 2 kHz were 1.8:1; the effective CRs would be much closer to 1:1. Nevertheless, the effective CRs were equivocal to the standardised CRs, so that if there were any significant correlation with distance JND, it would still be manifest. The lack of correlation was therefore attributed to acclimatisation.
The present study was designed to ascertain the effect of hearing-aid compression on the ability of HI individuals to judge the relative level of speech sounds. An intensity- or level-discrimination task was used with a corpus of mono-syllabic words and another corpus of short sentences, along with stationary (non-fluctuating) noise with speech-like spectra for comparison to the previous literature. Thresholds were estimated using a two-interval adaptive procedure where the level of a standard “pedestal” interval was compared to a test interval presented at pedestal-plus-increment level. This method allows for the adaptive tracking to be more precise than if simply adjusting the difference in level (Grantham & Yost, 1982). Given multiple stimulus conditions and both unaided and aided scenarios, a shorter, interleaved tracking procedure was used (cf. Buus & Florentine, 1991). A roving standard reduced the possible confound of participants trying to detect the same pedestal level across trials as opposed to the desired discrimination of level difference within a trial (Pollack, 1954). Unaided audibility of stimuli was ensured using practice trials; pedestal levels were raised for participants for whom 65 dB (A-weighted) was below 10 dB SL (cf. Harris, 1950). To reduce any immediate learning effects (Amitay et al., 2006), an initial practice block of shorter (500-ms) noise stimuli was used.
To our knowledge, all previous level discrimination studies have been done with headphones, including Robinson and Gatehouse’s linear-amplification study (1996). To allow the hearing aids to react to the stimuli as they would in everyday use, the stimuli in the current study were presented in the free-field. The goal here was not to establish a psychometric function, so psychophysical redundancies (e.g., testing frozen speech tokens) were avoided in favour of different speech tokens from the same corpus. It was expected that hearing aids would decrease performance with stationary noise, but would have little effect on speech – words or sentences – due to the reduced effective CR of conventional hearing aids.
2. METHODS
2.1. Participants
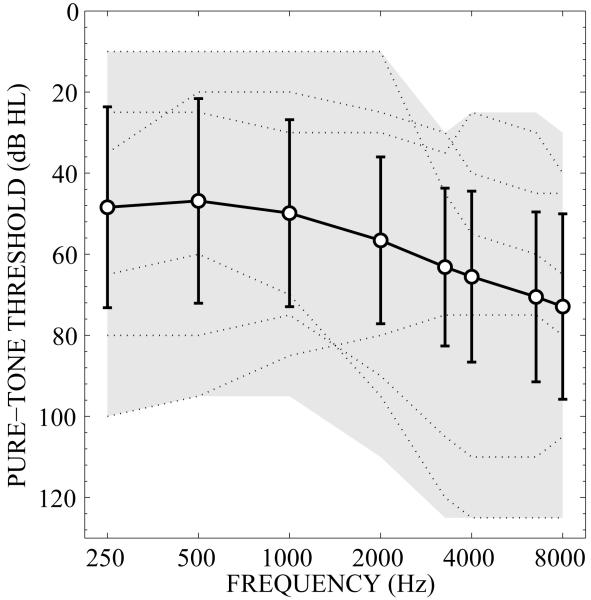
Thirty-eight HI participants (19 females, 19 males) were recruited from the pool of hearing-aid wearers available to the Institute of Hearing Research, sourced from attendees at clinics of the local hospital, postal surveys, and other occasional sources. Thirty one of the participants were fit bilaterally, seven were unilaterally fit. Pure-tone thresholds were assessed using the modified Hughson-Westlake method (British Society of Audiology, 1981). As shown in Figure 1, a wide range of hearing losses were tested from normal-mild to severe-profound; four-frequency pure-tone average hearing losses (4FA) ranged from to 26 to 94 dB HL. The hearing-loss profiles were both flat and sloping. Bone-conduction thresholds for all participants showed impairments to all be primarily sensorineural. The average age was 67.2 years (7.2 years standard deviation). One participant could not perform the task unaided, and another could not perform the task aided; therefore the net number of participants was 37 for all conditions.
Figure 1.
Average pure-tone audiometric thresholds as a function of frequency. Error bars show ±1 standard deviation; shaded area shows range of values. Gray lines show individual audiograms of the three lowest and highest four-frequency average thresholds. Hearing losses varied from sloping normal-to-mild to flat moderate to severe-to-profound
For comparison purposes, a small group of eight participants with normal hearing (NH), based on pure-tone thresholds being less than 25 dB HL from 250-4000 Hz, were recruited from the employees of the Institute of Hearing Research.
2.2. Stimuli
Three different stimulus types were used: (1) stationary, speech-shaped noise, (2) single-syllable, male-talker words, and (3) male-talker sentences. The stationary noise stimuli were created from independent 1500-ms samples of unmodulated ICRA noise (track 1 of the ICRA compact disc; Dreschler et al., 2001). The single-syllable word stimuli were taken from the FAAF corpus (Foster & Haggard, 1987) and had an average duration of 450 ms. The sentence stimuli were taken from the ASL corpus (MacLeod & Summerfield, 1990) and had an average duration of 1533 ms. For each trial, two separate samples were chosen at random from the total number of available stimuli (100 noises, 80 words, 270 sentences). For the block of practice trials, two separate 500-ms ICRA noises were used on each trial.
All stimuli were calibrated to the same level based on the long-term average root-mean-square (RMS) level. The pedestal level was roved across trials from 65-70 dB in 0.5-dB increments (i.e., an average pedestal level per block of 67.5 dB). To ensure that the stimulus was audible (i.e., above 10 dB SL) in the unaided conditions, the pedestal level was adjusted to 77.5 dB for eight moderate-to-severe-HI, and 87.5 dB for one severe-to-profound-HI participant. Audibility of stimuli was also ascertained through direct questioning during practice trials and between trial blocks.
2.3. Apparatus
Participants were seated in a sound-dampened room (2.5 × 4.4 × 2.5 m) in the middle of a circular 24-loudspeaker array with a radius of 0.9 m and inter-loudspeaker spacing of 15 degrees (see Akeroyd et al., 2007, for an illustration). The stimuli were presented from an outboard signal processor through a D/A converter (Fostex VC-8) and attenuator (Behringer Ultralink) to powered (built-in amplifier) loudspeakers (Phonic 207). The loudspeakers were all calibrated to within ±1 dB at 1 kHz. All test signals were presented from the loudspeaker at zero degrees azimuth to the participant. The height of the fixed chair was adjusted so that the cone of the loudspeakers was at zero degrees elevation relative to the participant’s ear canal. A touch-screen monitor, placed in front but below the loudspeakers, was used to collect responses.
To mask any low-level noise in the pre-recorded signals, uncorrelated Gaussian noise with 20-ms onset and offset gates was presented from the remaining 23 loudspeakers so that the masking noise was 30 dB below the A-weighted long-term average of the speech signals measured at the center of the loudspeaker ring. This background noise began 500 ms prior to the onset of the first interval and ended simultaneously with the offset of the second interval.
2.4. Compression Measures
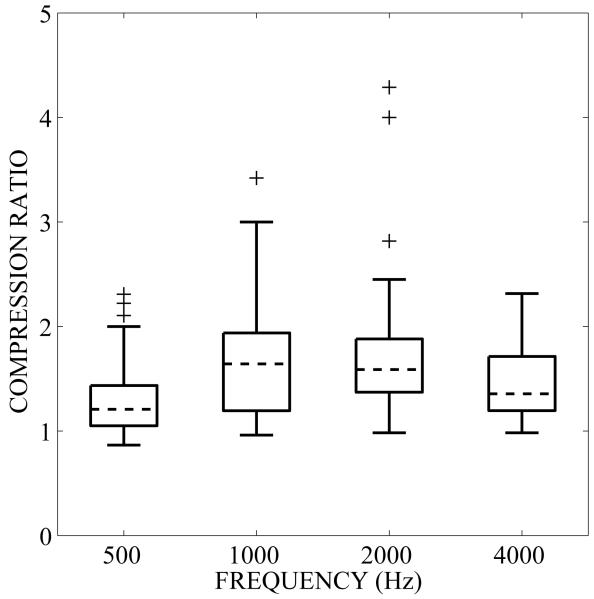
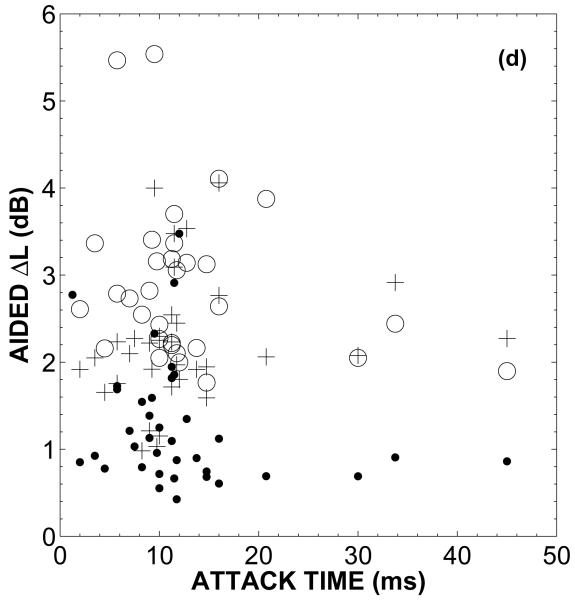
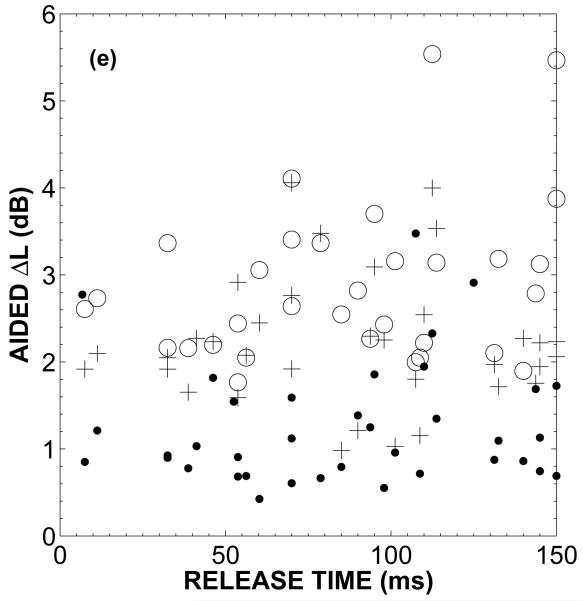
Participants’ hearing aids were analysed for their compressor characteristics using a calibrated test box (Siemens Unity 2) with a 1/2” microphone and 2-cc coupler. Hearing aids from seven different manufacturers (Electone, GN ReSound (Danalogic), MicroTech, Oticon, Phonak, Siemens and Unitron) were worn with BTE and mini-BTE shells and a variety of ear moulds. The standardised CRs (see Figure 2) were determined from the difference in hearing-aid output level relative to 60 and 80 dB SPL input of sinusoids with frequencies of 500, 1000, 2000 and 4000 Hz, averaged across left and right devices for bilaterally fitted participants. As can be seen in Figure 2, the majority of participants wore devices with CRs across frequencies between 1.2 and 2:1 (i.e., modest compression), with lower CRs at 500 Hz. Five participants wore devices measured as linear or near-linear (CRs across frequencies near 1.0). Five other participants wore devices measured with compression ratios greater than 2 across frequencies. The attack and release times were measured at the same frequencies according to ANSI S3.22 standards, using pure tones with gated levels of 55 and 90 dB SPL. The average attack times were 11, 14, 13 and 11 ms at 500, 1000, 2000 and 4000 Hz, respectively, and ranged from 2 to 45 ms across test frequencies. The average release times were 85, 80, 86 and 90 ms at 500, 100, 200 and 4000 Hz, respectively, and were evenly distributed from 5 to 150 ms. All devices had been worn by participants for at least six months prior to testing.
Figure 2.
Compression ratio as a function of frequency computed from measured outputs at 60- and 80-dB SPL input, averaged across bilateral fittings. Lines represent medians, boxes represent lower and upper quartile of data, bars represent 1.5 × inter-quartile range. Outliers outside 1.5 × inter-quartile range are marked with crosses.
2.5. Procedure
Level-discrimination thresholds were measured using a two-interval forced-choice adaptive tracking procedure. On each trial, participants were presented with two intervals, one at pedestal level and the other at pedestal-plus-increment level. The increment level was adjusted using a three-up/one-down rule, estimating 79%-correct threshold (Levitt, 1971). The order of intervals was randomized. To reduce the possible learning of a fixed-level pedestal, pedestal level was roved as described in section 2.2. Two adaptive tracks were randomly interleaved for each stimulus condition (i.e., for each stimulus condition, two estimates of threshold were made within a single block of trials). For the initial practice block, only one adaptive track was tested. The starting increment levels for the two interleaved tracks was randomly selected from 50-60 dB in 1-dB increments, so the starting level difference between pedestal and pedestal-plus-increment intervals was 1-3 dB. The increment levels were adjusted in 5-dB steps for the first two reversals, then in 2-dB steps for four reversals. The increment-level threshold estimates were based on the last four (2-dB step) reversals, from which the level-discrimination thresholds (ΔLs), in decibels, were computed from the difference between pedestal level (Lp) and pedestal-plus-increment level (Lp + Li; cf. Grantham & Yost, 1982):
The thresholds were averaged across the two interleaved adaptive tracks. Only thresholds with standard deviations across the last four reversals less than the initial step size (5 dB) were included in computations; eight thresholds (out of the 456 total thresholds measured) did not meet this criterion. To test the reliability of the threshold estimates measured, 12 of the 38 participants were randomly recruited to return for a separate session (5-6 months after their initial visit) and repeated the procedure unaided.
For the NH participants, a practice block consisting of a single adaptive track using independent 500-ms ICRA noises was performed. In separate blocks, threshold estimates were then obtained for noises, words and sentences. For HI participants, the practice block was performed without hearing aids. Threshold estimates were then obtained in separate blocks for the three stimulus types, unaided and aided. Half of the participants performed the three stimulus blocks with and then without their hearing aids; the other half performed without and then with their hearing aids. The order of blocks was randomized for all participants. NH sessions lasted approximately 25 minutes; HI sessions lasted approximately one hour.
3. RESULTS
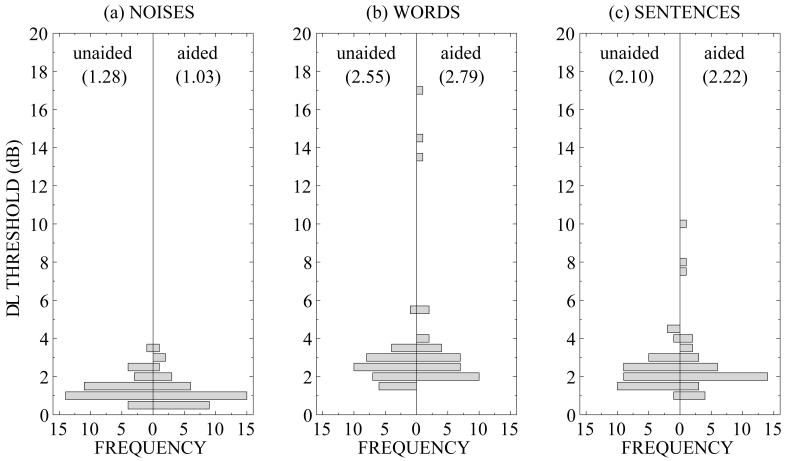
When discriminating the level of words or sentences with their own hearing aids, three participants had extreme difficulty discriminating differences in level, with individual threshold estimates of 13.3, 14.4 and 16.9 dB for words and 8.0, 7.4 and 9.8 dB for sentences (see Figure 3). Standard deviations for the last four reversals of all 12 estimates were relatively low, indicating that none were due to procedural error. Median values, inclusive of this data, are given in each pane of Figure 3; these medians are comparable to the means seen in Figure 5 with the exception of aided noise results, due to the greater positive skew (right panel of Figure 3a). While these medians are not affected by the aforementioned extreme scores, median statistics do not allow the necessary level of analysis. These six data points were therefore treated separately from the rest of the data as outliers.1 All group analyses are based on the remaining 34 data points in the two conditions. From the medians and distributions of these thresholds in Figure 3, ΔLs were higher for speech stimuli compared to noise stimuli, but there was little visible effect of amplification.
Figure 3.
Frequency histograms of level-discrimination thresholds for hearing-impaired participants grouped in 0.5-dB bins for unaided (left panel) and aided (right panel) conditions with long-term-average speech-spectrum noise (a), mono-syllabic words (b) and sentences (c). Median values are given in parentheses. For aided word and sentence stimuli, there were several thresholds that were much greater than the general distribution.
Figure 5.
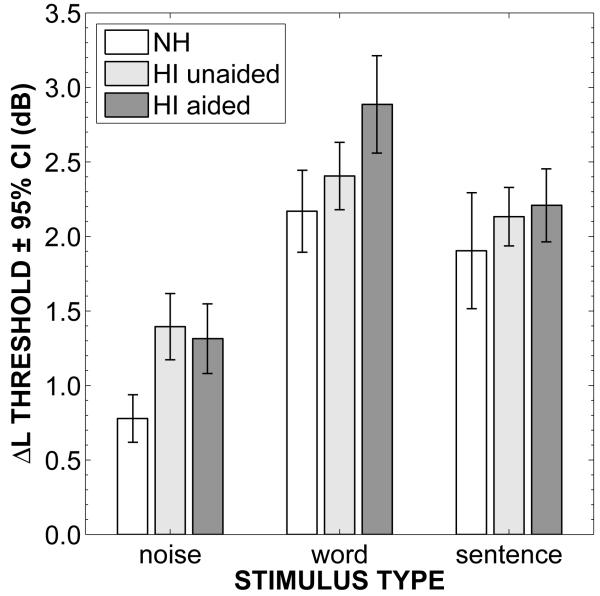
Mean level-discrimination (ΔL) thresholds as a function of stimulus type for normal-hearing (NH), hearing-impaired (HI) unaided and aided. Error bars show 95% confidence intervals. The ability to discriminate level differences between different words and sentences was significantly more difficult than discriminating level differences in noises.
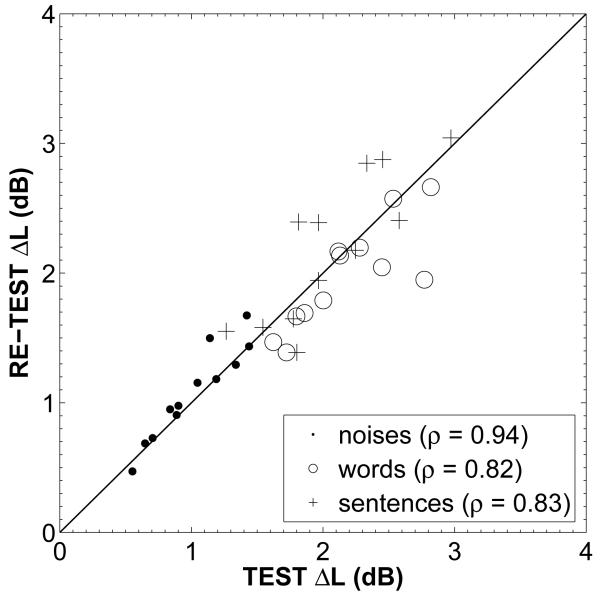
The reliability of these threshold estimates was shown to be robust across testing on separate sessions with 12 of the original 38 participants. The correlations between test and retest, as shown in Figure 4, were substantial (r12 of 0.94, 0.82 and 0.83 for noises, words and sentences, respectively) and did not show any bias away from the identity plot (i.e., results were not far from test = retest).2 All measures of reliability showed level-discrimination thresholds to have lower inter-test variance for noise than speech stimuli.
Figure 4.
Retest level-discrimination thresholds (ΔLs) as a function of test (original) ΔLs for twelve unaided participants. Stimulus conditions are separated by symbol: dots (●) for stationary noises, circles (○) for words, and crosses (+) for sentences. Pearson product-moment correlations, showing significant correlations between test and re-test values for each stimulus type, are given in the legend. The identity plot (test = retest; solid line) is shown for reference.
The mean thresholds for the normal-hearing, and unaided and aided HI participants are shown in Figure 5. There was a clear, significant main effect of the stimulus type [F(2, 205) = 24.49, p < 0.001]: differences in level were more difficult to discriminate (i.e., larger ΔLs) for words and sentences than stationary noises in both NH and HI participants, unaided and aided. For the aided conditions, the mean threshold for words (2.9 dB) was significantly (p < .05) higher than sentences (2.2 dB). Within each stimulus type, post-hoc comparisons (with Bonferroni corrections) revealed significant differences (p < .05) with stationary noises between NH and unaided or aided HI participants and with words between NH and aided HI participants. There were no significant differences between aided and unaided conditions within each stimulus condition. For HI participants, there were no significant effects of (1) unilateral versus bilateral fittings, (2) average pedestal levels of 67.5 dB versus 77.5 or 87.5 dB, or (3) experimental blocks beginning aided versus unaided.
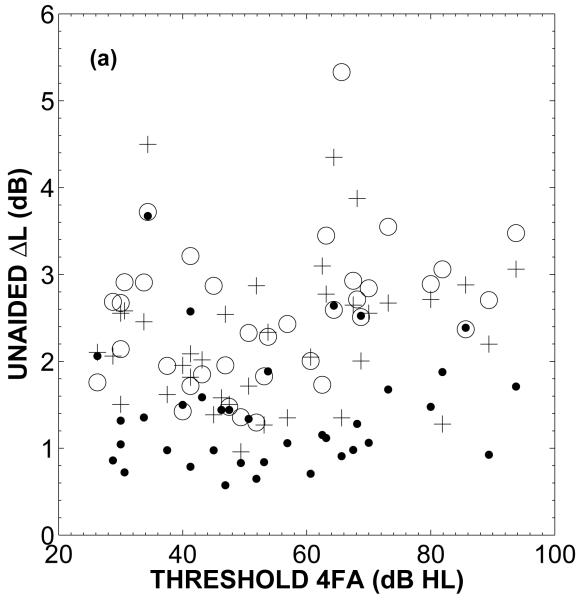
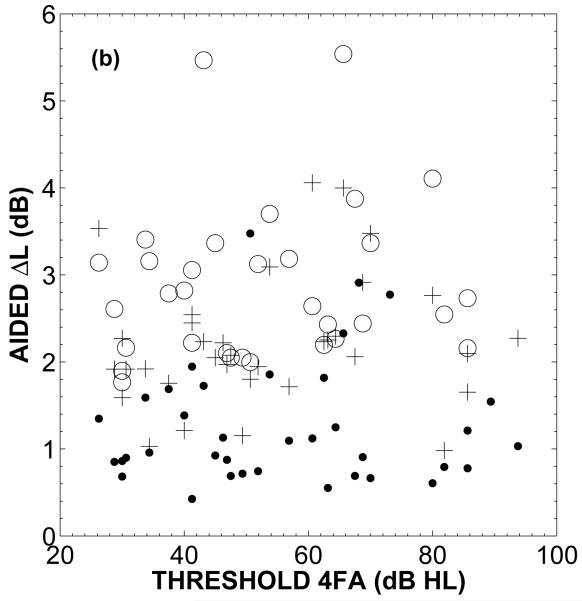
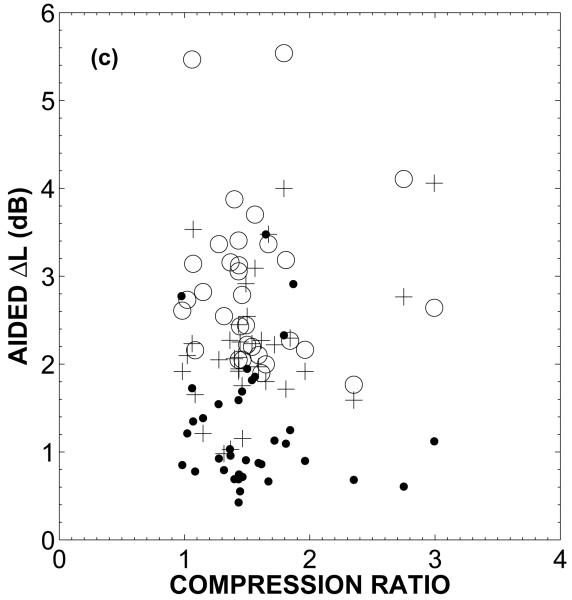
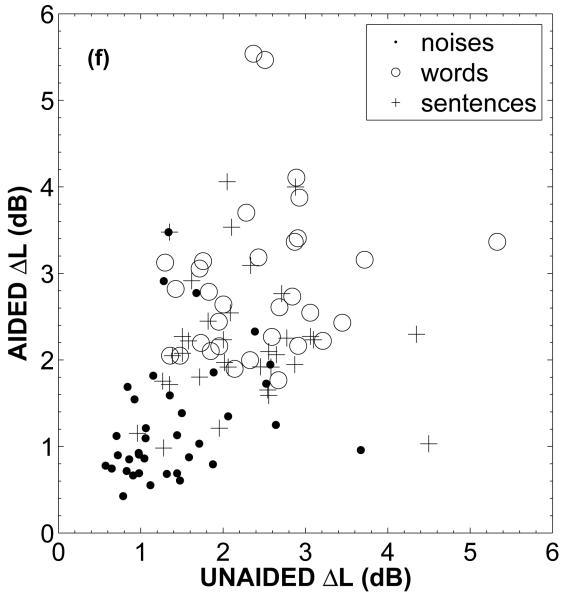
Correlations with age, audiometric data and hearing aid measurements were calculated for the ΔLs in the HI group.3 Scatter plots of several factors are shown in Figure 6. Audiometric thresholds did not correlate with either unaided or aided thresholds for any stimuli (top left and right panels, respectively in Figure 6). No compression measurements – CRs (middle left panel), attack times (middle right panel), release times (bottom left panel) – were correlated with aided performance. Unaided performance was not correlated with aided performance (bottom right panel) for any stimulus type or across stimulus conditions.
Figure 6.
Upper left panel (a) shows unaided level-discrimination thresholds (ΔL) as a function of four-frequency average (4FA) pure-tone thresholds. Upper right panel (b) shows aided ΔL as a function of 4FA pure-tone thresholds. Middle left panel shows aided ΔL as a function of average hearing-aid standardised compression ratio (x:1). Middle right panel shows aided ΔL as a function of average compressor attack time. Bottom left panel shows aided ΔL as a function of average compressor release time. Bottom right panel shows aided ΔL as a function of unaided ΔL. For all plots, stimulus conditions are separated by symbol: dots (●) for stationary noises, circles (○) for words, and crosses (+) for sentences. None of the stimulus thresholds systematically change with any of the audiometric, hearing-aid or other measures.
4. DISCUSSION
These results indicate elevated ΔLs for speech stimuli relative to stationary noise, with no general effect of amplification for HI individuals. Most psychophysical stimuli – tones and stationary noises – result in a level discrimination threshold of roughly 1 dB. The results here corroborate previous findings of broadband-noise ΔLs for NH participants: 0.8 dB in the current study compared to 0.8 dB (Montgomery, 1935), 0.7 dB (Harris, 1950), 0.6 dB (Pollack, 1951) and, using a method closest to the current study, 0.9 dB (Buus et al., 1995). Broadband-noise ΔLs for HI participants (aided and unaided) were significantly higher than NH participants by approximately 0.5 dB. Given that JND thresholds with tones were 1.5 dB higher for HI in a previous study (Fastl & Schorn, 1981), the assumption that noise ΔLs are equivalent to pure-tone ΔLs averaged across frequencies (Houtsma et al., 1980) does not apply here. The difference between NH and HI participants in the current study could be due to the fixed-level stimuli being presented at different sensation levels for HI participants, but previous studies have shown that ΔLs for complex sounds are robust to sensation level above 5-10 dB SL (Harris, 1950; Buus et al., 1995). If sensation level was the cause for the increased broadband-noise ΔL for HI participants, there would be an expected correlation between pure-tone thresholds and noise ΔLs, but there was no such correlation.
The discrimination of the level of differing words and sentences has been clearly shown to be more difficult than the discrimination of the level of broadband stationary noises. Word and sentence tokens could only be discriminated when the level difference between the two tokens was 2 dB or larger. Aided discrimination was significantly – approximately 0.7 dB – poorer for words compared to sentences. While the words were clearly shorter than the sentences, their duration was long enough to not have an expected effect on level discrimination (Baer et al., 2001). Given the increased difficulty found with amplification it is possible that the auditory processing of the dynamic envelope of words is upset by the short-term processing of the conventional hearing-aid compression. For many participants, the difficulty in judging level differences between words was exacerbated by hearing aids, although this apparent difference was negligible based on the variance. If this increased difficulty was due to hearing aid compression, it was not apparent in analysis. Hearing-aid compression ratio was not found to have any correlation with performance. While it was hypothesized that compression would have a predictable effect on stationary noises, no such prediction was validated by the results. Mathematically, the compression should affect level discrimination, yet like Akeroyd’s findings for simulated depth perception (2010), there was no such effect. These findings are akin to how mathematically, the loss of compression in the (unaided) impaired auditory system (cf. Bacon & Oxenham, 2004) should lead to improved level discrimination compared to normally compressive auditory system, but this experimentally has not been the case here or in previous studies (Harris, 1963; Fastl & Schorn, 1981; Buus et al., 1995). As HI individuals performed worse with stationary noise, there are other factors clearly contributing to their level discrimination ability. Hearing-aid compression as prescribed in current hearing aids does not appear to have any effect on level-discrimination or depth-perception tasks.
It is possible that current compression ratios are not large enough to cause an effect on either level discrimination or depth perception tasks. Standardised compression ratios, measured from 60 to 80 dB, were not high across frequencies (cf. Dillon, 2001); only two participants wore hearing aids with standardised CRs of 4:1 at any frequency. Averaged across four frequencies (500-4000 Hz), standardised CRs ranged from 0.98:1 (linear) to 2.99:1, with only three participants wearing devices with average CRs greater than 2:1 (i.e., the two aforementioned participants plus one other). The effective CRs for speech are lower than these measured standardised CRs (Henning & Bentler, 2008), which could explain the lack of correlation observed here as well as in Akeroyd (2010) for speech stimuli. For stationary noise stimuli, there is no effective vs. standardised CR difference, hence no explanation for the lack of effect of compression on noise ΔLs. Previous studies of the effect of CR on ILD for narrowband noises only showed effects with standardised CRs of 3:1 (Musa-Shufani et al., 2006). Perhaps at the CRs measured in the present study, which are lower than previously tested CRs, the effects of compression are below the inherent noise of the observer. From this limited sampling of several different makes and models of hearing aids, conventional devices are rarely acting at standardised CRs near 3:1 for sounds in the 60-80 dB SPL range. That is, there could be an unwarranted expectation of effects from the dynamic compression in current hearing aids on level discrimination and depth perception tasks.
The increased level JND for words and sentences compared to stationary noise occurred for both HI and NH participants. These elevated thresholds for words and sentences across groups and conditions may indicate that matching each word or sentence in the corpus by RMS level is not an adequate strategy to equalise the sounds. Inadequate equalization may also account for the increased test-retest variance for speech compared to noise stimuli seen in Figure 4. This method of estimating the levels of speech sounds (i.e., an RMS level) is used, however, by most current hearing aids to estimate the level of incoming sounds. That is, due to real-time processing constraints, a hearing aid is often designed to estimate level using the simplest strategy (in each band, for multi-band devices). The results here suggest this strategy might not be wholly valid. While there are sophisticated models to compute time-varying loudness (e.g., Glasberg & Moore, 2005), it would be informative to compare judgements to model predictions not just for these computationally-intensive models, but more simplified approaches (e.g., Namba et al., 2008) that could easily be implemented into the computational constraints of current hearing-aid technology.
Précis.
Thresholds were measured for hearing-impaired and normal-hearing individuals for discriminating the level of different word, sentence and stationary noise tokens. Results showed that level discrimination for words and sentences was more difficult than stationary noise, but this difficulty was found for both hearing-impaired and normal-hearing individuals, and had no relation to hearing-aid compression measures.
5. ACKNOWLEDGEMENTS
We thank Karen Doherty (section editor) and the two anonymous reviewers for their comments, Patrick Howell for his assistance in collecting the experimental data and Ian Wiggins for comments on an earlier draft. The Scottish Section of IHR is supported by intramural funding from the Medical Research Council and the Chief Scientist Office of the Scottish Government.
Footnotes
All three participants with outlying data for the aided word- and sentence-stimulus conditions had pronounced hearing losses, with 4FA pure-tone thresholds of 68, 73 and 89 dB HL. Other moderate-severe to severe-profound HI participants, however, did not have the same difficulty with speech level discrimination. The three participant’s devices were from two different manufacturers, one had linear amplification, the other two were modestly compressive within the interquartile range of measured CRs. While there is no explanation for these outliers outside of an inability to use particular cues for the task (i.e., a missing strategy), it is of importance to note that their unaided thresholds were within 1 dB of the mean for all stimuli. The amplification can introduce difficulties with basic psychophysical tasks for particular individuals, yet it is necessary to restore audibility to those same individuals.
Test-retest reliability was measured here on the same method with the same participants, hence the larger issues surrounding the use of a correlation coefficient for testing repeatability with regards to method comparison (Bland & Altman, 1986) have been avoided.
Significance testing for all comparisons and correlations was corrected based on Bonferroni’s inequality (Miller, 1966) for the large number of possible independent variables (e.g., pure-tone thresholds at each frequency, CRs at each frequency); correlations found to be significant without the correction were insignificant with the correction and therefore considered spurious.
This is a PDF file of an unedited manuscript that has been accepted for publication. As a service to our customers we are providing this early version of the manuscript. The manuscript will undergo copyediting, typesetting, and review of the resulting proof before it is published in its final citable form. Please note that during the production process errors may be discovered which could affect the content, and all legal disclaimers that apply to the journal pertain.
6. REFERENCES
- Akeroyd M. The effect of hearing-aid compression on judgments of relative distance. J Acoust Soc Am. 2010;127:9–12. doi: 10.1121/1.3268505. [DOI] [PMC free article] [PubMed] [Google Scholar]
- Akeroyd M, Gatehouse S, Blaschke J. The detection of differences in the cues to distance by elderly hearing-impaired listeners. J Acoust Soc Am. 2007;121:1077–1089. doi: 10.1121/1.2404927. [DOI] [PMC free article] [PubMed] [Google Scholar]
- Amitay S, Irwin A, Hawkey D, et al. A comparison of adaptive procedures for rapid and reliable threshold assessment and training in naive listeners. J Acoust Soc Am. 2006;119:1616–1625. doi: 10.1121/1.2164988. [DOI] [PubMed] [Google Scholar]
- American National Standards Institute Specification of Hearing Aid Characteristics. 2003 ANSI S3.22-2003. [Google Scholar]
- Bacon S, Oxenham A. Psychophysical manifestations of compression: Hearing-impaired listeners. In: Bacon S, Fay R, Popper A, editors. Compression: From cochlea to cochlear implants. Springer Verlag; New York: 2004. pp. 107–152. [Google Scholar]
- Baer T, Moore B, Marriage J. Detection and intensity discrimination of brief tones as a function of duration by hearing-impaired listeners. Hear Res. 2001;159:74–84. doi: 10.1016/s0378-5955(01)00324-0. [DOI] [PubMed] [Google Scholar]
- Bland J, Altman D. Statistical methods for assessing agreement between two methods of clinical measurement. The Lancet. 1986:307–310. [PubMed] [Google Scholar]
- British Society of Audiology Recommended procedures for pure tone audiometry using a manually operated instrument. Br J Audiol. 1981;15:213–216. doi: 10.3109/03005368109081440. [DOI] [PubMed] [Google Scholar]
- Brungart D, Scott K. The effects of production and presentation level on the auditory distance perception of speech. J Acoust Soc Am. 2001;110:425–440. doi: 10.1121/1.1379730. [DOI] [PubMed] [Google Scholar]
- Buus S, Florentine M. Psychometric functions for level discrimination. J Acoust Soc Am. 1991;90:1371–1380. doi: 10.1121/1.401928. [DOI] [PubMed] [Google Scholar]
- Buus S, Florentine M, Zwicker T. Psychometric functions for level discrimination in cochlearly impaired and normal listeners with equivalent-threshold masking. J Acoust Soc Am. 1995;98:853–861. doi: 10.1121/1.414450. [DOI] [PubMed] [Google Scholar]
- Coleman P. An analysis of cues to auditory depth perception in free space. Psychol Bull. 1963;60:302–315. doi: 10.1037/h0045716. [DOI] [PubMed] [Google Scholar]
- Dillon H. Hearing aids. Boomerang; Sydney: 2001. [Google Scholar]
- Dreschler W, Verschuure H, Ludvigsen C, Westermann S. ICRA noises: Artificial noise signals with speech-like spectral and temporal properties for hearing aid assessment. Audiology. 2001;40:148–157. [PubMed] [Google Scholar]
- Fastl H, Shorn K. Discrimination of level differences by hearing-impaired patients. Audiology. 1981;20:488–502. doi: 10.3109/00206098109072717. [DOI] [PubMed] [Google Scholar]
- Florentine M, Reed C, Rabinowitz W, et al. Intensity perception XIV: Intensity discrimination in listeners with sensorineural hearing loss. J Acoust Soc Am. 1993;94:2575–2586. doi: 10.1121/1.407369. [DOI] [PubMed] [Google Scholar]
- Foster J, Haggard M. The four alternative auditory feature test (FAAF) – linguistic and psychometric properties of the material with normative data in noise. Br J Audiol. 1987;21:165–174. doi: 10.3109/03005368709076402. [DOI] [PubMed] [Google Scholar]
- Glasberg B, Moore B. Development and evaluation of a model for predicting the audibility of time-varying sounds in the presence of background sounds. J Audio Eng Soc. 2005;53:906–918. [Google Scholar]
- Grantham D, Yost W. Measures of intensity discrimination. J Acoust Soc Am. 1982;72:406–410. doi: 10.1121/1.388092. [DOI] [PubMed] [Google Scholar]
- Hall J, Fernandes M. Monaural and binaural intensity discrimination in normal and cochlear-impaired listeners. Audiology. 1983;22:364–371. doi: 10.3109/00206098309072796. [DOI] [PubMed] [Google Scholar]
- Harris J. The effect of sensation-levels on intensive discrimination of noise. Am J Psychol. 1950;63:409–421. [PubMed] [Google Scholar]
- Harris J. Loudness discrimination. J Speech Hear Disord Monogr Suppl. 1963;11:1–63. [Google Scholar]
- Henning R, Bentler R. The effects of hearing aid compression parameters on the short-term dynamic range of continuous speech. Ear Hear. 2008;51:471–484. doi: 10.1044/1092-4388(2008/034). [DOI] [PubMed] [Google Scholar]
- Hirsh I, Palva T, Goodman A. Difference limen and recruitment. AMA Arch Otolaryngol. 1954;60:525–540. doi: 10.1001/archotol.1954.00720010540001. [DOI] [PubMed] [Google Scholar]
- Houtsma A, Durlach N, Braida L. Intensity perception, XI: Experimental results on the relation of intensity resolution to loudness matching. J Acoust Soc Am. 1980;68:807–813. doi: 10.1121/1.384819. [DOI] [PubMed] [Google Scholar]
- Levitt H. Transformed up-down methods in psychoacoustics. J Acoust Soc Am. 1971;49:467–477. [PubMed] [Google Scholar]
- MacLeod A, Summerfield Q. A procedure for measuring auditory and audio-visual speech-reception thresholds for sentences in noise: Rationale, evaluation, and recommendations for use. Br J Audiol. 1990;24:29–43. doi: 10.3109/03005369009077840. [DOI] [PubMed] [Google Scholar]
- Miller G. Sensitivity to changes in the intensity of white noise and its relation to masking and loudness. J Acoust Soc Am. 1947;19:609–619. [Google Scholar]
- Miller R. Simultaneous statistical inference. McGraw-Hill; New York: 1966. [Google Scholar]
- Mitchell R, Elliott R, Barry M, Cruttenden A, Woodruff P. The neural response to emotional prosody, as revealed by functional magnetic resonance imaging. Neuropsychologia. 2003;41:1410–1421. doi: 10.1016/s0028-3932(03)00017-4. [DOI] [PubMed] [Google Scholar]
- Montgomery H. Influence of experimental technique on the measurement of differential sensitivity of the ear. J Acoust Soc Am. 1935;7:39–43. [Google Scholar]
- Munro K. Reorganization of the adult auditory system: Perceptual and physiological evidence from monaural fitting of hearing aids. Trends Amplif. 2008;12:85–102. doi: 10.1177/1084713808316173. [DOI] [PMC free article] [PubMed] [Google Scholar]
- Musa-Shufani S, Walger M, von Wedel H, Meister H. Influence of dynamic compression on directional hearing in the horizontal plane. Ear Hear. 2006;27:279–285. doi: 10.1097/01.aud.0000215972.68797.5e. [DOI] [PubMed] [Google Scholar]
- Namba S, Kuwano S, Fastl H. Loudness of non-steady-state sounds. Jpn Psychol Res. 2008;50:154–166. [Google Scholar]
- Noble W, Gatehouse S. Effects of bilateral versus unilateral hearing-aid fitting on abilities measured by the Speech, Spatial, and Qualities of Hearing scale (SSQ) Int J Audiol. 2006;45:172–181. doi: 10.1080/14992020500376933. [DOI] [PubMed] [Google Scholar]
- Pollack I. Intensity discrimination thresholds under several psychophysical procedures. J Acoust Soc Am. 1954;26:1056–1059. [Google Scholar]
- Robinson K, Gatehouse S. The time course of effects on intensity discrimination following monaural fitting of hearing aids. J Acoust Soc Am. 1996;99:1255–1258. doi: 10.1121/1.414637. [DOI] [PubMed] [Google Scholar]
- Rodenburg M. Intensity discrimination of noise bands as a function of bandwidth and duration. In: Cardozo B, de Boer E, Plomp R, editors. Hearing theory. Institute for Perception Research; Eindhoven: 1972. pp. 429–439. [Google Scholar]
- Schroder A, Viemeister N, Nelson D. Intensity discrimination in normal-hearing and hearing-impaired listeners. J Acoust Soc Am. 1994;96:2683–2693. doi: 10.1121/1.411276. [DOI] [PubMed] [Google Scholar]
- Stone M, Moore B. Syllabic compression: Effective compression ratios for signals modulated at different rates. Br J Audiol. 1992;26:351–361. doi: 10.3109/03005369209076659. [DOI] [PubMed] [Google Scholar]
- Verschuure J, Maas A, Stikvoort E, de Jong R, Goedegebure A, Dreschler W. Compression and its effect on the speech signal. Ear Hear. 1996;17:162–175. doi: 10.1097/00003446-199604000-00008. [DOI] [PubMed] [Google Scholar]
- Viemeister N. Intensity coding and the dynamic range problem. Hear Res. 1988;34:267–274. doi: 10.1016/0378-5955(88)90007-x. [DOI] [PubMed] [Google Scholar]


