Abstract
We have used oligonucleotide-fingerprinting data on 60,000 cDNA clones from two different mouse embryonic stages to establish a normalized cDNA clone set. The normalized set of 5,376 clones represents different clusters and therefore, in almost all cases, different genes. The inserts of the cDNA clones were amplified by PCR and spotted on glass slides. The resulting arrays were hybridized with mRNA probes prepared from six different adult mouse tissues. Expression profiles were analyzed by hierarchical clustering techniques. We have chosen radioactive detection because it combines robustness with sensitivity and allows the comparison of multiple normalized experiments. Sensitive detection combined with highly effective clustering algorithms allowed the identification of tissue-specific expression profiles and the detection of genes specifically expressed in the tissues investigated. The obtained results are publicly available (http://www.rzpd.de) and can be used by other researchers as a digital expression reference.
[The sequence data described in this paper have been submitted to the EMBL data library under accession nos. AL360374–AL36537.]
The level of expression of all genes of an organism in different cell types, tissues, stages of development, or disease processes constitutes essential information for understanding the function of different genes and to unravel the complex network of biological processes acting in every biological system. A number of various approaches have been developed to gain information on gene expression levels, based either on counting the number of clones in libraries prepared from different materials or on some (typically hybridization) intensity measurements. Examples of this first approach are EST sequencing (Adams et al. 1993; Boguski and Schuler 1995), oligonucleotide fingerprinting (Meier-Ewert et al. 1998), or SAGE (Velculescu et al. 1995; Zhang et al. 1997). Complex cDNA hybridization (Lehrach et al. 1990; Lennon and Lehrach 1991; Gress et al. 1996; Duggan et al. 1999), whole-mount in situ hybridization (Wilkinson and Nieto 1993), and differential display technology (Liang and Pardee 1992) logically belong to the second class of approaches for analyzing patterns of gene expression.
Among these techniques, the use of complex cDNA hybridization combined with high-density arrays of spotted cDNA clones, PCR products (Gress et al. 1992; Schena et al. 1995; DeRisi et al. 1996; Lashkari et al. 1997) or oligonucleotides (Southern 1995; Hoheisel 1997; Lipshutz et al. 1999), offers a number of advantages compared to many of the other approaches. This approach combines high sensitivity with a high throughput because of the possibility of an enormous number of parallel experiments carried out on a single high-density DNA array (Poustka et al. 1986; Lehrach et al. 1990; Schena et al 1996; Brown and Botstein 1999). To extract significant biological information from complex cDNA hybridization, computational analysis and clustering methods are necessary, providing an efficient technique to group together differentially expressed and functionally related genes (Eisen et al. 1998; Iyer et al. 1999).
We have used oligonucleotide fingerprinting to establish a normalized subset of genes expressed during day 9 and 12 of mouse embryonic development comprising 5,376 cDNA clones. We used this selected set of cDNA clones to construct high-density cDNA arrays of PCR products spotted on glass surfaces, which then have been used in complex cDNA hybridization experiments. This approach of constructing a normalized clone set has particular advantages in less well characterized genomes, where neither a genomic sequence nor a precharacterized 'unigene' clone set is available (Lehrach et al. 1990; Meier-Ewert et al. 1998; Poustka et al. 1999). The selected set was used to determine tissue-specific gene expression profiles combining complex cDNA hybridization with statistical analysis.
RESULTS
Normalization of cDNA Libraries by Oligonucleotide Fingerprinting
Two cDNA libraries consisting of 60,000 cDNA clones were characterized by oligonucleotide fingerprinting (Meier-Ewert et al. 1998). The fingerprint of each clone consists of a list of intensities from the sequential hybridization of a series of oligonucleotides. Identical or similar clones have identical or similar fingerprints. Clones with matching oligonucleotide fingerprints can be clustered using appropriate clustering algorithms. For the library normalization 5,376 representative clones from clusters with a size of two to four members were chosen, thus reducing the chance of selecting cloning artifacts from single cluster members.
In order to verify the oligonucleotide fingerprinting results and to identify the corresponding cDNA clones these representatives were tag-sequenced by standard sequencing methods. For database searches and analysis of the DNA sequences the GCG package was used (http://www.gcg.com). The Phrap sequence assembly program was used to separate single clones from overlapping clones (http://www.phrap.com). Phrap has been shown to make a fast and efficient assembly of standard sequence reads, and therefore, it is well suited to sorting out singletons. For the analysis described here, default values of the program were used. For read assembly vector sequences were masked, and then the masked reads were compared against each other to find likely pairwise overlaps. The analysis showed that out of the 5,374 sequenced cDNA clones, ∼3,500 were unique. These clones could not be aligned with other clones under the alignment conditions chosen. We found 167 contigs, corresponding to ca. 800 cDNA clones. The largest contig contained 56 sequences. Together with the fact that about 20% of the clones gave no sequence above the quality threshold, this result proves that oligonucleotide fingerprinting is a suitable method for reducing the redundancy in cDNA libraries significantly (up to fourfold [Poustka et al. 1999]). In addition to known genes with high homology to already available database entries, the method described here allows the identification of unknown genes or DNA fragments that have only poor or no homology to database entries in the public domain (see separate tables in Figs. 5 and 6).
Figure 5.
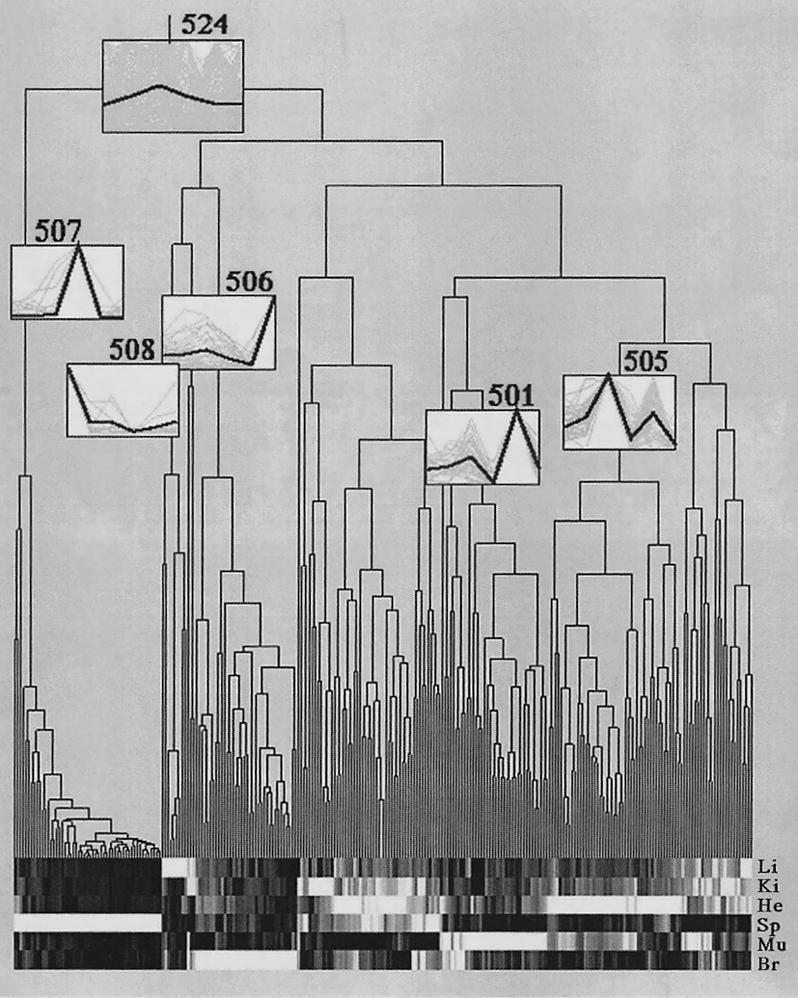
Clustering of 263 genes showing tissue-specific expression. The obtained dendrogram visualizes the normalized expression values for the selected tissues in 65,536 grayscales. White color stands for high expression, while black corresponds to complete gene repression. Like in Figure 4, spleen is the most apparent tissue because the subtree corresponding to spleen (507) is the first one being separated from all other tissue-specific subtrees. The consensus vector (bold lines) is given in the numbered boxes in the clustering diagram and represents the mean expression values of the cluster members (thin lines). Li, liver; Ki, kidney; He, heart; Sp, spleen; Mu, muscle; Br, brain.
Figure 6.
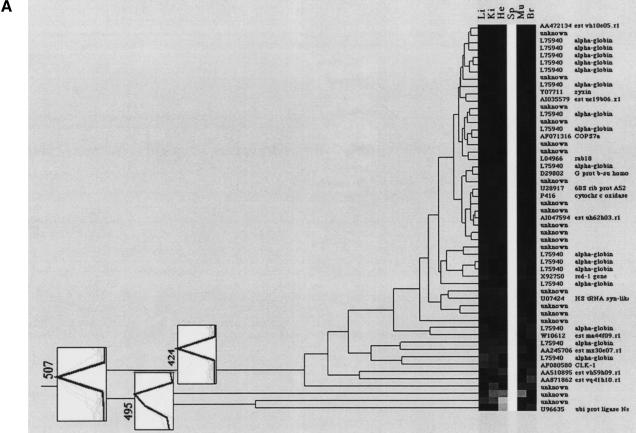
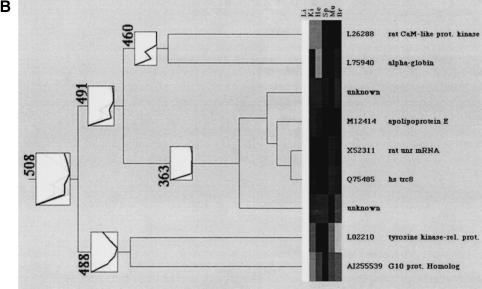
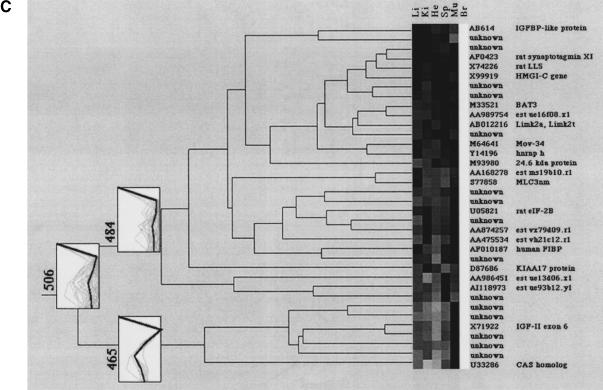
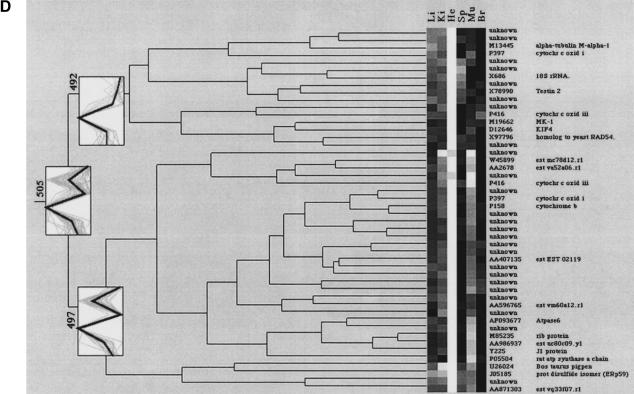
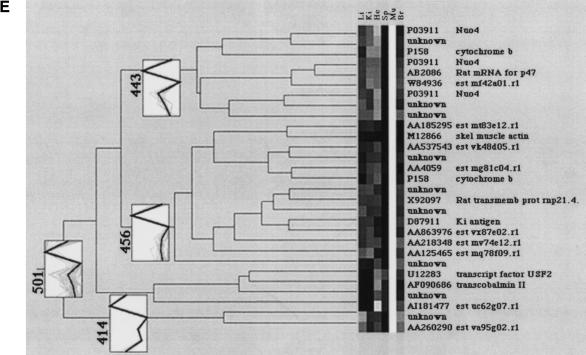
Clustering of tissue-specific gene expression. The dendrograms display (A) the spleen-specific clustering branch (507), (B) the liver-specific cluster with nine gene fragments (508), (C) the brain-specific clustering branch (506) containing two distinct subbranches, (D) the heart cluster (505), and (E) the muscle cluster (501). “Unknown” describes cDNA clones with either no sequence information or no data base entry (BLAST probability score higher than e−20) was obtained. The consensus vectors given in the numbered boxes in the clustering diagrams (bold lines) represent the mean expression values of the cluster members (faint lines). Li, liver; Ki, kidney; He, heart; Sp, spleen; Mu, muscle; Br, brain. Updates of these clones will be made publicly available on the RZPD homepage (http://www.rzpd.de).
Preparation of Glass Chips
In order to estimate the amount of DNA that is bound to an array and is accessible for hybridization, control spotting and hybridization experiments were performed. For the calculation of the amount of DNA that is transferred to the glass slide in a droplet, the determined transfer volume of 2 nl per droplet per pin as measured from Figure 1 can be used. This leads to the estimation that ca.∼40–100 pg of DNA is transferred in a droplet to the glass slide. In order to verify whether all DNA in a droplet is bound to the glass slide, we spotted radioactively labeled DNA onto a slide. The comparison of images immediately after being radioactively spotted 10 times and after a gentle washing step with hybridization buffer showed that only 1%–2% of the maximal available DNA, corresponding to 4–10 pg of DNA, was immobilized onto the slide. The amount of immobilized targets is identical for radioactive and fluorescent detection techniques. After hybridization of these 4–10 pg DNA with fully complementary DNA, having the amount of probe in access to the immobilized target, we could find only 10%–20% of the immobilized DNA to be accessible for hybridization. To achieve the required detection limit, corresponding to ca.∼0.001 attomole of a 500-bp fragment, we used radioactive detection methods. These numbers were measured for epoxysilanated glass, although the use of poly-lysin slides leads to similar results. In this work epoxysilanated slides were chosen as a planar arraying surface because they allow more stringent hybridization and washing conditions when compared to poly-Lysin slides.
Figure 1.
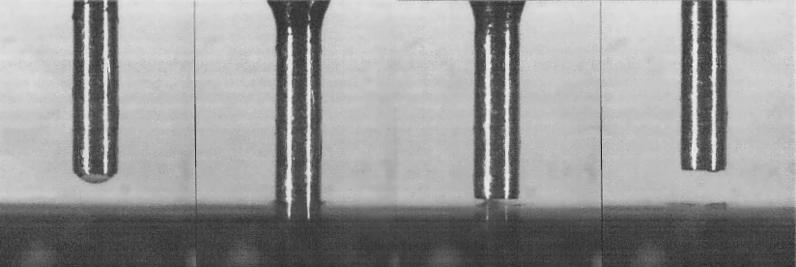
Detailed illustration of the liquid transfer by a spotting pin. Close-up view of one pin spotting a PCR product onto a glass slide. In the outer-left picture, the 250-μm pin tip end is loaded with a 2-nL droplet. The left picture shows the actual spotting process onto the epoxysilanated glass surface. In the right picture the pin goes up again, showing that the liquid's surface tension is present and does not allow the immediate delivery of the whole droplet, which might be one reason for the well-known doughnut effect. The outer-right picture finally shows pin and glass surface after liquid delivery. It is obvious that a tiny amount of DNA solution is still sticking to the pin, which requires careful cleaning procedures prior to the next spotting run.
Hybridization on Glass Arrays
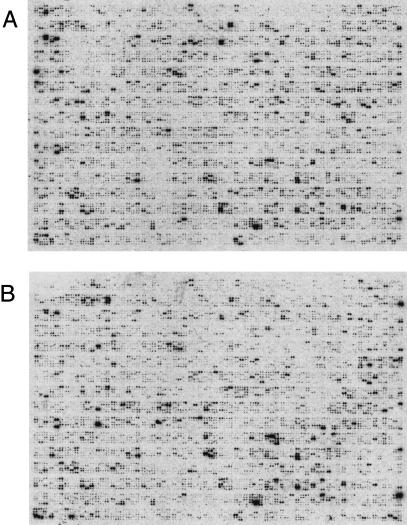
We have used mRNA isolated from six different adult mouse tissues to analyze the applicability of the defined subset for expression analysis experiments. To obtain a data set suitable for statistical evaluation, four independent sets of experiments were performed. In order to prevent edging or “overshining” effects of overlapping spots blurring the analysis, two different spotting patterns were applied. After hybridization every glass slide was exposed overnight and scanned with 25 μm resolution. Such resolution corresponds to 100 pixels per spot. Example hybridization images are shown in Figure 2.
Figure 2.
Complex cDNA hybridization images. Two arrays obtained after complex cDNA hybridization of (A) 0.5 μg of mouse brain polyA+ RNA and (B) 0.5 μg of mouse liver polyA+ RNA to normalized cDNA clones arrayed on 9 × 13-cm glass slides are shown. On this raw data image, the hybridization signals detected spanned a range over at least three orders of magnitude. Prior to imaging, the hybridized glass slides were exposed for 16 hr to a Fuji MP imaging plate.
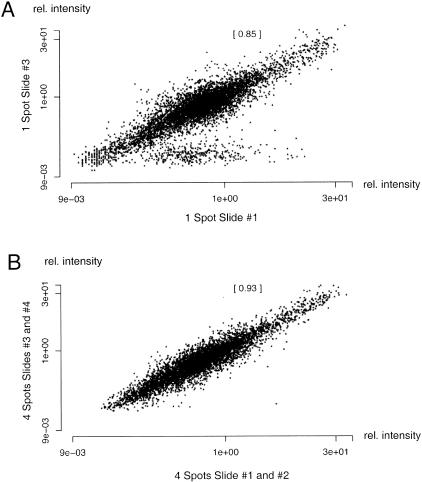
For quantification of spot intensities the mean pixel intensities of each spot were chosen. The background was evaluated for each 6 × 6 spotting block on the slide. On each block we determined the local background intensity on four points. The mean value of these points was used to calculate the background and was subtracted from the spot intensities in each block (Nguyen et al. 1995; Pietu et al. 1996). The correlation between spotted PCR duplicates on slides after hybridization with a muscle specific complex probe is shown in Figure 3. In Figure 3A the correlation between the intensities of identical spots on two different slides is shown. The correlation between identical spots can be increased from 0.85 to 0.93 using the average of more replications of the complex cDNA hybridizations on different slides. The obtained results for four hybridizations were averaged and are displayed in Figure 3B. As a result it is apparent that statistical reliability of cDNA microarrays can be improved using multiple replications of the same experiment.
Figure 3.
Statistical analysis of complex cDNA hybridization results. The scatter plots visualize the reproducibility obtained for muscle mRNA in the experiments described here. Figure 3A displays the relative median signal intensities of all genes or spot locations on slide 1 compared with the same spots on slide 3. The correlation coefficient for this comparison was determined to 0.85. The correlation coefficient (given in brackets in Fig. 3A and 3B) is increased to 0.93 when all median intensity values for spots on slides 1 and 2 are compared with their analogues on slides 3 and 4.
Expression Analysis Using Hierarchical Clustering Algorithms
The analysis of gene expressions was done via two similar clustering methods. The first application of hierarchical clustering was to show whether specific tissues could be identified from their expression profile over the selected 5,374 array elements. The second clustering method was applied to identify genes or gene clusters that reveal tissue-specific gene expression.
For the first application, all clones on a slide that gave a hybridization signal were taken for analysis. The result is shown in Figure 4, where all tissues are clearly separated from each other and have formed tissue-specific subtrees. The central part of the dendrogram in Figure 4 shows the muscle and heart tissue hybridization experiments directly neighboring with kidney tissue after clustering, meaning that the expression profiles of these experiments showed the highest similarity. It is obvious that kidney tissue showed, for the selected genes, a higher similarity to muscle and heart tissues than to those of the brain, liver, or spleen. The clustering results shown in Figure 4 demonstrate that in the experiments described here the selected spleen probes represented the most distant tissue to the central muscle/heart/kidney cluster.
Figure 4.
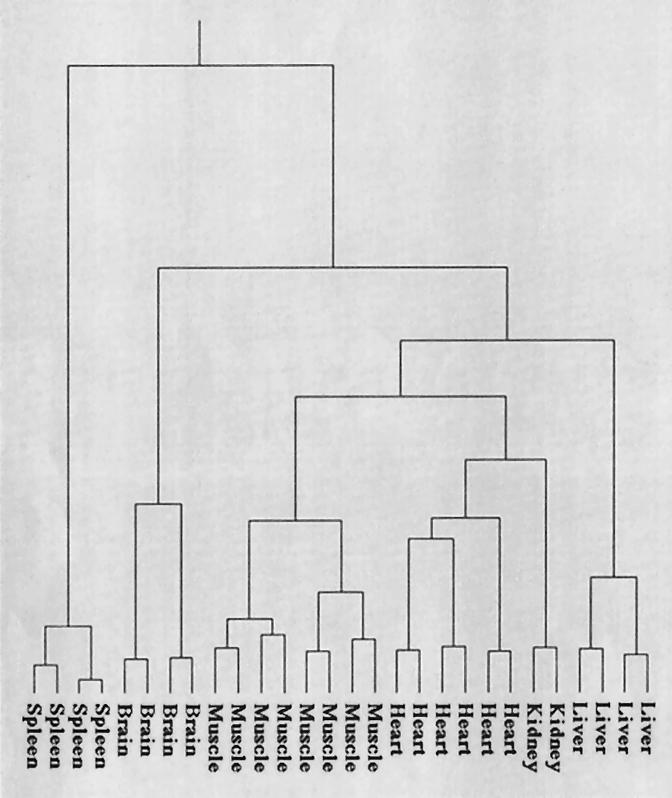
Clustering results for tissue-specific expression analysis. For generating the tissue-specific clustering tree or dendrogram, only slides showing an adequate hybridization quality were selected. The main criteria for judging the slide quality was the condition of the spotting blocks, meaning areas that were produced by a single spotting pin. The quality of a block was calculated by comparing the constant Arabidopsis thaliana control clones to the mean background signal of the slides. Only slides with >90% of the blocks above the quality threshold were used for calculating the dendrogram, which corresponded to 14 out of 16 slides. Clustering was performed by the described hierarchical clustering method using a correlation-based distance measure for all clones on a slide.
The second application of clustering, identification of single genes or gene clusters that showed a characteristic tissue-specific expression, was done on a subset of 263 array elements and is shown in Figure 5. This number was selected from the overall 5,374 array elements in such a way that only cDNA clones showing major changes in gene expression over the different tissues were taken into cluster analysis. To do this the hybridization values were normalized as described above and the mean values of all spots in all tissues were aligned in one vector. The variance for this vector was calculated, and all values with a standard deviation greater than two were taken into analysis. The procedure should display all clones that showed significant differences for a single array element over the chosen tissues. In practice this clone subset leads to an identical tissue-clustering result to the one shown in Figure 4 (data not shown). This can be explained by the fact that the majority of genes show very little change in the selected samples and have therefore only a minor effect on the clustering result. In addition to user-friendly graphical output, the selected subset keeps computing times for clustering short. In Figure 5 the number of elements belonging to a tissue-specific branch in the dendrogram vary between nine for cluster 508 (liver) and 52 for cluster 507 (spleen). The single vectors for every numbered cluster are displayed in faint lines, while the sum of all vectors in each cluster is displayed in bold lines.
Five tissue-specific clusters (501, 505, 506, 507, and 508 in Fig. 5) had some remarkable characteristics, which will be described in detail here. An obvious feature of the spleen-specific clustering branch 507 (Fig. 6A), is that of 53 gene fragments, 16 represent α-globins (see subcluster 424). In addition to this concentration of globin genes, genes coding for redox processes such as nucleoredoxin, carbonyl reductase, uroporphyrinogen decarboxylase, and cytochrome c oxidase are present in this cluster.
The smallest clustering subunit was detected as liver-specific cluster 508 and presented nine gene fragments, displayed in Figure 6B. For seven out of these nine clones database entries of known proteins were found after sequencing. Two sequences remain unknown or undescribed. The known clones in this cluster do represent a G10 protein homologue, which can be detected in liver cirrhosis, and a tyrosine kinase found also in hematopoetic cells. Clone Q75485 represents a member of the ring zinc-finger family with a low homology to human multiple-membrane-spanning receptor trc8 (Gemmill et al. 1998). Clone X52311 corresponds to a rat mRNA for a protein with unknown function; clone M12412 is representing mouse apolipoprotein E. The final clones that were clustered into the liver-specific subtree codes for α-globin and a Ca-calmodulin-dependant protein kinase.
The brain-specific clustering branch 506 (Fig. 6C) shows two distinct subbranches, 465 and 484. In cluster 465, genes are grouped together that are moderately expressed in heart tissue and highly expressed in brain tissue. Cluster 484 represents genes, which are only highly expressed in brain tissue. The clones X74226, AF0423, AB006141, and X83589 are described in GenBank as brain related. Beside genes coding for retinoic responsive protein and N-cadherin, several genes involved in adenosine metabolism such as adenosine deaminase, ATPase subunit, or adenylate synthase are present in the cluster.
The muscle-specific cluster 501 (Fig. 6E) can be divided into three different subclusters. In subcluster 414, genes with moderate expression in liver and high expression in muscle are classified. Subcluster 443 bundles genes with modest expression in heart and high expression in muscles, whereas subcluster 456 exclusively identifies genes highly expressed in muscle. The muscle-specific clustering branch presents eleven functionally described genes beside nine EST entries. Two cytochromes and other array elements coding for NADH-ubiquinone oxidoreductase 4 (Nuo4) are also present in the cluster.
The hierarchical clustering proved to be quite reliable for gene expression analysis because it has verified gene groups with tissue-specific expression such as, for example, α-globins in spleen or cytochrome subunits in heart. In addition to known genes, genes from the mouse 9d and 12d cDNA libraries previously not described could be classified.
DISCUSSION
Complex cDNA hybridization offers a highly efficient strategy to determine expression levels on multiple samples. In contrast to the digital techniques, which are essentially based on counting clones (and thereby molecules), expression levels have to be determined accurately (typically within a factor of two to three), and over a large range (typically at least three orders of magnitude). To be able to answer many biological questions, however, these levels of accuracy and reproducibility not only have to be achieved, but their achievement also has to be verified by including a sufficient number of internal controls into the experiments.
Factors affecting the reproducibility of the experiment and the levels of background therefore play a major role in the quality of the data generated (Granjeaud et al. 1996). In the work described here we relied on the use of glass as solid support due to its superior stability, easy handling properties, and low background. In contrast to other groups we do, however, find radioactively labeled complex probes still to be significantly (approximately twofold) more sensitive than fluorescently (Cy3, Cy5) labeled probes, allowing roughly a twofold reduction in the amount of initial mRNA required. This is the major advantage of the method described here when compared with previously described fluorescent labeling protocols (Chee et al. 1996; DeRisi et al. 1997). With a careful reduction in the buffer volume, for example, on smaller glass slides for application-tailored arrays, even small tissue samples or biopsies can be used as sources for mRNA preparations. Combined with longer exposure times, this could further reduce the amount of material required for meaningful expression analyses of biopsies on glass arrays where only 15 ng of polyA+ RNA might be available. When radioactive detection is used, no correction factors have to be implemented into the analysis, which take care of different nucleotide incorporation rates that might occur when different fluorescent labeled nucleotides, for example, Cy3 or Cy5, are used during RNA labeling. Common fluorescence detectors have a detection limit of approximately 0.01 attomole dye per 250-μm spot (Nature Genetics 1999). It is because of this lack in sensitivity that we used radioactive detection, and we consider overnight exposure as a real alternative to fluorescent protocols because it delivers differences in gene expression that can't be measured with current fluorescent technologies (Bertucci et al. 1999; Jordan et al. 1998). Another consideration of using radioactive detection is that, in case of any errors in the detection process, the slides can be reexposed to phosphorscreens. This is impossible with currently described and used fluorescent dyes because they lose at least 10% of the original fluorescence signal due to bleaching effects after each (laser) scan.
In the work described here, done on 9 × 13-cm glass arrays, we chose 4 mL of hybridization buffer to minimize diffusion-limited hybridization events, which may occur when the spotted slide is just wetted with a minimum of hybridization solution and directly covered with a cover slip. The obtained results agree with the results of Jordan and coworkers, which show that even a low concentration of the initially required mRNA in the hybridization buffer (approx. 0.02 ng/μL) leads to reproducible hybridization signals (Bertucci et al. 1999; Jordan et al. 1998). The gentle shaking of the buffer volume chosen via rotation of the slides ensures an even signal distribution of the different mRNA fragments over the surface, as shown in Figure 2. In addition to diffusion-limiting effects, which might be present when the RNA sample is diluted in 10μL of hybridization buffer as described in Nature Genetics (1999), are minimized.
Oligonucleotide fingerprinting (Radelof et al. 1998) and expression analysis using hierarchical cluster algorithms allow highly parallel data analysis. Similar to previously published experiments (Iyer et al. 1999; Eisen et al. 1998), the RNA expression data analysis and clustering tools permit an efficient and fast data investigation. Besides the clustering software (results shown in Figs. 4–6), expression-level analysis of either single or dozens of clones can easily be carried out by exporting the normalized numerical output values of the image analysis software into an S-Plus or Excel spreadsheet.
An apparent feature of the experimental analysis via hierarchical clustering methods is that the expression patterns of the various tissues examined clustered clearly together into distinct subtrees of a dendrogram. The model experiment for six different tissues from adult mice could confirm that tissue-specific gene expression on glass arrays using radioactive detection is reproducible and can be used to identify patterns representing different biological determinations. This is best reflected in the directly neighbored heart and muscle branches in the center of the dendrogram in Figure 4. The small clustering distance of muscle and heart expression profiles displays nicely the close biological relation between heart and muscle tissues. We envisage this method of expression profiling and clustering to be particularly useful in analysis, characterization, and identification of single individual organs or organisms in large numbers of mutants or transgenics.
In the work discussed here, cDNAs from a fetal library were used for the analysis of adult tissue. Although in general the chosen fetal stages represent a variety of active genes, some bias might be present in the analysis, resulting from the stage of expression of the chosen organs in 9- and 12-day-old mouse embryos. This could explain why genes that are known to be typical for a given tissue might not be found in the sequenced clones. To overcome this difficulty we will extend this work by using the Unigene set of the National Center for Biotechnology Information (NCBI). A second advantageous optimization would be the implementation of a gene-specific fragment chip, which would require 25,000 different primer pairs for the current mouse Unigene set (http://www.ncbi.nlm.nih.gov/, http://www.rzpd.de). A gene-specific chip offers more hybridization specificity because no common primers are used in the PCR reaction and are therefore not present on the array, where universal 3′ and 5′ ends can lead to cross hybridization.
To get the maximum information content out of the expression-profiling experiments, the technologies of array production and analysis have to be improved. This starts with the development of new surfaces as described by Hoheisel and coworkers, including new surface chemistry (Matysiak et al. 1999), followed by efficient liquid transfer systems and new labeling reagents to more sensitive detection methods.
It has to be stated that there is still a big need to judge and interpret the obtained results. This is true for the analysis of the 5,376 BLAST searches done for this work in the public databases and the huge amount of data obtained from the expression arrays. Currently the human factor is still needed to judge some of the obtained results, and new software developments are necessary to analyze all of the obtained data. The liver cluster 508 displayed in Figure 6B, although very small, with nine members, illustrates adequately this main challenge of array-based experiments. On one hand, known interactions, in this case very specific signals for five genes that are already known to be upregulated in liver, were found in GenBank, while two sequences gave no matches in public databases. Further experiments (Northern blot analysis, whole-mount in situ experiments) are required to determine the functions of previously uncharacterized DNA sequences. While in the case of four new sequences this seems possible for every individual sequence, clustering techniques might be useful to identify similar groups in larger ensembles, from which representatives can be analyzed to characterize whole subgroups.
All data obtained in the work described here will be made available to the scientific community at the Resource Center of the German Genome Project on the Internet at http://www.rzpd.de/. This will allow other researchers to have easy access to protocols and results described here and to use the obtained information in their work as digital comparisons for Northern blot analysis.
METHODS
Rearraying and PCR Amplification of Normalized cDNA Libraries
The results for cDNA library construction, oligonucleotide fingerprinting, and PCR amplification of cDNA inserts were described previously (Meier-Ewert et al. 1998). Consecutive spotting and sequencing were performed as described by Radelof et al. (1998). In brief, we defined a Unigene sublibrary as a library that contains only cluster representatives with member sizes from two to four. In order to prepare the Unigene sublibrary, all microtiter-plate positions of the selected cluster representatives were identified in the corresponding bacterial cultures. New microtiter plates containing the bacterial growth media were inoculated. The sublibrary was rearrayed into 14 384-well plates with a rearraying robot (Linear Drives, England). After incubation at 37°C overnight, cDNA inserts were amplified by PCR. The primers used for the PCR reaction were 5′ amino-modified derivatives of the primers used by Meier-Ewert et al. (1998). Prior to spotting, the PCR products obtained with amino-modified primers were purified by ethanol precipitation in 96-well plates. To 80 μL of the PCR reactions, 4 μL of 3 M sodiumacetate pH 5.2 and 110 μL of absolute ethanol were added. The whole reaction was centrifuged for 1 hr at 20°C with a speed of 2,800 rpm. The supernatant was discarded and 100 μL of fresh 70% ethanol was added. This reaction was centrifuged at 2,800 rpm for 45 min at 20°C. The supernatant was discarded again before leaving the plates to dry overnight in a cold room. After resuspending the pellets in 70 μL of 0.1 M NaOH, the plates were used for spotting. The PCR products spotted to the glass slides had a DNA concentration of 20–50 ng/μL. Forty-eight PCR reactions of each 384-well plate were analyzed on a 1.2% Agarose gel. All arrays used in this publication were spotted from the same PCR reaction.
Preparation of Glass Slides
Normal floating glass was cut to a size of 9 × 13 cm. After cleaning with 30% NH3 at 50°C for 1 hr, the glass slides were boiled under reflux in Xylene containing 20% (w/v) of (3-Glycidoxypropyl)-trimethoxysilane (Sigma, Germany) and 1% (w/v) N-Ethyl-diisoproplyamin for 6 hr. After coating, the slides were briefly rinsed once in methanol and once in ether and were dried in a nitrogen stream for 3 min; the slides could then be used immediately for spotting.
Production of cDNA Arrays
Spotting was performed with a 384-pin tool with individually spring-loaded pins. To prevent cross contamination and to achieve easy cleaning of the spotting pins, blunt-end tips were utilized. The transfer volume of the pins was calculated from the geometry of the droplets formed at the pins print-tip ends. All images shown in Figure 1 were taken with a calibrated camera system (PCO Variocam, Germany). All arrays used for the work described here were printed with cylindrical pins with a plain print-tip end and a diameter of 250 μm. The volume of the solution at the pins' end was calculated from the equation V = π * h * (3 * a2 + h2)/6, where h is the height of the sphere and a is the radius. The mean value for the pins used was measured to 2.5 nL. When pins are used for spotting, approximately 10%–20% of the liquid is taken away from the slide with the pin so that the final amount of liquid transfer volume was estimated to 2–3 nL. Four glass slides were processed in parallel. For routine analysis, 5,376 clones were spotted in an array of 384 blocks. Each block (6 × 6 spots) consisted of two Arabidopsis thaliana control clones (GenBank accession numbers AF104328 and U29785, derived from the Arabidopsis Biological Resource Center and DNA stock donor at Ohio State University) and 14 mouse clones spotted in duplicate. Four spotting positions were left blank for later background normalization. Spotting the clones in duplicates provides the means to detect large deviations in the hybridization intensity of a specified clone and therefore enables error detection. In addition to this error detection method, the A. thaliana controls were used to normalize variations in spotting and cDNA immobilization yields in different areas of the slide (Schuchhardt et al. 2000).
Complex cDNA Hybridization
For the preparation of mRNA, total RNA was isolated from mouse heart, brain, liver, lung, spleen, and kidney tissues by using RNAgents Total RNA Isolation System (Promega, USA) and mRNA was isolated by the Oligotex mRNA Kit (Qiagen, Germany). For the labeling reaction, 0.5 μg of polyA+ RNA were incubated with random hexamers (1 μL a of solution with 50 A260 [Pharmacia, Germany]) in a total volume of 10 μL RNAse-free water (Qiagen) at 70°C for 5 min. After chilling on ice for 2 min, the reverse transcription reaction was prepared in 6 μL of 5x first-strand synthesis buffer (Gibco, Germany); 3 μL of 0.1 M-DTT (Gibco); 1 μL of RNase-block (Ambion, Germany); 1.5 μL of a nucleotide mix containing 20 mM dATP, 20 mM dTTP, 20 mM dGTP, and 0.1 mM dCTP; and 7 μL (10 μCi/μL) of α-33P dCTP (Amersham, Germany). After incubation at 37°C for 2 min, 1.5 μL of SuperScript II (Gibco) reverse transcriptase (200 u/μL) was added, and the reverse transcription was performed at 37°C for 1 hr. Prior to hybridization, 20 ng of Arabidopsis thaliana DNA template was labeled with a random priming labeling reaction (Amersham). Controls and complex probes were purified using a Sephadex G50 column. For hybridization, two spotted glass slides were fixed face-to-face with a 0.5-mm hand-cut rubber spacer. For additional sealing, all glass edges were sealed with Parafilm and put into liquid wax to form a sandwich hybridization chamber. The arrays were prehybridized for at least 30 min at 42°C in 4.5 mL DIG EasyHyb buffer (Roche Molecular Biochemicals, Germany). Hybridizations were carried out in a custom-built overhead rotator overnight at 42°C in 4.5 mL DIG EasyHyb buffer (Roche Molecular Biochemicals) containing 0.5 μg of labeled mRNA probe and 5 ng of the A. thaliana control probe. After hybridization, the washing was done at 65 °C.
Image Analysis and Quantification of Complex cDNA Hybridization
The arrays were exposed for 16 hr to Fuji BAS-SR 2025 intensifying screens (Raytest, Germany) and scanned at 25-μm resolution with a Fuji BAS 5000 phosphorimager (Raytest). The files were analyzed with a custom-written image analysis system based on a Windows NT 4.0 platform. (Biochip Explorer, http://www.gpc-ag.com). Numerical values of spot intensities were transferred to the S-PLUS spreadsheet calculation programs for normalization and analysis.
Analysis of Expression Profiles by Clustering Algorithms
To enable quantification of the expression profiles, hybridization intensities have to be normalized to minimize the influence of interfering parameters. In our experiments the gene expression data were normalized to the mean intensity value of a clone after subtracting the local background intensity from the expression intensity of each pair of clone spots and averaging this value over four hybridizations on four slides for a specified tissue. For the identification of clones with identical or similar expression patterns, a hierarchical clustering algorithm was used. Hierarchic methods generate clusters as nested structures in a hierarchical fashion; the clusters of higher levels are aggregations of the clusters of lower levels. We used an agglomerative clustering method, which constructs the hierarchy from bottom to top. Agglomerative clustering can be presented in the following unified way. Let (dij) be a dissimilarity entity-to-entity matrix. Then find the minimal value di*j* in the dissimilarity matrix, and merge clusters i* and j*. Transform the distance matrix, substituting one new row (and column) i* ∪ j* instead of the rows and columns i*, j* with its dissimilarities defined as di, i* ∪ j* = F(dii*, dij*, di*j*, h(i),h(i*),h(j*)), where F is a fixed (usually linear) function and h(i) is an index function defined for every cluster recursively. As a distance function F the Euclidean distance was used. The Euclidean distance d(x, y), x, y ∈ Rn can be defined as the norm of the difference x − y = (x1 − y1 … xn − yn):
 |
Because we had no information about the nature of the expected clusters we chose the average linkage method for generating the clusters. With this hierarchical method the between-cluster distance di*j*is defined as the average of the distances dij by all i ∈ i*,j ∈ j*:
 |
Acknowledgments
We thank the German Ministry for Research and Education for funding this work with grant 0311018, Leo Schalkwyk for critical reading of the manuscript, and Steffen Schulze-Kremer for maintaining the expression data homepage at the Resource Center/Primary Database (RZPD).
The publication costs of this article were defrayed in part by payment of page charges. This article must therefore be hereby marked “advertisement” in accordance with 18 USC section 1734 solely to indicate this fact.
Footnotes
E-MAIL eickhoff@molgen.mpg.de; FAX 49 30 84131380.
REFERENCES
- Adams MD, Soares MB, Kerlavage AR, Fields C, Venter JC. Rapid cDNA sequencing (expressed sequence tags) from a directionally cloned human infant brain cDNA library. Nat Genet. 1993;4:373–380. doi: 10.1038/ng0893-373. [DOI] [PubMed] [Google Scholar]
- Bertucci F, Bernard K, Loriod B, Chang YC, Granjeaud S, Birnbaum D, Nguyen C, Peck K, Jordan BR. Sensitivity issues in DNA array–based expression measurements and performance of nylon microarrays for small samples. Hum Mol Genet. 1999;8:1715–1722. doi: 10.1093/hmg/8.9.1715. [DOI] [PubMed] [Google Scholar]
- Boguski M, Schuler G. Establishing a human transcript map. Nat Genet. 1995;10:369–371. doi: 10.1038/ng0895-369. [DOI] [PubMed] [Google Scholar]
- Brown PO, Botstein D. Exploring the new world of the genome with DNA microarrays. Nat Genet. 1999;21:33–37. doi: 10.1038/4462. [DOI] [PubMed] [Google Scholar]
- Chee M, Yang R, Hubbell E, Berno A, Huang XC, Stern D, Winkler J, Lockhart DJ, Morris MS, Fodor SP. Accessing genetic information with high-density DNA arrays. Science. 1996;274:610–614. doi: 10.1126/science.274.5287.610. [DOI] [PubMed] [Google Scholar]
- DeRisi J, Penland L, Brown PO, Bittner ML, Meltzer PS, Ray M, Chen Y, Su YA, Trent JM. Use of a cDNA microarray to analyse gene expression patterns in human cancer. Nat Genet. 1996;14:457–460. doi: 10.1038/ng1296-457. [DOI] [PubMed] [Google Scholar]
- DeRisi JL, Iyer VR, Brown PO. Exploring the metabolic and genetic control of gene expression on a genomic scale. Science. 1997;278:680–686. doi: 10.1126/science.278.5338.680. [DOI] [PubMed] [Google Scholar]
- Duggan DJ, Bittner M, Chen YD, Meltzer P, Trent JM. Expression profiling using cDNA microarrays. Nat Genet. 1999;21:10–14. doi: 10.1038/4434. [DOI] [PubMed] [Google Scholar]
- Eisen MB, Spellman PT, Brown PO, Botstein D. Cluster analysis and display of genome-wide expression patterns. Proc Nat Acad Sci. 1998;95:14863–14868. doi: 10.1073/pnas.95.25.14863. [DOI] [PMC free article] [PubMed] [Google Scholar]
- Gemmill RM, West JD, Boldog F, Tanaka N, Robinson LJ, Smith DI, Li F, Drabkin HA. The hereditary renal cell carcinoma 3;8 translocation fuses FHIT to apatched-related gene, TRC8. Proc Nat Acad Sci. 1998;95:9572–9577. doi: 10.1073/pnas.95.16.9572. [DOI] [PMC free article] [PubMed] [Google Scholar]
- Granjeaud S, Nguyen C, Rocha D, Luton R, Jordan BR. From hybridization image to numerical values: a practical, high throughput quantification system for high density filter hybridizations. Genet Anal. 1996;12:151–162. doi: 10.1016/1050-3862(95)00128-x. [DOI] [PubMed] [Google Scholar]
- Gress TM, Hoheisel JD, Lennon GG, Zehetner G, Lehrach H. Hybridization fingerprinting of high-density cDNA-library arrays with cDNA pools derived from whole tissues. Mamm Genome. 1992;3:609–619. doi: 10.1007/BF00352477. [DOI] [PubMed] [Google Scholar]
- Gress TM, Muller-Pillasch F, Geng M, Zimmerhackl F, Zehetner G, Friess H, Buchler M, Adler G, Lehrach H. A pancreatic cancer-specific expression profile. Oncogene. 1996;13:1819–1830. [PubMed] [Google Scholar]
- Hoheisel JD. Oligomer-Chip Technology. Trends Biotechnol. 1997;15:465–469. [Google Scholar]
- Iyer VR, Eisen MB, Ross DT, Schuler G, Moore T, Lee JCF, Trent JM, Staudt LM, Hudson J, Boguski MS, et al. The transcriptional program in the response of human fibroblasts to serum. Science. 1999;283:83–87. doi: 10.1126/science.283.5398.83. [DOI] [PubMed] [Google Scholar]
- Jordan BR. Large-scale expression measurement by hybridization methods: from high-density membranes to “DNA chips.”. J Biochem. 1998;124:251–258. doi: 10.1093/oxfordjournals.jbchem.a022104. [DOI] [PubMed] [Google Scholar]
- Lashkari DA, DeRisi JL, McCusker JH, Namath AF, Gentile C, Hwang SY, Brown PO, Davis RW. Yeast microarrays for genome wide parallel genetic and gene expression analysis. Proc Nat Acad Sci. 1997;94:13057–13062. doi: 10.1073/pnas.94.24.13057. [DOI] [PMC free article] [PubMed] [Google Scholar]
- Lehrach H, Drmanac R, Hoheisel J, Larin Z, Lennon G, Monaco AP, Nizetic D, Zehetner G, Poustka A. Genome analysis. Vol. 1. Genetic and physical mapping, pp. 39–81. Cold Spring Harbor Laboratory Press: Cold Spring Harbor, NY. 1990. Hybridization fingerprinting in genome mapping and sequencing. [Google Scholar]
- Lennon GG, Lehrach H. Hybridization analyses of arrayed cDNA libraries. Trends Genet. 1991;7:314–317. doi: 10.1016/0168-9525(91)90420-u. [DOI] [PubMed] [Google Scholar]
- Liang P, Pardee A. Differential display of eukaryotic messenger RNA by means of the polymerase chain reaction. Science. 1992;257:967–971. doi: 10.1126/science.1354393. [DOI] [PubMed] [Google Scholar]
- Lipshutz RJ, Fodor SP, Gingeras TR, Lockhart DJ. High density synthetic oligonucleotide arrays. Nat Genet. 1999;21:20–24. doi: 10.1038/4447. [DOI] [PubMed] [Google Scholar]
- Matysiak S, Hauser N, Wurtz S, Hoheisel J. Improved solid supports and spacer/linker systems for the synthesis of spatially addressable PNA-libraries. Nucleosides Nucleotides. 1999;18:1289–1291. [Google Scholar]
- Meier-Ewert S, Lange J, Gerst H, Herwig R, Schmitt A, Freund J, Elge T, Mott R, Herrmann B, Lehrach H. Comparative gene expression profiling by oligonucleotide fingerprinting. Nucleic Acids Res. 1998;26:2216–2223. doi: 10.1093/nar/26.9.2216. [DOI] [PMC free article] [PubMed] [Google Scholar]
- Nature Genetics. 1999. 21: Supplement January. Nature America.
- Nguyen C, Rocha D, Granjeaud S, Baldit M, Bernard K, Naquet P, Jordan BR. Differential gene expression in the murine thymus assayed by quantitative hybridization of arrayed cDNA clones. Genomics. 1995;29:207–216. doi: 10.1006/geno.1995.1233. [DOI] [PubMed] [Google Scholar]
- Pietu G, Alibert O, Guichard V, Lamy B, Bois F, Leroy E, Mariage-Sampson R, Houlgatte R, Soularue P, Auffray C. Novel gene transcripts preferentially expressed in human muscles revealed by quantitative hybridization of a high density cDNA array. Genome Res. 1996;6:492–503. doi: 10.1101/gr.6.6.492. [DOI] [PubMed] [Google Scholar]
- Poustka A, Pohl T, Barlow DP, Zehetner G, Craig A, Michiels F, Ehrich E, Frischauf AM, Lehrach H. Molecular approaches to mammalian genetics. Cold Spring Harbor Symp Quant Biol. 1986;51:131–139. doi: 10.1101/sqb.1986.051.01.016. [DOI] [PubMed] [Google Scholar]
- Poustka A, Herwig R, Krause A, Hennig S, Meier-Ewert S, Lehrach H. Toward the gene catalogue of sea urchin development: the construction and analysis of an unfertilized egg cDNA library highly normalized by oligonucleotide fingerprinting. Genomics. 1999;5:122–133. doi: 10.1006/geno.1999.5852. [DOI] [PubMed] [Google Scholar]
- Radelof U, Hennig S, Seranski P, Steinfath M, Ramser J, Reinhardt R, Poustka A, Francis F, Lehrach H, Gress TM, et al. Preselection of shotgun clones by oligonucleotide fingerprinting: an efficient and high throughput strategy to reduce redundancy in large-scale sequencing projects. Nucleic Acids Res. 1998;26:5358–5364. doi: 10.1093/nar/26.23.5358. [DOI] [PMC free article] [PubMed] [Google Scholar]
- Schena M, Shalon D, Davis RW, Brown PO. Quantitative monitoring of gene expression patterns with a complementary DNA microarray. Science. 1995;270:467–470. doi: 10.1126/science.270.5235.467. [DOI] [PubMed] [Google Scholar]
- Schena M, Shalon D, Heller R, Chai A, Brown PO, Davis RW. Parallel human genome analysis: microarray-based expression monitoring of 1000 genes. Proc Nat Acad Sci. 1996;93:10614–10649. doi: 10.1073/pnas.93.20.10614. [DOI] [PMC free article] [PubMed] [Google Scholar]
- Schuchhardt J, Beule D, Malik A, Wolski E, Eickhoff H, Lehrach H, Herzel H. Normalization strategies for cDNA microarrays. Nucleic Acids Res. 2000;28:E47. doi: 10.1093/nar/28.10.e47. [DOI] [PMC free article] [PubMed] [Google Scholar]
- Southern EM. DNA Fingerprinting by hybridisation to oligonucleotide arrays. Electrophoresis. 1995;16:1539–1542. doi: 10.1002/elps.11501601256. [DOI] [PubMed] [Google Scholar]
- Velculescu V, Zhang L, Vogelstein B, Kinzler K. Serial analysis of gene expression. Science. 1995;270:484–487. doi: 10.1126/science.270.5235.484. [DOI] [PubMed] [Google Scholar]
- Wilkinson DG, Nieto MA. Detection of messenger RNA by in situ hybridization to tissue sections and whole mounts. Methods Enzymol. 1993;225:361–373. doi: 10.1016/0076-6879(93)25025-w. [DOI] [PubMed] [Google Scholar]
- Zhang L, Zhou W, Velculescu VE, Kern S, Hruban RH, Hamilton SR, Vogelstein B, Kinzle RKW. Gene expression profiles in normal and cancer cells. Science. 1997;276:1268–1272. doi: 10.1126/science.276.5316.1268. [DOI] [PubMed] [Google Scholar]


