Ultra-high resolution spectral domain–optical coherence tomography was used to measure Bowman's layer thickness in vivo. Topographic thicknesses of the epithelium and the Bowman's layer along the horizontal meridian in human eyes were determined.
Abstract
Purpose.
To characterize the thickness profile of the corneal epithelium and the Bowman's layer across the horizontal meridian.
Methods.
Forty-four eyes of 22 healthy subjects were investigated in this study. Ultra-high resolution anterior segment spectral domain–optical coherence tomography (SD-OCT) was used to assess the topographic thickness of the epithelium and the Bowman's layer across the cornea. Thicknesses at five locations, including the center, midperiphery, and periphery close to the limbus, on both the nasal and the temporal sides along the horizontal meridian, were analyzed.
Results.
Mean epithelial thickness at the central cornea was 52.5 ± 2.4 μm. It increased gradually from the center to the periphery (P < 0.001). There was no significant difference between the nasal side and the temporal side for epithelial thickness. The central Bowman's layer thickness was 17.7 ± 1.6 μm, and it remained constant from the center to the midperiphery (P > 0.05). However, thicknesses at the nasal and temporal periphery, 20.0 ± 1.9 μm and 19.8 ± 2.2 μm, respectively, were significantly greater than the central and midperipheral thicknesses (P < 0.001). Nasal and temporal thicknesses were similar on either side of the center.
Conclusions.
The epithelium and the Bowman's layer were not evenly distributed across the horizontal meridian of the cornea. SD-OCT provided useful information about topographic thickness of the different corneal layers in vivo.
Bowman's layer and the basal lamina are important in the maintenance and support of the ocular surface.1 For instance, the integrity of Bowman's layer and the basal lamina prevent the eyes from developing persistent epithelial defects after transplantation.2 Additionally, a cellular proliferative response initiated by disruption of the Bowman's layer and the basal lamina occurs in advanced bullous keratopathy.1 Recently, characteristics of the central and peripheral Bowman's layer, close to the limbus, have drawn increased clinical attention, especially for designing refractive surgery and detecting corneal disease. A variety of techniques have been used to assess Bowman's layer in both healthy and diseased human corneas.3–5 However, each of these methods has some limitations. Confocal microscopy is an invasive technique with the potential of causing corneal lesions or transmitting infections, and it is impossible to measure exactly the same locations within the cornea in serial examinations. Electron microscopy allows only histopathologic findings. Thus, there are only a few published characterizations of Bowman's layer at the periphery, close to the limbus.
Recent advances in optical coherence tomography (OCT) have enabled exact and rapid cross-sectional imaging of the cornea without direct contact between the eye and the instrument. OCT has excellent repeatability and accuracy.6–8 Spectral domain OCT (SD-OCT) is an advanced technique that has enhanced resolution compared with conventional time domain OCT. The high-speed imaging modality enables analysis of the topographic thickness of the epithelium, Bowman's layer, stroma, and the total cornea. The purpose of this study was to evaluate by ultra-high resolution SD-OCT the epithelial and Bowman's layer profile along the horizontal meridian in healthy human eyes.
Subjects and Methods
This study was approved by the Institutional Review Board for Human Research of the University of Miami. All subjects signed consent forms and were treated according to the tenets of the Declaration of Helsinki. Twenty-two healthy subjects (11 women, 11 men; mean ± SD age, 35.5 ± 12.0 years; range, 24–76 years) were recruited and divided into two groups. The first group consisted of five subjects who were older than 40 years, and the second group consisted of 17 subjects who were younger than 40 years. Healthy subjects were defined as those who had no current ocular or systemic diseases and no history of ocular surgery. Subjects were scheduled for treatment after 10:00 AM to avoid corneal edema induced from overnight eye closure.
A custom-built, ultra-high resolution SD-OCT prototype was used to assess corneal thickness across the horizontal meridian.9 The system contained a superluminescent diode light source (Broadlighter, T840-HP; Superlumdiodes Ltd., Moscow, Russia) with a 100-nm bandwidth centered at 840 nm. It was connected to a telecentric light delivery system and was mounted on a standard slit lamp. The maximum scan width was 15 mm, and the scan depth was set at 3 mm in air. The calibrated axial resolution of this device was 3 μm in the cornea, and the acquisition rate of the OCT system was approximately 24,000 A-lines per second. After the light was aligned perpendicularly to the corneal surface, images were acquired using a 12-mm horizontal scan, and each image consisted of 2048 A-lines.
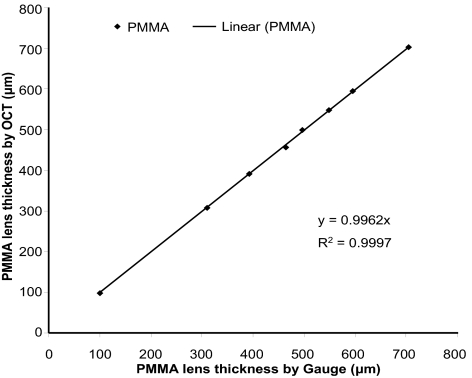
As described previously for calibrating time-domain OCT instruments,10 this custom-built SD-OCT prototype was calibrated using a set of polymethylmethacrylate (PMMA) lenses of known thicknesses ranging from 300 μm to 700 μm. Using the Chott dispersion formula for PMMA in a software program (Zemax; Software for Optical Design, Tucson, AZ), the refractive index of PMMA was 1.485 at 830 nm, the light wavelength used. Six OCT measurements were taken centrally in each PMMA lens. The true thickness of each PMMA lens was measured with an electronic thickness gauge (ET-1; Rehder Development Co., Castro Valley, CA). Calibrated results showed strong agreement with an accuracy that was within 0.5 μm of the true thickness (Fig. 1). A refractive index of 1.389 was used to calculate all layers.11
Figure 1.
System calibration. A set of PMMA lenses with known thicknesses ranging from 400 μm to 700 μm were imaged with a custom SD-OCT prototype. The results were in strong agreement with the thicknesses obtained with an electronic thickness gauge.
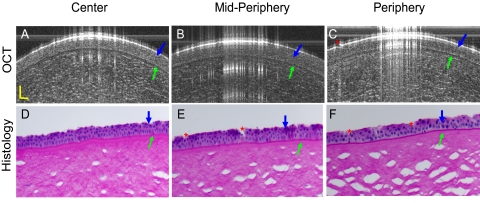
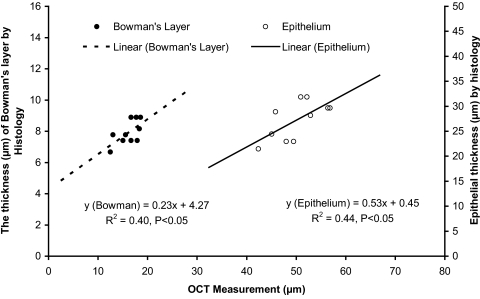
To further validate the measurement of the epithelium and Bowman's layer in the human eye, two cadaver eyes (FLEB 10–01-085) were obtained from the Florida Lions Eye Bank. The eyes were from an 84-year-old woman. OCT imaging of the eye with the same instrument used for the in vivo measurements was performed approximately 48 hours after death. Scan locations were the center, midperiphery, and periphery on both nasal and temporal sides around the horizontal meridian. After imaging with OCT, the eye globes were sent to the histology laboratory at the Bascom Palmer Eye Institute. The globes were fixed in 10% buffered formalin, dehydrated, and embedded in paraffin. Slides, sectioned at 5 μm, were stained with periodic acid-Schiff and were analyzed using a light microscope (Olympus Optical Co., Tokyo, Japan). The mean thickness of both epithelium and Bowman's layer, at locations similar to those used for OCT imaging, was determined by three measurements at each site. The magnification was 400×. The epithelium and Bowman's layer were clearly visualized in both the OCT and the histologic images (Fig. 2). The ratios between epithelium and Bowman's layer thicknesses were similar. Among the five locations in the epithelium that were imaged for both eyes, there was a significant correlation between the thicknesses measured by OCT and those measured by histology (Fig. 3). There was a similar significant correlation in the measurement of Bowman's layer thickness (Fig. 3). However, the average epithelial and Bowman's membrane thickness at each of the five locations were significantly thinner in the histologic images than in the OCT images. These differences were most likely caused by the tissue dehydration required for histologic preparation. We reported a similar phenomenon in our previous study of Descemet's membrane.12 In addition, both eyes of one of the authors (JW) were imaged with the commercially available anterior segment OCT (Visante OCT; Carl Zeiss Meditec, Inc., Dublin, CA) for comparison with the SD-OCT. The averaged corneal thickness was 547 μm with the Zeiss OCT and 536 μm with the SD-OCT, and the averaged epithelium thickness was 51.3 μm with the Zeiss OCT and 52.8 μm with the SD-OCT. Although the results were very close, the slight difference may be attributed to the assumption of the group refractive index used in these devices. Image quality of the different optical resolutions might also have contributed to the differences between the devices.
Figure 2.
Comparison of SD-OCT and histologic images of human corneal epithelium and Bowman's layer. A cadaver eye (84-year-old woman, 48 hours after death, right eye) was imaged by OCT at the center, midperipheral, and peripheral locations on the horizontal meridian (A–C). After that, the tissue was fixed, embedded, section, and stained with periodic acid-Schiff reagent. It was imaged by light microscopy at 400× magnification at similar locations as the OCT images around the same meridian (D–F). The epithelium (blue arrows) and Bowman's layer (green arrows) were clearly visualized. The ratio between the epithelium and Bowman's layer appeared similar between the OCT and histologic images. The discontinuous epithelium (C, E, F, red asterisks) was attributed to the loss of the epithelial cells during histologic processing. Scale bars, 50 μm.
Figure 3.
Correlations between SD-OCT and light microscopy measurements. Two cadaver eyes were imaged by OCT and light microscopy at five locations: the center, nasal and temporal midperiphery, and nasal and temporal periphery around the horizontal meridian. OCT measurements were taken on the fresh eyes approximately 48 hours after death, and histologic measurements were taken after preparation for light microscopy and staining with periodic acid-Schiff reagent (magnification, 400×). There was a significant correlation between the thickness measurements of the epithelium made by OCT and light microscopy. A similar correlation existed for Bowman's layer measurements. Differences in thicknesses between two methods were likely due to the dehydration necessary for histologic preparation and the resultant tissue shrinkage.
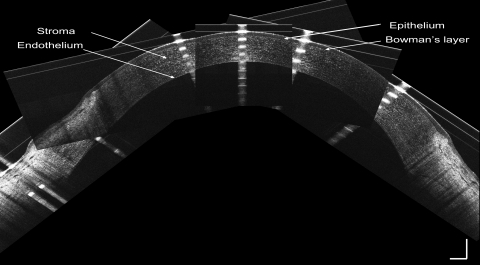
To measure the thickness along the horizontal meridian, a fixation dot was marked on the slit-lamp arm, and the angle between the slit-lamp arm and the OCT probe was set at 0°, 20°, or 40° nasally and temporally. Five defined standardized points of the cornea across the horizontal meridian were evaluated (Fig. 4), including the central region (apex) of the cornea (0°), the midperiphery on either side of the center (20°), and the periphery close to the limbus on both the nasal and the temporal sides (40°). Each subject was asked to rest his or her chin on the slit-lamp and to look at the fixation target at different points. Images were obtained when the specular reflection was observed, indicating the OCT beam was perpendicular to the corneal surface. The average of three successive measurements was taken as the thickness of the cornea for each eye.
Figure 4.
SD-OCT Images of the central, midperipheral, and peripheral cornea. Five different locations of the cornea, including center, midperiphery, and periphery, on both nasal and temporal sides, were obtained in the horizontal meridian across the apex. Scale bars, 500 μm.
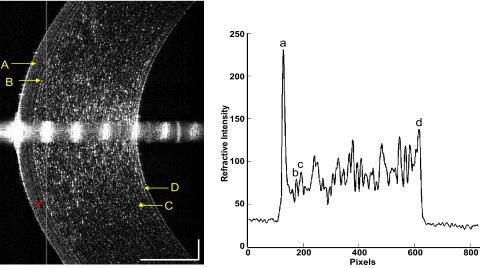
Thicknesses of the corneal epithelium, Bowman's layer, stroma, and total cornea were calculated by computing software (MatLab, version 7.1; MathWorks, Inc., Natick, MA). To avoid the distortion of the central specular hyperreflective reflex of each image, the central 50 axial scans (0.30-mm width) were removed. After that, 10 axial scans on each side of the image were processed to yield OCT longitudinal reflectivity profiles from the corneal endothelium to the epithelium. A low-pass signal filter was used to reduce the noise and to smooth the reflectivity profile. Boundaries for corneal layers were identified by the peaks of the reflectivity profiles. The thickness of each layer equaled the distance between the corresponding two peaks, as described previously (Fig. 5).13
Figure 5.
Central cornea imaged with SD-OCT and longitudinal reflectivity profile. Left: central cornea imaged with SD-OCT. The cornea and its sublayers can be visualized. (A) Epithelium. (B) Bowman's layer. (C) Stroma. (D) Endothelial-Descemet's membrane complex. Note the dark band (asterisk) may be the basal cell layer of the epithelium. Right: longitudinal reflectivity profile generated by the average of center 20 A-scans after removing the strong reflectivity at center corneal apex. The distance between peaks (a) and (b) correspond to the thickness of the epithelium. The distance between peaks (b) and (c) correspond to the thickness of Bowman's layer. The distance between peaks (c) and (d) correspond to the thickness of the stroma. The total corneal thickness was the distance between peaks (a) and (d). Scale bars, 250 μm.
Statistical software (SPSS, version 13.0; SPSS, Cary, NC) was used for data analysis. Changes in thickness from the center to the periphery were tested by repeated-measures analysis of variance and post hoc testing. Statistical significance was accepted when P < 0.05. Comparisons between groups were conducted with the independent samples t-test. Values were expressed as mean ± SD of the 44 eyes studied.
Results
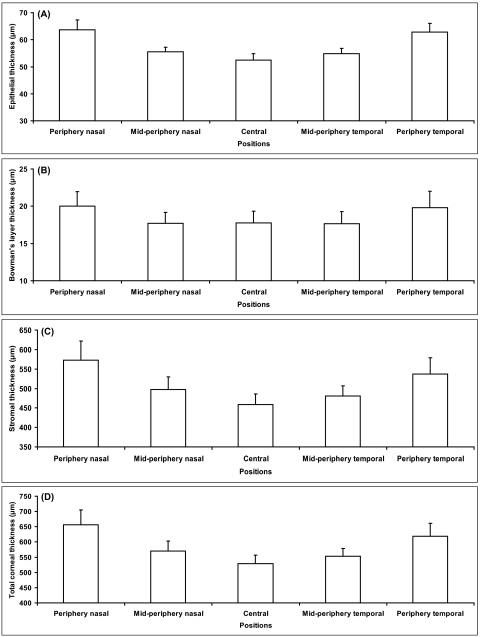
There were no significant differences in each of these measured layers between left and right eyes (paired-samples t-test, P > 0.05). Mean epithelial thickness at the central cornea (apex) was 52.5 ± 2.4 μm (range, 45.4–56.4 μm). It increased gradually from the central point to the periphery (post hoc analysis, P < 0.001 for all pairwise comparisons of central, midperipheral, and peripheral thickness; Table 1, Fig. 6). There was no significant difference between the nasal side and the temporal side regarding epithelial thickness.
Table 1.
Topographic Thickness of Epithelium, Bowman's Layer, Stroma, and Total Cornea across the Horizontal Meridian in Healthy Subjects
| Peripheral Thickness Nasal Side | Midperipheral Thickness Nasal Side | Central Thickness | Midperipheral Thickness Temporal Side | Peripheral Thickness Temporal Side | |
|---|---|---|---|---|---|
| Epithelium, μm | 63.7 ± 3.6* | 55.5 ± 1.7* | 52.5 ± 2.4 | 54.8 ± 2.0* | 62.8 ± 3.2* |
| Bowman's layer, μm | 20.0 ± 1.9* | 17.7 ± 1.5 | 17.7 ± 1.6 | 17.7 ± 1.6 | 19.8 ± 2.2* |
| Stroma, μm | 572.9 ± 48.6* | 497.3 ± 32.9* | 459.1 ± 26.8 | 480.4 ± 26.3* | 536.6 ± 40.8* |
| Total cornea, μm | 656.7 ± 48.9* | 570.5 ± 33.0* | 529.4 ± 27.1 | 552.8 ± 26.3* | 619.3 ± 41.6* |
P < 0.001 compared with the central thickness.
Figure 6.
Topographic thickness of epithelium, Bowman's layer, stroma, and total cornea along the horizontal meridian. (A) Epithelial thickness at five locations across the cornea. (B) Bowman's layer thickness at five locations across the cornea. (C) Stromal thickness at five locations across the cornea. (D) Total corneal thickness at five locations across the cornea.
Central Bowman's layer thickness was 17.7 ± 1.6 μm (range, 13.0–21.5 μm), and it remained constant from the center to the midperiphery locations (post hoc analysis, P > 0.05). However, the thickness at the nasal and the temporal periphery (20.0 ± 1.9 μm and 19.8 ± 2.2 μm, respectively) were significantly greater than the central and midperipheral thicknesses (post hoc analysis, P < 0.001). Nasal and temporal thicknesses were similar on either side of the center (Table 1, Fig. 6).
Stromal thickness at the center was 459.1 ± 26.8 μm (range, 399.8–511.6 μm). Among the five locations evaluated, the central stroma was the thinnest, followed (in order of increasing thickness) by temporal midperiphery, nasal midperiphery, temporal periphery, and nasal periphery (post hoc analysis, P < 0.001; Table 1, Fig. 6).
Thickness of the total cornea progressively increased from the center to the periphery. The mean value was 529.4 ± 27.1 μm (range, 473.3 μm-585.2 μm) at the center and increased from 619.3 ± 41.6 μm to 656.7 ± 48.9 μm at the periphery (Table 1, Fig. 6). There were significant differences among the five positions measured for the total corneal thickness (post hoc analysis, P < 0.001). The central cornea was the thinnest and the nasal periphery was the thickest. Midperipheral and peripheral thicknesses on the nasal side were thicker than those on the temporal side.
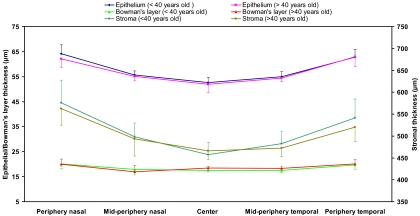
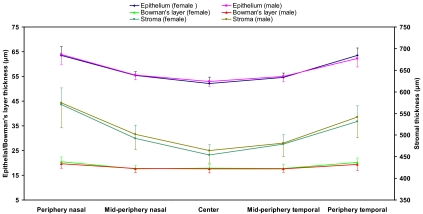
None of the thicknesses of the corneal layers differed significantly between the two age groups (independent samples t-test, P > 0.05; Fig. 7), and there were no significant differences between female and male subjects (independent samples t-test, P > 0.05; Fig. 8).
Figure 7.
Thickness comparison between age groups. The entire study population was divided into old (older than 40 years) and young (younger than 40 years old) subgroups. There were no significant differences between these two age groups (P > 0.05) in any of the layers or locations. Error bars denote SD.
Figure 8.
Thickness comparison between men and women. There were no significant differences between men and women (P > 0.05) in any of the layers or locations. Error bars denote SD.
Discussion
The epithelium is a self-renewing layer, and constancy of epithelial thickness is essential for ocular refraction. The mean central epithelial thickness in this study was 52.5 μm, which is in agreement with previously reported values obtained by different techniques.14,15 The standard deviations obtained in our study were remarkably lower than those reported by others, implying that the current method is more reproducible.14,15 Other authors have used time-domain OCT or modified optical pachymetry and found that peripheral epithelial thickness remained constant along the horizontal meridian.14,16 In contrast, we found that the mean epithelial thickness, along with the SD, increased gradually from the center to the periphery. Using high-frequency digital ultrasound, Reinstein et al.17 characterized a similarly nonuniform thickness profile of the epithelium across the cornea. The inconsistency of results suggesting that epithelial thickness may or may not vary with location along the horizontal meridian may be partly attributed to the different resolutions of the instruments for assessing epithelial thickness. The resolution of the commercially available time-domain OCT system is approximately 10 μm, whereas that of our system was approximately 3 μm.
Bowman's layer is an acellular interface between the epithelium and the stroma.1 The resolution of the current SD-OCT system was 3 μm; therefore, individual reflective signals corresponding to the front and back surfaces of Bowman's layer appeared as single peaks in the reflectivity profile. Typical reported thicknesses of the central Bowman's layer are 10 to 20 μm,18 which are supported by the values obtained in this study. However, electron microscopic studies reported that the thickness was 8 to 12 μm.19,20 The methods of electron microscopy, which include fixation, rinsing, and dehydration, may account for these differences. Using confocal microscopy, Li et al. reported that central Bowman's layer thickness was 16.6 μm.21 Using a different type of ultra-high resolution OCT with the center wavelength of 1060 nm as the light source,22 the Bowman's layer thickness was 18.3 μm at the central location of the cornea. In the present study, the central Bowman's layer thickness was 17.7 μm, which was in strong agreement with these published data. We have included the results of histology by comparing the thickness of Bowman's layer between OCT and histology. The results demonstrate the significant relation, but the correlation was not very high, most likely because of the preparation of the tissue during histology. Further studies comparing OCT and confocal microscopy in the same group will be needed to further validate the method.
To the best of our knowledge, this is the first report of the thickness profile of Bowman's layer across the horizontal meridian using ultra-high resolution OCT. The results showed that the thickness of Bowman's layer was not uniform but was greater peripherally than centrally. Central Bowman's layer thickness variations, from complete absence to a thickness of 33 μm, have been previously reported.23,24 These data may be used as standards for future comparison with diseased corneas. For instance, Bowman's layer is completely destroyed in patients with advanced bullous keratopathy25 and in those with keratoconus.26 SD-OCT technology allows for the early detection of disease in living human corneas and the evaluation of the efficacy of different approaches to treatment.
SD-OCT imaging can provide useful information for preoperative planning of corneal surgery, and real-time SD-OCT monitoring during surgery may aid in incising the cornea to the proper depth.27 Kermani et al.18 reported real-time monitoring by OCT during laser flap creation, but, in some cases in that study,18 Bowman's layer was not clearly identified because of the relatively low resolution of the OCT used. With the improved resolution and acquisition speeds of SD-OCT, it will be possible to assess the suitability of different surgical techniques. Refractive surgery guided by SD-OCT would ensure sufficient control of the incision plane, increasing the likelihood of a favorable refractive outcome.
The current technique is also helpful for evaluating corneal structure alterations caused by contact lens use. It remains unclear how changes in corneal thickness induce the reduction of corneal refractive power in patients with orthokeratology lenses.7,28 The application of SD-OCT may lead to a more complete, deeper understanding of the mechanism. In addition, although a lot of complications associated with contact lens wear can be easily observed during routine clinic examinations, it is difficult to quantify these changes. The technology in the present study enabled the detection of subtle topographic alterations in each layer of the cornea and the precise measurement of changes in these structures. We chose the superluminescent diode with a wavelength of 840 nm instead of 1310 nm as the light source of our ultra-high resolution OCT because of its higher signal-to-noise ratio.29 The 840-nm light source is widely used in commercial OCT devices for imaging the retina at high-resolution.30 It is also used for ultra-high resolution retinal imaging.31 Another reason is that higher axial resolution can be obtained with the same bandwidth at shorter wavelength than longer ones.32
There are some limitations to this study. First, we measured only five locations across the cornea. There may be slight differences in the actual locations of the midperipheral and peripheral points in each subject because of differences among subjects in horizontal corneal diameter. Second, the refractive index of each layer of the cornea is not uniform,33 and it remains unclear whether it changes from central to peripheral sites. We used the value of 1.389 for the refractive index11 in all the software calculations, and this could result in overestimation or underestimation of the thickness of each layer. Third, there might have been changes in corneal thickness among different age groups that we could not detect because of the small sample size and the limited age ranges of our subjects. Future studies on age-related anatomic changes are essential. Fourth, because we did not differentiate Descemet's membrane from the stroma, if variations in Descemet's membrane existed, they could have contributed to the variations we observed in the stroma. The contribution would have been too small to cause the approximately 50-μm variation we found between the center and the periphery of the stroma. In addition, variation in stromal thickness was apparent in the OCT images even while the Descemet's membrane appeared to be a thin layer.
In conclusion, the thickness of the corneal epithelium increased gradually from the center to the periphery. Mean Bowman's layer thickness at the center was 17.7 μm, and it followed a nonuniform pattern along the horizontal meridian in healthy subjects. SD-OCT facilitated measurement of topographic thickness of the different corneal layers in vivo.
Acknowledgments
The authors thank Britt Bromberg (Xenofile Editing) for providing editing services for this manuscript and the Florida Lions Eye Bank for providing eye bank eyes for this study.
Footnotes
Supported by National Institutes of Health/National Eye Institute Grant R03 EY016420, Bausch & Lomb (JW), Allergan (JW), National Institutes of Health Center Grant P30 EY014801, and Research to Prevent Blindness.
Disclosure: A. Tao, None; J. Wang, Bausch & Lomb (F), Allergan (F); Q. Chen, None; M. Shen, None; F. Lu, None; S.R. Dubovy, None; M.A. Shousha, None
References
- 1. Obata H, Tsuru T. Corneal wound healing from the perspective of keratoplasty specimens with special reference to the function of the Bowman layer and Descemet membrane. Cornea. 2007;26:S82–S89 [DOI] [PubMed] [Google Scholar]
- 2. Krashmer JH, Mannis MJ, Holland EJ. Cornea: Fundamentals, Diagnosis and Management. Philadelphia: Elsevier-Mosby; 2005:3–26 [Google Scholar]
- 3. Farias RJ, Sousa LB, Lima Filho AA, et al. Light and transmission electronic microscopy evaluation of lyophilized corneas. Cornea. 2008;27:791–794 [DOI] [PubMed] [Google Scholar]
- 4. Efron N, Hollingsworth JG. New perspectives on keratoconus as revealed by corneal confocal microscopy. Clin Exp Optom. 2008;91:34–55 [DOI] [PubMed] [Google Scholar]
- 5. Kobayashi A, Yokogawa H, Sugiyama K. In vivo laser confocal microscopy of Bowman's layer of the cornea. Ophthalmology. 2006;113:2203–2208 [DOI] [PubMed] [Google Scholar]
- 6. Wang J, Aquavella J, Palakuru J, Chung S. Repeated measurements of dynamic tear distribution on the ocular surface after instillation of artificial tears. Invest Ophthalmol Vis Sci. 2006;47:3325–3329 [DOI] [PMC free article] [PubMed] [Google Scholar]
- 7. Wang J, Fonn D, Simpson TL, et al. Topographical thickness of the epithelium and total cornea after overnight wear of reverse-geometry rigid contact lenses for myopia reduction. Invest Ophthalmol Vis Sci. 2003;44:4742–4746 [DOI] [PubMed] [Google Scholar]
- 8. Akiba M, Maeda N, Yumikake K, et al. Ultrahigh-resolution imaging of human donor cornea using full-field optical coherence tomography. J Biomed Opt. 2007;12:041202 [DOI] [PubMed] [Google Scholar]
- 9. Wang J, Jiao S, Ruggeri M, Shousha MA, Chen Q. In situ visualization of tears on contact lens using ultra high resolution optical coherence tomography. Eye Contact Lens. 2009;35:44–49 [DOI] [PMC free article] [PubMed] [Google Scholar]
- 10. Wang J, Fonn D, Simpson TL, Jones L. Relation between optical coherence tomography and optical pachymetry measurements of corneal swelling induced by hypoxia. Am J Ophthalmol. 2002;134:93–98 [DOI] [PubMed] [Google Scholar]
- 11. Lin RC, Shure MA, Rollins AM, Izatt JA, Huang D. Group index of the human cornea at 1.3-microm wavelength obtained in vitro by optical coherence domain reflectometry. Opt Lett. 2004;29:83–85 [DOI] [PubMed] [Google Scholar]
- 12. Shousha MA, Perez VL, Wang J, et al. Use of ultra-high-resolution optical coherence tomography to detect in vivo characteristics of Descemet's membrane in Fuchs' dystrophy. Ophthalmology. 2010;117:1220–1227 [DOI] [PMC free article] [PubMed] [Google Scholar]
- 13. Wang J, Fonn D, Simpson TL, Jones L. The measurement of corneal epithelial thickness in response to hypoxia using optical coherence tomography. Am J Ophthalmol. 2002;133:315–319 [DOI] [PubMed] [Google Scholar]
- 14. Perez JG, Meijome JM, Jalbert I, Sweeney DF, Erickson P. Corneal epithelial thinning profile induced by long-term wear of hydrogel lenses. Cornea. 2003;22:304–307 [DOI] [PubMed] [Google Scholar]
- 15. Wang J, Thomas J, Cox I, Rollins A. Noncontact measurements of central corneal epithelial and flap thickness after laser in situ keratomileusis. Invest Ophthalmol Vis Sci. 2004;45:1812–1816 [DOI] [PubMed] [Google Scholar]
- 16. Wang J, Fonn D, Simpson TL. Topographical thickness of the epithelium and total cornea after hydrogel and PMMA contact lens wear with eye closure. Invest Ophthalmol Vis Sci. 2003;44:1070–1074 [DOI] [PubMed] [Google Scholar]
- 17. Reinstein DZ, Archer TJ, Gobbe M, Silverman RH, Coleman DJ. Epithelial thickness in the normal cornea: three-dimensional display with Artemis very high-frequency digital ultrasound. J Refract Surg. 2008;24:571–581 [DOI] [PMC free article] [PubMed] [Google Scholar]
- 18. Kermani O, Fabian W, Lubatschowski H. Real-time optical coherence tomography-guided femtosecond laser sub-Bowman keratomileusis on human donor eyes. Am J Ophthalmol. 2008;146:42–45 [DOI] [PubMed] [Google Scholar]
- 19. Komai Y, Ushiki T. The three-dimensional organization of collagen fibrils in the human cornea and sclera. Invest Ophthalmol Vis Sci. 1991;32:2244–2258 [PubMed] [Google Scholar]
- 20. Dawson DG, Grossniklaus HE, McCarey BE, Edelhauser HF. Biomechanical and wound healing characteristics of corneas after excimer laser keratorefractive surgery: is there a difference between advanced surface ablation and sub-Bowman's keratomileusis? J Refract Surg. 2008;24:S90–S96 [DOI] [PubMed] [Google Scholar]
- 21. Li HF, Petroll WM, Moller-Pedersen T, et al. Epithelial and corneal thickness measurements by in vivo confocal microscopy through focusing (CMTF). Curr Eye Res. 1997;16:214–221 [DOI] [PubMed] [Google Scholar]
- 22. Hutchings N, Simpson TL, Hyun C, et al. Swelling of the human cornea revealed by high speed, ultrahigh resolution optical coherence tomography. Invest Ophthalmol Vis Sci. 2010;51:4579–4584 [DOI] [PubMed] [Google Scholar]
- 23. Apple DJ, Olson RJ, Jones GR, et al. Congenital corneal opacification secondary to Bowman's layer dysgenesis. Am J Ophthalmol. 1984;98:320–328 [DOI] [PubMed] [Google Scholar]
- 24. Stone DL, Kenyon KR, Green WR, Ryan SJ. Congenital central corneal leukoma (Peters' anomaly). Am J Ophthalmol. 1976;81:173–193 [DOI] [PubMed] [Google Scholar]
- 25. Wilson SE, Kim WJ. Keratocyte apoptosis: implications on corneal wound healing, tissue organization, and disease. Invest Ophthalmol Vis Sci. 1998;39:220–226 [PubMed] [Google Scholar]
- 26. Hollingsworth JG, Bonshek RE, Efron N. Correlation of the appearance of the keratoconic cornea in vivo by confocal microscopy and in vitro by light microscopy. Cornea. 2005;24:397–405 [DOI] [PubMed] [Google Scholar]
- 27. Ma JJ, Tseng SS, Yarascavitch BA. Anterior segment optical coherence tomography for transepithelial phototherapeutic keratectomy in central corneal stromal scarring. Cornea. 2009;28:927–929 [DOI] [PubMed] [Google Scholar]
- 28. Swarbrick HA, Wong G, O'Leary DJ. Corneal response to orthokeratology. Optom Vis Sci. 1998;75:791–799 [DOI] [PubMed] [Google Scholar]
- 29. Cense B, Chen TC, Nassif N, et al. Ultra-high speed and ultra-high resolution spectral-domain optical coherence tomography and optical Doppler tomography in ophthalmology. Bull Soc Belge Ophtalmol. 2006;123–132 [PubMed] [Google Scholar]
- 30. Brennen PM, Kagemann L, Friberg TR. Comparison of StratusOCT and Cirrus HD-OCT imaging in macular diseases. Ophthalmic Surg Lasers Imaging. 2009;40:25–31 [DOI] [PMC free article] [PubMed] [Google Scholar]
- 31. Cense B, Nassif N, Chen T, et al. Ultrahigh-resolution high-speed retinal imaging using spectral-domain optical coherence tomography. Opt Express. 2004;12:2435–2447 [DOI] [PubMed] [Google Scholar]
- 32. Zhao M, Kuo AN, Izatt JA. 3D refraction correction and extraction of clinical parameters from spectral domain optical coherence tomography of the cornea. Opt Express. 2010;18:8923–8936 [DOI] [PubMed] [Google Scholar]
- 33. Patel S, Marshall J, Fitzke FW., III Refractive index of the human corneal epithelium and stroma. J Refract Surg. 1995;11:100–105 [DOI] [PubMed] [Google Scholar]


