

Abstract
Previous research investigating children with Developmental Coordination Disorder (DCD) has consistently reported increased intra- and inter-individual variability during motor skill performance. Statistically characterizing this variability is not only critical for the analysis and interpretation of behavioral data, but may facilitate our understanding of the processes underlying DCD. Thus, the primary purpose of this research was to demonstrate the utility of a flexible statistical technique, a random coefficient model (RCM), that characterizes the increased intra- and inter-individual variability in children with and without DCD. We analyzed data from a sensorimotor adaptation task during which participants executed discrete aiming movements under conditions of rotated visual feedback. To highlight the advantages of this statistical approach, we contrasted the results from the RCM with those from a traditionally employed general linear model (GLM). The RCM revealed differences between the two groups of children that the GLM did not detect; and, characterized trajectories of change for each individual. The RCM provides researchers an opportunity to probe behavioral deficits at the individual level and may provide new insights into the behavioral heterogeneity in children with DCD.
Keywords: Heterogeneity, Spatial motor control, Dyspraxia, Sensorimotor adaptation, Visuomotor
1. Introduction
Developmental Coordination Disorder (DCD) is an idiopathic condition that is characterized by impaired performance in activities of daily living that require motor coordination (APA, 2000). Previous research investigating children with DCD has consistently reported two characteristics: 1) increased within-subject variability; and, 2) substantial heterogeneity (i.e., inter-individual variability) of behavioral deficits across children. These characteristics have been demonstrated across a range of tasks, including discrete reaching (Kagerer, Bo, Contreras-Vidal, & Clark, 2004), syncopated clapping and marching (Mackenzie et al., 2008), multi-digit torque control (Oliveira, Shim, Loss, Petersen, & Clark, 2006), visuo-motor integration and visual perception (Schoemaker et al., 2001), bimanual coordination (Volman & Geuze, 1998), and continuous and discontinuous drawing (Bo, Bastian, Kagerer, Contreras-Vidal, & Clark, 2008). While theoretically important, these performance characteristics can hinder the analysis and interpretation of behavioral data. Statistically characterizing this increased intra- and inter-individual variability is thus critical for understanding the individual behavioral deficits as well as the more global impairments underlying the population of children with DCD; this issue is the focus of the current paper.
General linear models (GLM) have traditionally been employed to compare children with DCD to typically-developing (TD) controls (e.g., Kagerer et al., 2004; Mon-Williams, Wann, & Pascal, 1999; Wilson, Maruff, & Lum, 2003). Although these models probe the behavioral differences between groups (i.e., TD vs. DCD), GLMs are limited if the individuals’ motor performances are of interest. To address this problem, researchers have employed a number of alternative statistical approaches (e.g., clustering). For example, Hoare (1994) attempted to identify sub-types of DCD based on the relationships among multiple dependent measures from each individual. This approach provided insights into the heterogeneity of DCD as it focused on each individual’s performance, but this approach is extremely sensitive to the measures included in the analysis and the interpretation of the sub-types is subjective. More recent studies have used ‘developmental landscapes’ to make comparisons between children with and without DCD (Bo et al., 2008; Kagerer, Contreras-Vidal, Bo, & Clark, 2006). These landscapes consist of a large cross-sectional age range of TD children that form an age-based regression. Children with DCD outside the upper prediction limit of the TD regression are considered to have impaired performance on that particular task. This approach also emphasizes individualized performance and it compares the children with DCD to a much larger group of TD children with a more expansive age range. However, the approach is limited as it does not examine population level effects; and, differences at the individual level may be difficult to detect if the between-subject variability of the TD children is large.
The limitations of these previous approaches have motivated us to examine a statistical technique for longitudinal data that may better characterize the increased intra- and inter-individual variability evident in DCD. This technique, the random coefficient model (RCM) (Cudeck, 1996; Cudeck & Harring, 2007; Davidian & Giltinan, 1995; Fitzmaurice, Laird, & Ware, 2004), allows for the description of both average change in the target populations as well as subject-specific change unique to each individual. To demonstrate the efficacy of this statistical approach, we contrasted the results obtained from the RCM with those from the more commonly employed GLM. We used repeated measures data from a small sample of children with DCD, which is not atypical for studies on special populations, and a larger sample of TD children. Participants completed a visuomotor adaptation experiment during which discrete aiming movements were made to peripherally-located visual stimuli under conditions of rotated visual feedback. The primary purpose of this research was to demonstrate the utility of an analytic technique that statistically characterizes behavioral variability in children with DCD. Our secondary aim was to interpret the results of the RCM in the contexts of sensorimotor adaptation and DCD in order to highlight the advantages of this approach that were not afforded by a traditional statistical model.
2. Methods
To better understand the implementation of the RCM, information about the experiment and data set are provided. The methodology is thus divided into two sections. The details on the visuomotor experiment, including the outcome variable, are described in the first section (2.1). The second section (2.2) describes the statistical analyses employed.
2.1. Visuomotor experiment
2.1.1. Participants
Seven children diagnosed with DCD and 14 typically-developing (TD) children who participated in a visuomotor adaptation study were included in this analysis. Inclusion criteria for children with DCD were: 1) Movement Assessment Battery for Children (MABC) score below the 5th percentile (Henderson & Sugden, 1992); 2) a pediatrician’s independent diagnosis of DCD, including a medical history and a screening for neurological disorders (Physical and Neurological Examination for Subtle Signs; PANESS) (Denckla, 1985); and, 3) typical cognitive development as determined by the Woodcock-Johnson Psycho-Educational Battery-Revised. The TD participants demonstrated MABC scores above the 20th percentile and were included as part of a developmental landscape in a previous publication (King, Kagerer, Contreras-Vidal, & Clark, 2009). All participants were right-handed, as defined based on everyday activities such as eating and handwriting and confirmed by the MABC handedness criteria (Henderson et al., 1992). Detailed participant information is included in Table 1. Prior to participation, each child’s parent or legal guardian provided informed consent. All procedures were approved by the Institutional Review Board at the University of Maryland, College Park. Children received a toy prize and a small monetary compensation for their participation.
Table 1.
| A. | |||
|---|---|---|---|
| Group | Gender | Mean Age (SD) | MABC %ile Range |
| TD | 10 M; 4 F | 10.04 (0.58) | 20 – 96 |
| DCD | 6 M; 1 F | 10.17 (0.76) | see Table 1B |
| B. | |||
|---|---|---|---|
| ID # | Gender | Age | MABC %ile |
| 28 | M | 9.5 | 1 |
| 33 | M | 11.35 | 3 |
| 36 | M | 9.21 | 5 |
| 40 | F | 9.62 | < 1 |
| 45 | M | 10.74 | < 1 |
| 68 | M | 10.43 | 2 |
| 69 | M | 10.33 | < 1 |
A. Participant information for the two groups of children. B. Participant information for each child diagnosed with DCD.
2.1.2. Procedures
Participants were asked to complete discrete aiming movements with a computer pen on a digitizing tablet positioned below a horizontally-oriented computer monitor. The monitor provided real-time visual feedback of the participants’ movements as well as the start and target circles. Vision of the hand was occluded. The tablet recorded Cartesian (x/y) coordinates of the computer pen (sampling frequency = 99 Hz). Participants executed aiming movements to one of three visual target positions located 9 cm from the centrally-located start circle (positioned 25°, 90°, or 155° with respect to the start position). During task performance, the visual feedback of the participants’ movement paths provided on the computer monitor was rotated 60° clockwise (CW); thus, exposing participants to a visuomotor distortion (126 trials, 42 per target). This sensorimotor distortion results in an initial decrease in performance. With practice, participants adapt to the imposed rotation, as indicated by a substantial reduction in movement errors (i.e., sensorimotor adaptation). This improvement in performance during exposure to a visuomotor rotation has been previously demonstrated in adults (Kagerer, Contreras-Vidal, & Stelmach, 1997; Krakauer, Pine, Ghilardi, & Ghez, 2000) and children with and without DCD (Contreras-Vidal, Bo, Boudreau, & Clark, 2005; Kagerer et al., 2006; King et al., 2009).
2.1.3. Dependent Variable
The time series of each trial was dual-pass filtered with an 8th order Butterworth filter (10-Hz cutoff). Onset and offset of each movement were determined based on an algorithm employed in previous research (Contreras-Vidal et al., 2005). Several potential dependent measures can be computed to assess sensorimotor adaptation (e.g., Contreras-Vidal et al., 2005). For the purposes of this research, we focused on a single dependent variable, root mean squared error (RMSE). RMSE is a spatial error between the actual movement and the straight-line vector between the start and target positions and was computed as:
| (1) |
where (xa,ya) and (xi,yi) are corresponding points of the actual and ideal trajectories, respectively (Contreras-Vidal et al., 2005). Importantly, RMSE is a continuous variable that theoretically can vary between 0 and infinity. It reflects errors in both motor planning and execution; higher values indicate decreased sensorimotor performance.
2.2. Statistical Analysis
We contrasted the results obtained from the RCM with those from the more commonly employed GLM in order to highlight the advantages of a more flexible analytic technique that can not only examine individual behavioral trajectories, but can also explicitly model within- and between-subject variability. It should be emphasized that this research did not aim to compare and contrast the GLM and RCM in terms of ‘fitting’ the data as these statistical approaches have distinct mean structures with a different number of parameter estimates.
2.2.1. General Linear Model (GLM)
In previous adaptation experiments, the exposure phase was decomposed into blocks of trials and summary statistics were computed for each block (Contreras-Vidal et al., 2005; Flanagan et al., 1999; Kagerer et al., 2006; King et al., 2009; Krakauer, Ghez, & Ghilardi, 2005). A multi-factorial, repeated-measures analysis of variance (ANOVA) was conducted to assess population level differences over the course of the exposure phase. We employed a similar analysis for our data set. Specifically, the exposure phase was decomposed into three blocks of trials: 1) early exposure (trials 1–18); middle exposure (trials 55–72); and, late exposure (trials 109–126). We conducted a 3 (block) × 2 (group: TD/DCD) ANOVA on RMSE. We chose to decompose the data into three blocks of trials to be consistent with previous research in our laboratory (King et al., 2009); however, it should be noted that other studies have computed means for different numbers of trial blocks (e.g., Contreras-Vidal et al., 2005; Kagerer et al., 2006).
2.2.2. Random Coefficient Model (RCM)
To help control for any target-related effects and to increase the stability of our dependent measures, mean RMSE values were computed by averaging across three consecutive trials. The 126-trial exposure phase was thus decomposed into 42 observations (i.e., blocks) for each participant. If any of the three consecutive trials were excluded from analysis (i.e., missing data), the entire block was excluded. The RCM is capable of handling missing data, a characteristic that will be further explored in the discussion (Section 4.1.3).
2.2.2.1. Mean Structure
Since the RCM examines the trajectories of change as a function of the repeated observations, it is suited to parameterize the improvements in performance during exposure to the visuomotor distortion. When determining an appropriate mean function, there are several important factors that should be considered (see Cudeck & Harring, 2010 for details). Importantly, the mean function should not only fit the data appropriately; but, the model parameters should be interpreted within the context of the behavioral paradigm. Previous research has demonstrated that visuomotor adaptation data are generally characterized by exponential decay functions (Flanagan et al., 1999; King et al., 2009; Krakauer et al., 2005; Krakauer et al., 2000). The current data were consistent with previous research as there was a rapid reduction in RMSE over the first several blocks of trials. Performance continued to improve over the remainder of the protocol; however, the rate of adaptation was less than the initial reduction in movement errors, suggesting a non-linear function. Preliminary data analysis revealed that RMSE was best characterized by a double-exponential. This mean structure was thus an appropriate fit of the data and its parameters could be interpreted in the context of previous research.
There are indeed several potential analytic techniques that probe trajectories of behavioral change; however, the RCM models trajectories of change at the population and individual levels of analysis and it explicitly models between- and within-subject variability. Accordingly, RCMs include both fixed effects, parameters applicable to the entire population (i.e., TD or DCD), as well as random effects, parameters that model individual differences in performance. For simplicity, the sections that follow highlight the critical components of the model developed for the current data. For a detailed tutorial on the steps for building similar statistical models to the ones employed in the current study, please see Verbeke & Molenberghs (2000).
The final double-exponential model for RMSE is shown in Eq. 2 below:
| (2) |
where: RMSE(i,j) = RMSE value for the ith subject on the jth trial block,
β1, β2, β3, β4 = estimated fixed effects for the typical subject
γ1, γ3, γ4 = adjustments to the fixed effects for children with DCD
gi = 0 if child was typically developing
gi = 1 if child was diagnosed with DCD
bi2, bi4 = estimated random effects
eij = residuals
The β2 and β4 parameters were the ‘typical values’ of the individual-specific rate constants representing the improvement in performance for the TD children over the course of the exposure phase. An examination of these parameters suggested that the β2 parameter represents a ‘fast adaptation’ component and β4 represents a ‘slow adaptation’ component as the β2 estimates are much larger (in absolute terms) than the β4 estimates (Tables 2 and 3). These fast and slow adaptation components have been discussed in previous adaptation research (Joiner & Smith, 2008; Smith, Ghazizadeh, & Shadmehr, 2006). The sum of β1 and β3 was interpreted as the y-intercept for the average TD participant since this is the magnitude of RMSE at the beginning of the experimental protocol (i.e., when j = 0). The terms bi2 and bi4 were the random effects (i.e., estimated individual adjustments) to the rate constants; the random effects bi1 and bi3 were excluded as preliminary data analysis indicated minimal between-subject variability in these parameter estimates. The b terms are assumed to be normally distributed with a mean of 0 and a variance-covariance structure specified by the matrix Φ (see section 2.2.2.2 for details). The γ parameters denote average adjustments to the corresponding fixed effects for participants diagnosed with DCD. For example, the sum of γ1 and γ3 represents the average adjustment to the y-intercept for a child with DCD whereas the γ4 parameter represents the average adjustment to the ‘slow adaptation’ rate constant for a child with DCD. Alternatively stated, the sum of the corresponding β and γ parameters was equal to the typical estimates for a child with DCD. Since the γ parameters were adjustments to the typical values for the TD children, statistical tests of these parameters assessed the differences between the two groups of children. It should be noted that the γ2 parameter was excluded from the final model as preliminary data analysis indicated that the two groups of children did not differ in the fast adaptation parameter (Likelihood Ratio Test (LRT): TLRT(df = 1) = 1.8; p > 0.05).
Table 2.
Parameters for mean exponential trajectory for Root Mean Squared Error (RMSE)
| β1 | β2 | β3 | β4 | γ1 | γ3 | γ4 |
|---|---|---|---|---|---|---|
| 2.14* (0.13) |
−0.36* (0.067) |
1.13* (0.085) |
−0.017* (0.003) |
0.96* (0.21) |
−0.21 (0.11) |
0.017* (0.005) |
Values in parentheses are standard errors.
significant at the p = 0.05 level.
Table 3.
Random effects for children with DCD
| ID # | bi2 | bi4 |
|---|---|---|
| 28 | −0.583* (0.166) |
−0.003 (0.004) |
| 33 | 0.079 (0.072) |
−0.012* (0.004) |
| 36 | −0.087 (0.095) |
−0.001 (0.004) |
| 40 | −0.380* (0.133) |
−0.016* (0.005) |
| 45 | −0.001 (0.085) |
−0.007 (0.004) |
| 68 | 0.145* (0.068) |
0.009* (0.004) |
| 69 | 0.288* (0.065) |
0.021* (0.004) |
Values in parentheses are standard errors.
significantly different from the mean of the children with DCD at the p = 0.05 level.
2.2.2.2. Variance-Covariance Structure
An advantage of RCMs over more conventional analytic methods is that both within- and between-subject variability are explicitly modeled. We give a brief description of each below in relation to the model described in Eq. 2.
Within-Subject Covariance Structure
Within-subject variability is captured by the residual terms eij which represent the variability of subject i’s scores around his/her predicted score at trial block j. In many contexts, it is reasonable to expect a comparable pattern of within-subject variation across individuals. Furthermore, specification of the random within-subject variation allows for the possibility of heterogeneous within-subject variances as well as within-subject correlation. These characteristics are critical for repeated measures data because the variances frequently change as a function of the mean and/or trial number and the correlation between two observations tends to decrease as the distance between observations increases. For ei = (ei1, …, eini)′, the common within-subject variance-covariance structure can be written as
| (3) |
where λ is a vector of parameters which describe the structure. The errors, ei, are assumed to be normally distributed with a mean of 0 and variance-covariance structure specified by the matrix, Λi (λ). While numerous alternative configurations are possible to account for the complexities in the data set, a simple homogenous, independence structure such as Λi (λ)=σ2Ini, where λ=σ2, is often specified (and is used in the current example). In this structure, the variances associated with the repeated measures are constant and the covariance between any two observations is zero. The i subscript is used simply to show the dependence of Λi on its dimensions. In terms of the current example, Λi is a diagonal matrix with row and column dimensions equal to the number of blocks of trials for the ith subject. The maximum size of Λi is 42 by 42, but the dimensions may be smaller if the ith subject is missing data. It is not unreasonable to expect that the preponderance of variability in the repeated measures can be adequately represented through specification of random effects (i.e., the b terms); and once these differences are taken into account in the model, the within-subject variability can often be accounted for by a simple, parsimonious structure. It should be emphasized that the simple, independent structure of Λi used in the current example is not the only option. Please refer to Fitzmaurice et al. (2004) for a detailed discussion on alternative variance-covariance structures.
Between-Subject Covariance Structure
Since the random effects represent individual deviations from the group trajectory, they provide a measure of between-subject variability. [Fixed parameters (i.e., the β and γ terms) do not vary; therefore, they do not contribute to the between-subject variability]. The variances and covariance of these random effects are represented by the matrix Φ, the dimensions of which are equal to the number of random effects. The between-subject covariance matrix, Φ, has diagonal elements representing variance components capturing the degree of variability in regression coefficients between subjects, and off-diagonal elements summarizing the extent the random effects are related. Since Eq. 2 contained two random effects (i.e., bi2 and bi4), Φ is a 2 × 2 matrix.
| (4) |
where ϕ22 and ϕ44 represent the variance of bi2 and bi4, respectively, and ϕ24 is the covariance between the two random effects. As emphasized above, bi1 and bi3 were removed from the final model based on preliminary data analyses.
Normality is the most common assumption for the distribution of random effects, that is:
| (5) |
although the structure can be modified to allow for group differences in Φ. In some instances, the normality distributional assumption may not accurately represent the distribution of the random effects. In these cases, other parametric or non-parametric alternatives can be implemented.
3. Results
Averaged movement trajectories from early (trials 1–18) and late (trials 109–126) exposure are shown for the children with DCD and the TD children in Fig. 1. During early exposure, movement paths were characterized by spiral patterns as the children adjusted their movements in response to the visual feedback rotation. Movements during late exposure were once again straight, suggesting that the participants adapted to the distorted visual feedback. Interestingly, the children with DCD appeared to perform the task similar to their TD peers, a comparison that was further explored by the subsequent analyses. The remainder of this section presents the results from both the GLM and the RCM. The critical differences between these two statistical approaches are the focus of the discussion section.
Fig. 1.
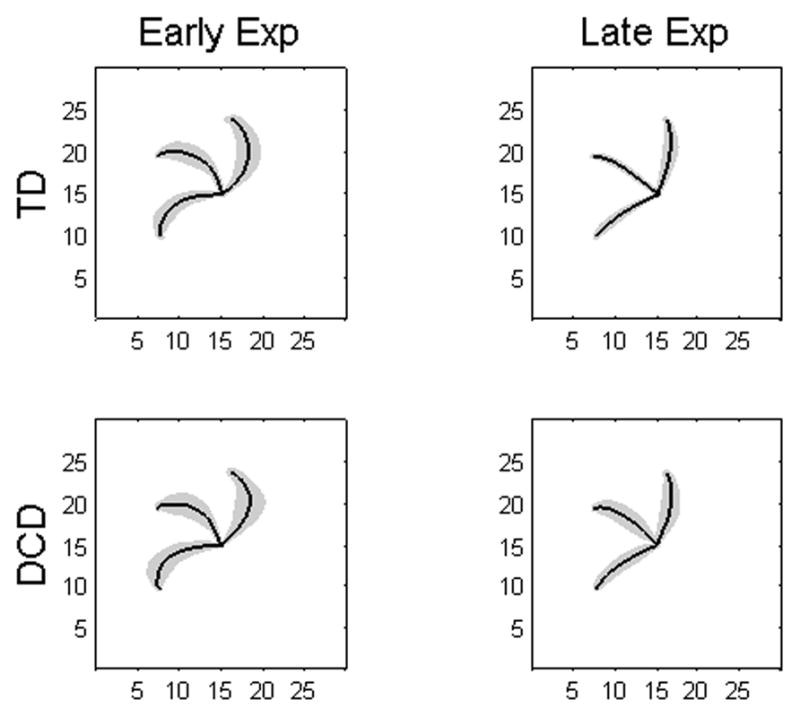
Movement Trajectories. Solid black lines depict averaged group trajectories and the gray shaded regions represent one standard deviation. Units are in cm.
3.1. General Linear Model
Results from the 3 (block: early/middle/late) × 2 (group: TD/DCD) ANOVA on RMSE (Fig. 2) revealed a significant effect of trial block (F(2,38) = 145.90; p < 0.001); main effect of group and the interaction were not significant (p > 0.05). These results from the GLM indicate that the two groups of children adapted similarly to the visuomotor rotation.
Fig. 2.

Root mean squared errors (RMSE) for the three blocks of trials and two experimental groups. Error bars depict 1 SD. Individual data from the children with DCD are depicted as open circles. Numbers to the right of these circles are the participant ID numbers (refer to Table 1B).
To examine the between-subject heterogeneity in the children with DCD, the bar plot in Fig. 2 depicts individual data relative to the group means. This approach provided information about each individual’s performance only if the individual was multiple standard deviations from the population means. For example, an examination of Figure 2 suggested that DCD IDs #68 and #69 failed to adapt to the sensorimotor distortion as well as their TD peers. However, definitive conclusions can not be made regarding these participants as the GLM does not statistically parameterize individual data. With the approach in Fig. 2, individual differences may be observed, but not explicitly parameterized and tested.
3.2. Random Coefficient Model
RMSE during the exposure phase is shown for the two groups of children in Fig. 3. Population parameters, the fixed effects in the double exponential model (Eq. 4), are included in Table 2. The sum of β1 and β3 (3.27, SE = 0.15) was interpreted as the average y-intercept for the TD children. Similarly, the sum of γ1 and γ3 (0.74, SE = 0.22) was the average adjustment to the y-intercept for the children with DCD and was statistically significant (t = 3.38, p = 0.003), indicating that these children had larger RMSE values at the beginning of the exposure phase compared to the values typical of a child in the TD group. β2, representing the fast adaptation component for both groups, was significant (t = 5.39, p < 0.001). Since γ2 was removed from the model, the two groups of children did not differ in the fast adaptation component. The slow adaptation parameter for the TD children (i.e., β4) was also significant (t = 4.92, p < 0.001). Interestingly, the adjustment to this parameter for the children with DCD, γ4, was both positive and significant (t = 3.26, p = 0.004), indicating that the slow adaptation component for the children with DCD was substantially reduced (i.e., worse performance) compared to the values typical of a child in the TD group.
Fig. 3.
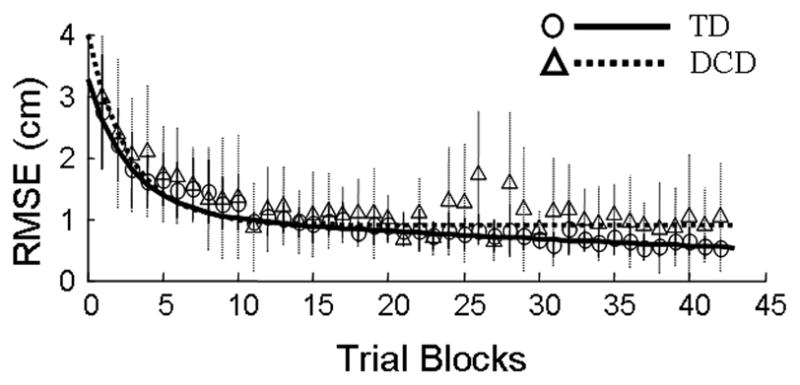
Exposure: Mean Trajectories. Mean root mean squared errors (RMSE) are shown for the children with DCD (triangles, dotted lines) and TD children (circles, solid lines) as a function of exposure blocks. Vertical lines depict +/− one SD. Parameters for the fitted exponential trajectories are shown in Table 2.
Individual trajectories for RMSE and the corresponding parameters (Eq. 4) are shown in Fig. 4 and Table 3, respectively. Consistent with the extant literature, children with DCD exhibited substantial within-group variability. Two participants demonstrated increased rates of fast adaptation (i.e., bi2), as compared to the average child with DCD (ID #28: t = 3.50, p = 0.002; ID #40: t = 2.85, p = 0.01), whereas two participants demonstrated decreased fast adaptation rates (ID #68: t = 2.15, p = 0.045; ID #69: t = 4.40, p < 0.001). Since there was no γ2 parameter in the double exponential model, these four participants were also significantly different from the values typical of a child in the TD group.
Fig. 4.
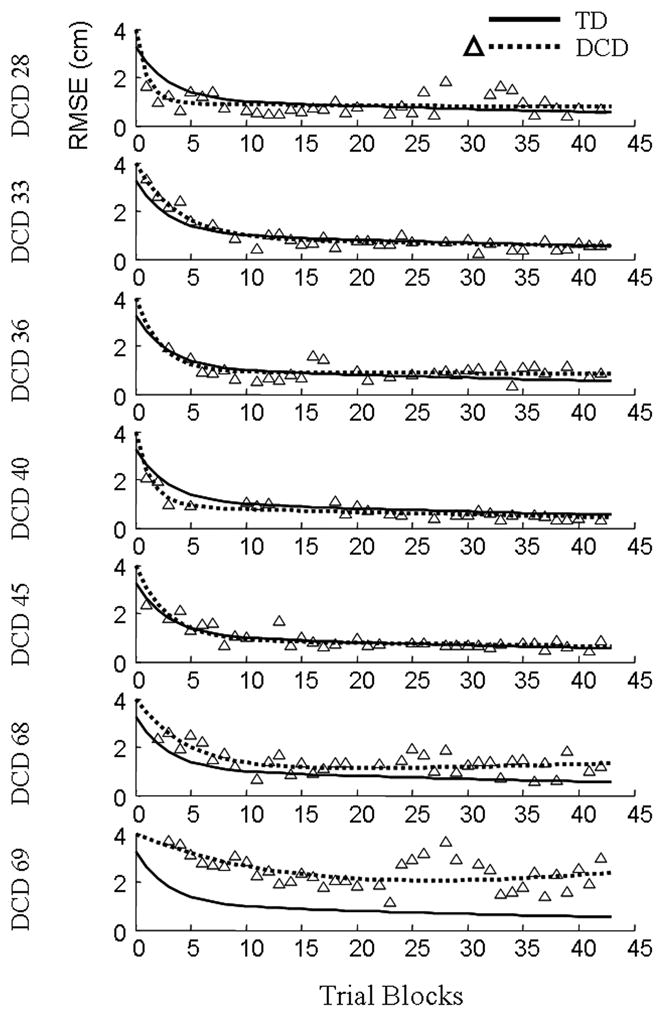
Exposure: Individual Trajectories. Root mean squared errors (RMSE) are shown as a function of exposure blocks for the seven children with DCD. Triangles represent individual data points. Dotted lines depict estimated trajectories for each child with DCD and solid lines represent the estimated mean trajectories of the TD children.
Similar to the rates of the fast adaptation component, two children with DCD demonstrated increased rates of slow adaptation (i.e., bi4) relative to the typical child with DCD (ID #33: t = 2.74, p = 0.013; ID #40; t = 3.33, p = 0.004). Conversely, DCD participants #68 and #69 demonstrated decreased rates of slow adaptation (ID #68: t = 2.39, p = 0.027; ID #69: t = 5.63, p < 0.001), a result that mirrored their fast adaptation parameters. Although only two participants with DCD demonstrated decreased rates of slow adaptation as compared to the typical DCD child, all seven of the participants were worse than the average TD child. The sum of γ4 (adjustment to β4 for the children with DCD) and each individual’s bi4 random effect yielded all positive numbers; thus, each child with DCD had a decreased slow adaptation rate relative to the average TD child.
Collectively, the results from the RCM indicated: 1) children with DCD demonstrated a decreased slow adaptation rate; and, 2) children with DCD exhibited substantial between-subject variability, as some participants adapted to the visuo-motor distortion equal to or better than the other children with DCD and their TD peers (i.e., ID #s 28, 33, 40), whereas other participants were significantly worse (ID #s 68, 69).
4. Discussion
This study sought to statistically characterize the behavioral performance of children with DCD using an approach, RCM (Cudeck, 1996; Cudeck et al., 2007; Davidian et al., 1995; Fitzmaurice et al., 2004), that addressed the between-subject heterogeneity and within-subject variability typical of this population. Data from a visuomotor adaptation experiment were used to highlight the differences between the RCM and the more commonly employed GLM. The RCM revealed population-level differences that the GLM did not detect; and, it characterized trajectories of change for each individual. To fully demonstrate the utility of this approach, we have organized the remainder of this discussion into two sections. The first section (4.1), consistent with the primary purpose of this research, focuses on advantages of the RCM for the analysis of children with DCD. It should be emphasized that this section is not necessarily limited to advantages of the RCM; rather, it contains advantages of a broader class of flexible statistical techniques that parameterize the population as well as each individual’s performance. The second section (4.2) illustrates novel findings and emphasizes how the current results can be interpreted within the contexts of sensorimotor adaptation and DCD.
4.1. The Random Coefficient Model (RCM)
4.1.1. Subject-Specific Trajectories
One of the most attractive features of statistical approaches such as the RCM is the ability to characterize data at the individual level. The RCM employed for the current data set demonstrated that DCD participants #68 and #69 did not adapt at the same rates as their peers with DCD or the TD children. However, based on the results of the GLM, these two children were combined with the other participants with DCD and their specific behavioral impairments were ‘masked’ by the group average. The RCM provided us the opportunity to make inferences at the individual level (see Section 4.2. for a discussion of these inferences). This feature is especially important when investigating special populations as the behavioral impairments are quite heterogeneous. A second advantage of employing statistical approaches that parameterize individual data arises when a mean structure may be appropriate to capture the behavior of interest at the population level, but this structure is not an appropriate characterization of any one individual (Cudeck et al., 2007). In this context, an interpretation of the model parameters will fail to produce any meaningful conclusions as these parameters are not applicable to any one individual.
4.1.2. Trajectories of Change
The repeated measures ANOVA employed in the current study aggregated over 100 trials of data into three blocks (early, middle, and late exposure) and assessed differences between the means of these trial blocks. This approach does not adequately capture the behavioral trajectory of the participants. In contrast, the RCM was parameterized such that adaptation rates were obtained, effectively assessing change as a function of the repeated observations. This feature makes statistical models such as the RCM, in contrast to repeated measures ANOVAs, better suited for analyzing trajectories of behavioral change. We chose a double exponential for the current data set based on our preliminary data analyses and to be consistent with previous literature (Flanagan et al., 1999; King et al., 2009; Krakauer et al., 2005; Krakauer et al., 2000). However, the RCM can be parameterized with a plethora of potential linear and non-linear mean functions. A detailed discussion on the criteria for selecting appropriate mean functions is outside the scope of this article but is included in Cudeck and Harring (2010).
4.1.3. Increased Flexibility
A third advantage of statistical approaches such as the RCM is the increased flexibility in model parameterization. For example, a repeated-measures ANOVA assumes that both the variance across observations and the covariance between any two observations are constant (i.e., a compound symmetric variance-covariance structure). This assumption is often violated with longitudinal data because the variance frequently changes as a function of the mean and/or trial number. Furthermore, in a correlated data set, the covariance between two observations tends to decrease as the distance between observations increases. Violations of the compound symmetric variance-covariance structure can impact the validity of the statistical tests (McCulloch, 2005). However, with the RCM, the covariance structure can be parameterized to account for these inherent characteristics of longitudinal data. Moreover, between- and within-subject variability are both explicitly modeled in the RCM by the matrices Φ and Λi, respectively. This allows researchers to conceptualize the two different types of variability separately and facilitates the construction of a more appropriate statistical model.
Another feature of RCM is the ability to handle missing data, which can be problematic for traditional statistical analyses. For example, if a participant has missing data and a repeated measures ANOVA is conducted, all of the data from this participant are ignored in the analysis. This is problematic for two reasons. One, fewer participants result in a decrease in statistical power. Two, the validity of the inferences can be jeopardized if the participants with missing data ‘share’ a common attribute that underlies the missing data. In other words, the sample is no longer representative of the population of interest. It is possible to circumvent these issues by averaging across only the available data (i.e., ignore the missing values). Although this will allow the participants with missing data to remain in the analyses, these values may be biased depending on the number of observations included in the average. In contrast to traditional GLMs, the RCM employed in this research is capable of handling missing data that are assumed to be missing at random (MAR). For a more detailed discussion of missing data, please refer to Fitzmaurice and colleagues (2004).
4.1.4. Limitations and Considerations
The preceding sections discussed advantages of the RCM; however, we should emphasize some of the limitations and other considerations associated with this statistical approach. First, the RCM is appropriate for data sets containing multiple observations from each individual (e.g., repeated measures data). These repeated measures can come from a single experimental session, as in the current study, or from a longitudinal design where multiple observations are taken at different time points. Moreover, the multiple observations do not have to be taken at identical time points for each individual (i.e., unbalanced design). Second, a detailed analysis and interpretation of individual data may be unwieldy for large sample sizes. In the current example, our individual analysis was straightforward as we predominantly focused on seven children with DCD. For substantially larger sample sizes, it may not be practical to examine the behavioral trajectory of each and every participant. However, previous research has typically examined a random sample from the full data set to assess individual trajectories (e.g., Cudeck et al., 2007). Moreover, independent of sample size, the values of the random effects may be used to cluster participants into smaller sub-groups and/or to identify specific participants that deviated substantially from the population. Thus, the RCM can still provide valuable information about individuals’ performances regardless of sample size.
4.2. Insights into Developmental Coordination Disorder
This research employed a novel statistical approach to parameterize the sensorimotor performance of children with DCD. However, such an approach is only beneficial if the results can be interpreted within the context of the behavioral paradigm and the population of interest. Utilizing statistical approaches such as the RCM provides a unique perspective for researchers investigating children with DCD and may lead to an increased understanding of the disorder. The remainder of this discussion will focus on how the results of the RCM can provide additional insights into DCD that are not afforded by traditional statistical approaches such as the GLM.
4.2.1. Subject-Specific Trajectories
Subject-specific models, such as the RCM, characterize each individual’s trajectory, allowing specific children who struggled to be identified based on their performance on the task. For example, children with DCD #28, #33, and #40 performed better than their TD peers, suggesting that these children have no sensorimotor adaptation impairments. Conversely, a subset of participants with DCD (IDs #68 and #69) failed to adapt to the novel sensorimotor environment compared to the other children with DCD and the TD children. These two participants had difficulty updating a spatial-to-motor transformation that is appropriate for the manipulated sensorimotor environment (Kagerer et al., 1997; Krakauer et al., 2000). Previous research has suggested that sensorimotor adaptation is dependent on the cerebellum, especially when movement errors are relatively small, as in the late exposure phase of this study (Baizer, Kralj-Hans, & Glickstein, 1999; Martin, Keating, Goodkin, Bastian, & Thach, 1996; Robertson & Miall, 1999). Research on patients with Parkinson’s disease (PD) indicated that the basal ganglia are critical for sensorimotor adaptation, particularly when the magnitude of the movement errors is relatively large, as in the early exposure phase of the present study (Contreras-Vidal & Buch, 2003; Teulings, Contreras-Vidal, Stelmach, & Adler, 2002). It is possible that these two children with DCD have impaired functioning of the basal ganglia and/or cerebellum, although additional research is necessary to investigate this potential explanation. This subject-specific statistical approach can provide researchers an opportunity to probe individual behavioral deficits and may lead to the development of individualized interventions.
Identifying children with similar behavioral impairments also facilitates the clustering of children with DCD, potentially elucidating subtypes of the disorder. The existence of several subtypes of DCD has garnered substantial attention in the extant literature and may help explain the increased between-subject variability in this population (Hoare, 1994; Lundy-Ekman, Ivry, Keele, & Woollacott, 1991; Visser, 2003; Volman et al., 1998; Whitall et al., 2008).
4.2.2. Sensorimotor Adaptation
The results of the RCM provided rates of sensorimotor adaptation for both the children with DCD and the TD children. Children with DCD demonstrated decreased adaptation rates for the slow adaptation component (i.e., the γ4 parameter). Recent research suggests that at least two distinct processes underlie sensorimotor adaptation: a ‘fast’ adaptation component critical for responding to movement errors and a ‘slow’ adaptation component important for long-term retention (Joiner et al., 2008; Smith et al., 2006). As children with DCD demonstrated decreased rates in the slow adaptation component, these data suggest that long-term sensorimotor retention is impaired in these children. Moreover, the fast and slow adaptation components have been attributed to distinct parts of the cerebellum (Smith et al., 2006), a neural structure that has been suggested as a potential neural underpinning of DCD (Bo et al., 2008; Cantin, Polatajko, Thach, & Jaglal, 2007; Kagerer et al., 2006; Lundy-Ekman et al., 1991; O’Hare & Khalid, 2002).
4.2.3. Insights from Behavioral Heterogeneity
The utilization of statistical models, such as the RCM, that address the behavioral heterogeneity in children with DCD is critical as this increased between-subject variability may provide critical information about the etiology of DCD and its underlying behavioral impairments. One potential explanation of this heterogeneity is that there are multiple mechanisms underlying the population of DCD and the manifestations of the disorder are dependent on these specific mechanism(s). Alternatively, behavioral deficits may be the result of a single neurological impairment and the heterogeneity of motor performance can be attributed to the varying degrees of severity this impairment has on the motor system. It has previously been proposed that such a neurological impairment underlies not only DCD, but other developmental disorders as well (Kaplan, Crawford, Cantell, Kooistra, & Dewey, 2006; Kaplan, Wilson, Dewey, & Crawford, 1998). Support for this explanation is based on not only the heterogeneous behavioral deficits in DCD, but the increased co-occurrence of developmental disorders such as DCD, attention-deficit hyperactivity disorder (ADHD), and reading disability (RD) (Kaplan et al., 2006; Kaplan et al., 1998; Martin, Piek, & Hay, 2006). Whereas the increased intra- and inter-individual variability has previously been considered a limiting factor in the analysis and interpretation of behavioral data from children with DCD, these behavioral characteristics may provide insights when appropriate statistical techniques are employed.
5. Conclusion
The current study demonstrated the utility of a flexible statistical technique, the RCM, for analyzing the behavioral performance of children with DCD. Specifically, the RCM detected critical population-level differences between TD children and children with DCD and addressed the substantial heterogeneity evident in this population by analyzing each individual’s behavioral trajectory. This analytic technique can be applied to a plethora of experiments in which the data set contains multiple observations from each individual. Importantly, these repeated measures do not have to be from a single experimental session, as was the case in the current study. The multiple observations can span weeks, months, or years, making the RCM an ideal technique for investigating developmental research questions. Similarly, the RCM is not limited to research on children with DCD. It can be employed to investigate any population provided that characterization of both average and subject-specific change is of interest. We propose that future research investigating populations that demonstrate heterogeneous behavioral performance, as in the case of children with DCD, should incorporate statistical techniques, such as the RCM, that analyze subject-specific and population effects.
Acknowledgments
This research was funded by NIH R01HD42527 (JEC). We would like to thank the children and their parents for participating in our study and Melissa M. Pangelinan and two anonymous reviewers for their insightful comments during the preparation of this manuscript.
Footnotes
Publisher's Disclaimer: This is a PDF file of an unedited manuscript that has been accepted for publication. As a service to our customers we are providing this early version of the manuscript. The manuscript will undergo copyediting, typesetting, and review of the resulting proof before it is published in its final citable form. Please note that during the production process errors may be discovered which could affect the content, and all legal disclaimers that apply to the journal pertain.
Reference List
- APA. Diagnostic and Statistical Manual of Mental Disorders. 4. Washington, DC: American Psychiatric Association; 2000. text revision. [Google Scholar]
- Baizer JS, Kralj-Hans I, Glickstein M. Cerebellar lesions and prism adaptation in macaque monkeys. Journal of Neurophysiology. 1999;81:1960–1965. doi: 10.1152/jn.1999.81.4.1960. [DOI] [PubMed] [Google Scholar]
- Bo J, Bastian AJ, Kagerer FA, Contreras-Vidal JL, Clark JE. Temporal variability in continuous versus discontinuous drawing for children with developmental coordination disorder. Neuroscience Letters. 2008;431:215–220. doi: 10.1016/j.neulet.2007.11.040. [DOI] [PMC free article] [PubMed] [Google Scholar]
- Cantin N, Polatajko HJ, Thach WT, Jaglal S. Developmental coordination disorder: Exploration of a cerebellar hypothesis. Human Movement Science. 2007;26:491–509. doi: 10.1016/j.humov.2007.03.004. [DOI] [PubMed] [Google Scholar]
- Contreras-Vidal JL, Bo J, Boudreau JP, Clark JE. Development of visuomotor representations for hand movement in young children. Experimental Brain Research. 2005;162:155–164. doi: 10.1007/s00221-004-2123-7. [DOI] [PubMed] [Google Scholar]
- Contreras-Vidal JL, Buch ER. Effects of Parkinson’s disease on visuomotor adaptation. Experimental Brain Research. 2003;150:25–32. doi: 10.1007/s00221-003-1403-y. [DOI] [PubMed] [Google Scholar]
- Cudeck R. Mixed-effects models in the study of individual differences with repeated measures data. Multivariate Behavioral Research. 1996;31:371–403. doi: 10.1207/s15327906mbr3103_6. [DOI] [PubMed] [Google Scholar]
- Cudeck R, Harring JR. Developing a random coefficient model for nonlinear repeated measures data. In: Chow S-M, Ferrer E, Hsieh F, editors. Statistical Methods for Modeling Human Dynamics: An Interdisciplinary Dialogue. New York: Routledge; 2010. [Google Scholar]
- Cudeck R, Harring JR. Analysis of nonlinear patterns of change with random coefficient models. Annual Review of Psychology. 2007;58:615–637. doi: 10.1146/annurev.psych.58.110405.085520. [DOI] [PubMed] [Google Scholar]
- Davidian M, Giltinan DM. Nonlinear Models for Repeated Measures Data. London: Chapman & Hall; 1995. [Google Scholar]
- Denckla MB. Revised neurological examination for subtle signs. Psychopharmacology Bulletin. 1985;21:773–800. [PubMed] [Google Scholar]
- Fitzmaurice GM, Laird NM, Ware JH. Applied Longitudinal Analysis. Hoboken, New Jersey: Wiley; 2004. [Google Scholar]
- Flanagan JR, Nakano E, Imamizu H, Osu R, Yoshioka T, Kawato M. Composition and decomposition of internal models in motor learning under altered kinematic and dynamic environments. Journal of Neuroscience. 1999;19:RC34. doi: 10.1523/JNEUROSCI.19-20-j0005.1999. [DOI] [PMC free article] [PubMed] [Google Scholar]
- Henderson SE, Sugden DA. Movement Assessment Battery for Children. London, UK: The Psychological Corporation; 1992. [Google Scholar]
- Hoare D. Subtypes of developmental coordination disorder. Adapted Physical Activity Quarterly. 1994;11:158–169. doi: 10.1123/apaq.19.1.11. [DOI] [PubMed] [Google Scholar]
- Joiner WM, Smith MA. Long-term retention explained by a model of short-term learning in the adaptive control of reaching. Journal of Neurophysiology. 2008;100:2948–2955. doi: 10.1152/jn.90706.2008. [DOI] [PMC free article] [PubMed] [Google Scholar]
- Kagerer FA, Bo J, Contreras-Vidal JL, Clark JE. Visuomotor adaptation in children with developmental coordination disorder. Motor Control. 2004;8:450–460. doi: 10.1123/mcj.8.4.450. [DOI] [PubMed] [Google Scholar]
- Kagerer FA, Contreras-Vidal JL, Bo J, Clark JE. Abrupt, but not gradual visuomotor distortion facilitates adaptation in children with developmental coordination disorder. Human Movement Science. 2006;25:622–633. doi: 10.1016/j.humov.2006.06.003. [DOI] [PubMed] [Google Scholar]
- Kagerer FA, Contreras-Vidal JL, Stelmach GE. Adaptation to gradual as compared with sudden visuo-motor distortions. Experimental Brain Research. 1997;115:557–561. doi: 10.1007/pl00005727. [DOI] [PubMed] [Google Scholar]
- Kaplan B, Crawford S, Cantell M, Kooistra L, Dewey D. Comorbidity, co-occurrence, continuum: what’s in a name? Child: Care, Health & Development. 2006;32:723–731. doi: 10.1111/j.1365-2214.2006.00689.x. [DOI] [PubMed] [Google Scholar]
- Kaplan BJ, Wilson N, Dewey D, Crawford SG. DCD may not be a discrete disorder. Human Movement Science. 1998;17:471–490. [Google Scholar]
- King BR, Kagerer FA, Contreras-Vidal JL, Clark JE. Evidence for multisensory spatial-to-motor transformations in aiming movements of children. Journal of Neurophysiology. 2009;101:315–322. doi: 10.1152/jn.90781.2008. [DOI] [PMC free article] [PubMed] [Google Scholar]
- Krakauer JW, Ghez C, Ghilardi MF. Adaptation to visuomotor transformations: consolidation, interference, and forgetting. Journal of Neuroscience. 2005;25:473–478. doi: 10.1523/JNEUROSCI.4218-04.2005. [DOI] [PMC free article] [PubMed] [Google Scholar]
- Krakauer JW, Pine ZM, Ghilardi MF, Ghez C. Learning of visuomotor transformations for vectorial planning of reaching trajectories. Journal of Neuroscience. 2000;20:8916–8924. doi: 10.1523/JNEUROSCI.20-23-08916.2000. [DOI] [PMC free article] [PubMed] [Google Scholar]
- Lundy-Ekman L, Ivry R, Keele S, Woollacott M. Timing and force control deficits in clumsy children. Journal of Cognitive Neuroscience. 1991;3:367–376. doi: 10.1162/jocn.1991.3.4.367. [DOI] [PubMed] [Google Scholar]
- Mackenzie SJ, Getchell N, Deutsch K, Wilms-Floet A, Clark JE, Whitall J. Multi-limb coordination and rhythmic variability under varying sensory availability conditions in children with DCD. Human Movement Science. 2008;27:256–269. doi: 10.1016/j.humov.2008.02.010. [DOI] [PMC free article] [PubMed] [Google Scholar]
- Martin NC, Piek JP, Hay D. DCD and ADHD: A genetic study of their shared aetiology. Human Movement Science. 2006;25:110–124. doi: 10.1016/j.humov.2005.10.006. [DOI] [PubMed] [Google Scholar]
- Martin TA, Keating JG, Goodkin HP, Bastian AJ, Thach WT. Throwing while looking through prisms: I. Focal olivocerebellar lesions impair adaptation. Brain : A Journal of Neurology. 1996;119:1183–1198. doi: 10.1093/brain/119.4.1183. [DOI] [PubMed] [Google Scholar]
- McCulloch CE. Repeated Measures ANOVA, RIP? Chance. 2005;18:29–33. [Google Scholar]
- Mon-Williams MA, Wann JP, Pascal E. Visual-proprioceptive mapping in children with developmental coordination disorder. Developmental Medicine & Child Neurology. 1999;41:247–254. doi: 10.1017/s0012162299000523. [DOI] [PubMed] [Google Scholar]
- O’Hare A, Khalid S. The association of abnormal cerebellar function in children with developmental coordination disorder and reading difficulties. Dyslexia. 2002;8:234–248. doi: 10.1002/dys.230. [DOI] [PubMed] [Google Scholar]
- Oliveira MA, Shim JK, Loss JF, Petersen RDS, Clark JE. Effect of kinetic redundancy on hand digit control in children with DCD. Neuroscience Letters. 2006;410:42–46. doi: 10.1016/j.neulet.2006.09.065. [DOI] [PMC free article] [PubMed] [Google Scholar]
- Robertson EM, Miall RC. Visuomotor adaptation during inactivation of the dentate nucleus. Neuroreport. 1999;10:1029–1034. doi: 10.1097/00001756-199904060-00025. [DOI] [PubMed] [Google Scholar]
- Schoemaker MM, van der Wees M, Flapper B, Verheij-Jansen N, Scholten-Jaegers S, Geuze RH. Perceptual skills of children with developmental coordination disorder. Human Movement Science. 2001;20:111–133. doi: 10.1016/s0167-9457(01)00031-8. [DOI] [PubMed] [Google Scholar]
- Smith MA, Ghazizadeh A, Shadmehr R. Interacting adaptive processes with different timescales underlie short-term motor learning. PLoS Biology. 2006;4:1035–1043. doi: 10.1371/journal.pbio.0040179. [DOI] [PMC free article] [PubMed] [Google Scholar]
- Teulings HL, Contreras-Vidal JL, Stelmach GE, Adler CH. Handwriting size adaptation under distorted feedback in Parkinson’s disease, elderly, and young controls. Journal of Neurology, Neurosurgery & Psychiatry. 2002;72:315–324. doi: 10.1136/jnnp.72.3.315. [DOI] [PMC free article] [PubMed] [Google Scholar]
- Verbeke G, Molenberghs G. Linear Mixed Models for Longitudinal Data. New York: Springer; 2000. General Guidelines for Model Building; pp. 121–134. [Google Scholar]
- Visser J. Developmental coordination disorder: a review of research on subtypes and comorbidities. Human Movement Science. 2003;22:479–493. doi: 10.1016/j.humov.2003.09.005. [DOI] [PubMed] [Google Scholar]
- Volman JM, Geuze RH. Relative phase stability of bimanual and visuomanual rhythmic coordination patterns in children with a Developmental Coordination Disorder. Human Movement Science. 1998;17:541–572. [Google Scholar]
- Whitall J, Chang TY, Horn CL, Jung-Potter J, McMenamin S, Wilms-Floet A, Clark JE. Auditory-motor coupling of bilateral finger tapping in children with and without DCD compared to adults. Human Movement Science. 2008;27:914–931. doi: 10.1016/j.humov.2007.11.007. [DOI] [PMC free article] [PubMed] [Google Scholar]
- Wilson PH, Maruff P, Lum J. Procedural learning in children with developmental coordination disorder. Human Movement Science. 2003;22:515–526. doi: 10.1016/j.humov.2003.09.007. [DOI] [PubMed] [Google Scholar]