Abstract
Large scale human genetic studies require technologies for generating millions of genotypes with relative ease but also at a reasonable cost and with high accuracy. We describe a highly parallel method for genotyping single nucleotide polymorphisms (SNPs), using generic high-density oligonucleotide arrays that contain thousands of preselected 20-mer oligonucleotide tags. First, marker-specific primers are used in PCR amplifications of genomic regions containing SNPs. Second, the amplification products are used as templates in single base extension (SBE) reactions using chimeric primers with 3' complementarity to the specific SNP loci and 5' complementarity to specific probes, or tags, synthesized on the array. The SBE primers, terminating one base before the polymorphic site, are extended in the presence of labeled dideoxy NTPs, using a different label for each of the two SNP alleles, and hybridized to the tag array. Third, genotypes are deduced from the fluorescence intensity ratio of the two colors. This approach takes advantage of multiplexed sample preparation, hybridization, and analysis at each stage. We illustrate and test this method by genotyping 44 individuals for 142 human SNPs identified previously in 62 candidate hypertension genes. Because the hybridization results are quantitative, this method can also be used for allele-frequency estimation in pooled DNA samples.
The Human Genome Project and other private efforts are producing large amounts of genome sequence and polymorphism data that will provide scientists with an unprecedented opportunity to probe the structure and function of the human genome (Collins et al. 1998). In the realm of human disease, these genomic resources will allow the dissection of the genetic components and molecular mechanisms of complex human diseases and traits. Identification of complex disease genes will require both linkage and association analyses of thousands of polymorphisms across the human genome in thousands of individuals (Risch and Merikangas 1996; Collins et al. 1997; Chakravarti 1999). To enable such large-scale polymorphism analysis in human studies, parallel and efficient genotyping methods are critically needed. The most common variant in the human genome is the single nucleotide polymorphism (SNP) (Wang et al. 1998; Cargill et al. 1999; Halushka et al. 1999). Homogenous and microarray-based minisequencing has been used to genotype SNPs in human populations (Syvanen et al. 1990; Kuppuswamy et al. 1991; Chen and Kwok 1997; Pastinen et al. 1997,1998; Syvanen 1998). We present a parallel genotyping method for SNPs, termed TAG–SBE, which analyzes allele-specific single base extension (SBE) reactions on standardized, generic high-density oligonucleotide probe arrays (Chee et al. 1996; Shoemaker et al. 1996; Wang et al. 1998; Lipshutz et al. 1999). In TAG–SBE, the array is independent of the specific markers genotyped and the assay can be customized for sets of markers through PCR and SBE primer selection. Because this genotyping method is generic, intrinsically parallel, and favors multiplexed reactions, TAG-SBE is well-suited for large-scale human genetic studies.
To design the tag arrays, all possible 20 mers (420 or ∼1012) were subjected to a computational screen that favored a subset of sequences with similar GC content and thermodynamic properties, and eliminated sequences with possible secondary structure or sequence similarity to other tags (Shoemaker et al. 1996; Giaever et al. 1999; Winzeler et al. 1999). A set of 32,000 tags was selected, with all tags expected to have similar hybridization characteristics and minimal cross-hybridization under standard hybridization conditions. As a hybridization control, and to enable background and cross-hybridization subtraction, each tag probe (PM, perfect match) is paired with a second probe that is identical in sequence except for a single base difference at the central position (MM, mismatch). The high-density tag array used in this study consists of over 64,000 distinct probes, over 32,000 PM tag probes, and over 32,000 adjacent MM probes, each probe occupying an area of 30×30 μm.
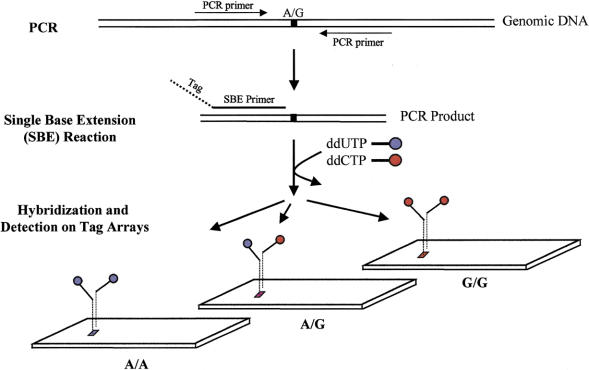
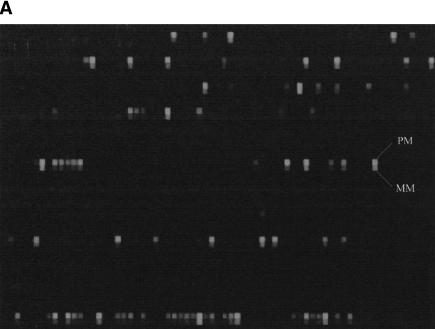
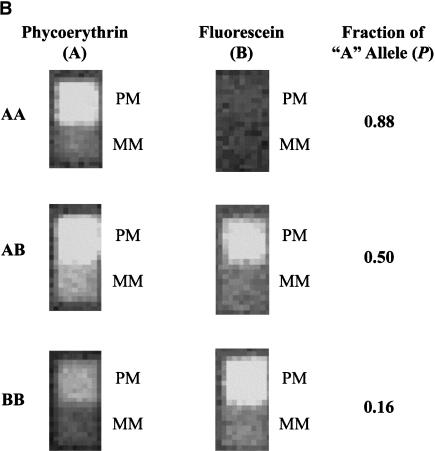
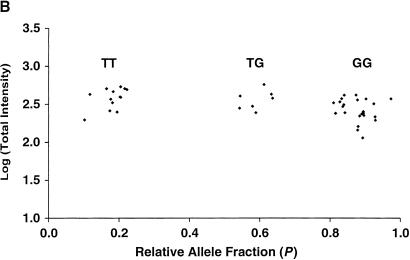
The TAG–SBE genotyping method pairs the extension primer for each marker with a unique tag sequence, allowing the deconvolution of multiplexed preparations on a single high-density probe array (Fig. 1). The TAG–SBE approach can also be multiplexed both at the primary PCR and the SBE steps (see below). The resulting hybridization pattern from a typical TAG–SBE assay is shown in Figure 2A. The intensities of the two fluorophores used are measured and corrected for background and spectral overlap. The quantitative hybridization results are then used to make genotype calls (Figure 2B).
Figure 1.
TAG–SBE genotyping assay. Marker-specific primers are designed for amplification of each SNP from genomic DNA (Wang et al. 1998); all SNPs with the same pair of variant bases (e.g., A/G SNPs) are pooled. The double-stranded PCR products serve as templates for the SBE reaction. Each SBE primer is chimeric with a 5' end complementary to a unique tag synthesized on the array and a 3' end complementary to the genomic sequence and terminating one base before a polymorphic SNP site. Thus, each SBE primer is uniquely associated with a specific tag (location) on the array. SBE primers corresponding to multiple markers are added to a single reaction tube and extended in the presence of pairs of ddNTPs labeled with different fluorophores; for example, an A/G bi-allelic marker is extended in the presence of biotin-labeled ddUTP and fluorescein-labeled ddCTP. The labeled multiplex SBE reaction products are pooled and hybridized to the tag array. Three hybridization patterns are shown, corresponding to three genotypes AA, AG, and GG.
Figure 2.
(A) Fluorescence image of a small portion of an oligonucleotide tag array following hybridization of 77 labeled SBE primers. The entire array contains >32,000 20-mer tag probe pairs. The physically adjacent PM and MM probes for a single tag probe pair are labeled. (B) The fluorescence intensity pattern for a tag probe pair showing the presence of an AA homozygote, an AB heterozygote, and a BB homozygote, and the computed relative allele fraction value P = (PM−MM)fluorescein / [(PM−MM)fluorescein + (PM−MM)phycoerythrin]. Because of the partial overlap of the emission spectra of fluorescein and phycoerythrin, there is some spillover of fluorescein signal into the phycoerythrin emission channel. Background signals are subtracted and corrections for spectral overlap are applied prior to the quantitative genotyping analysis.
We first tested whether SBE methods for genotyping could be simplified. Previously published SBE methods such as minisequencing (Pastinen et al. 1997,1998; Syvanen 1998) and genetic bit analysis (Nikiforov et al. 1994; Head et al. 1997) required that double-stranded templates be converted to single-stranded templates prior to the base extension reaction [although double-stranded templates have been successfully used in fluorescence energy transfer-based SBE assays (Chen et al. 1997)]. We compared the TAG–SBE results obtained with three SNP markers using both single-stranded and double-stranded PCR products as templates, and found similar two-color intensity ratios and no significant differences in the absolute hybridization signal intensities. Thus, for all subsequent analyses, and the assays described here, double-stranded PCR templates were used in the SBE reactions.
To test the robustness, accuracy, and efficiency of the TAG–SBE method, we developed genotyping assays for a subset of the 874 SNPs that were identified recently in a large-scale polymorphism screen of 75 hypertension candidate genes (Halushka et al. 1999). Of these, we chose 171 SNPs in 68 genes, focusing on SNPs likely to have a functional significance: We chose SNPs in promoter regions, at splice junctions, and those that altered protein sequence. PCR primers were designed and tested individually for each of the 171 SNP-containing genomic regions. Of these, eight (4.7%) failed to amplify, and SBE primers were designed for the remaining 163 SNPs. We did not attempt to rescue the failed PCRs at this point, but this could be done if needed by reselecting primers or through a modification of the standard PCR conditions. For six of the 163 SNPs, SBE primers were designed for both the forward and reverse strands. Nine multiplex PCR and SBE reactions were designed with 9–28 markers in each set. Of the 163 SNP markers tested, 21 SNPs (12.9%) were further eliminated because they consistently produced poor signals in multiple samples tested. These failures were systematic, and were the result of poor amplification in the multiplex PCR or SBE reactions, or poor hybridization behavior on the array. It has been shown previously that roughly one out of 10 tag sequences do not hybridize sufficiently well on arrays of this type (Winzeler et al. 1999). Although these SNPs may be rescued by primer or protocol changes, repooling, using the opposite strand extension primer, or simply linking the primer to a different tag sequence (from which there are many to choose), we have not attempted further optimization of these 29 (8+21) markers. The remaining 142 markers in 62 genes were used in subsequent genotyping experiments. The 142 SNPs used, the genes involved and other details of the polymorphisms, and the designed primers are listed in a table located in the online supplement (note that the first 20 bases of the SBE primers listed in the table are complementary to the tag probes on the array). Additional information on these SNPs can be found indbSNP (http://www.ncbi.nlm.nih.gov/SNP/) or at http://genome.cwru.edu/candidates/snps.html3) (Halushka et al. 1999).
To test the reproducibility of the TAG–SBE assay, we performed the multiplex PCR, SBE reactions, and the array hybridization experiments in duplicate for four independent samples. A high correlation between the hybridization signals of the replicate measurements (R2 = 0.92 for fluorescein signals and R2 = 0.93 for phycoerythrin signals) was observed for the 142 SNPs. More importantly, there were no discrepancies in genotyping calls between the duplicate measurements.
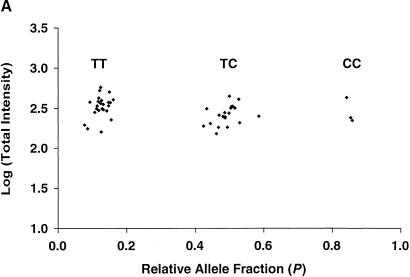
We next used tag arrays to obtain the genotypes for all 142 SNPs in 44 unique DNA samples. Hybridization signals sufficiently above background were obtained for 96.5% (6029/6248) of the 6248 (142×44) possible calls . Based on the two-color signal intensity ratios, distinct genotype clusters were obtained for ∼80% of the markers (Fig. 3). We used a combination of automatic software analysis and blind manual editing to assign genotypes for all 142 markers in the 44 samples. For five of the six SNPs that had both forward and reverse SBE primers, identical genotypes were obtained from both strands in all 44 individuals (i.e., complete concordance in 220 paired tests). For one SNP (DCP1EX13.138), clear hybridization results were obtained for the forward primer, but the results were inconclusive for the reverse SBE primer and therefore calls for that strand were not made (i.e., one strand yielded clear results while the other produced a “no call”). In no cases did the two strands give contradictory results. This experiment indicates that either strand (or both) can be used for TAG–SBE analysis of the majority of the markers, and that for some markers, one strand may be more informative than the other. As described above, these assays were not fully optimized and we anticipate that it is possible to increase the overall genotyping yield further.
Figure 3.
Cluster analysis of tag array hybridization results for 44 individuals at SNP marker (A) ANPex3.33 and (B) SELP.25. The logarithm of total fluorescence intensity [(PM−MM)fluorescein + (PM−MM)phycoerythrin] for each of the 44 hybridizations is plotted against the calculated relative allele fraction value P. The three distinct clusters observed correspond to the genotypes T/T, T/C, and C/C for marker ANPex3.33, and T/T, T/G, and G/G for marker SELP.25.
To determine the accuracy of the method, we used gel-based DNA sequencing to determine the genotypes of three individuals (a subset of the 44 persons studied earlier) at 133 loci. Comparison of the 355 paired gel-based and TAG–SBE genotype calls showed a total of 17 discrepancies involving seven different markers (see Table 1), a 4.8% discordance rate. Some of these discrepancies involved cases where one method made a homozygote call while the other method called a heterozygote. But there were also cases in which the gel-based sequencing and array-based genotyping yielded opposite homozygote genotype calls; we suspect systematic mispriming of the SBE primer to adjacent similar sequences as the likely cause of the discrepancy. Designing an SBE assay using primers for the other strand may be sufficient to solve the problem in most cases.
Table 1.
Discrepancies Between Genotyping Calls with Gel-based Sequencing and the Array-based Method
| SNP name | WT allele | Mutant allele | Gel-based sequencing | Array-based assay | Discrepancies | ||||
|---|---|---|---|---|---|---|---|---|---|
| 904889 | 90896 | 904957 | 904889 | 904896 | 904957 | ||||
| ACEEX17.19 | C | A | C/C | A/A | A/C | C/C | C/C | C/C | 2 |
| CYP11B2EX6.91 | T | C | T/C | T/C | T/C | T/T | T/T | T/T | 3 |
| CYP11B2BX7.65 | T | C | T/C | C/C | C/C | T/T | T/T | T/T | 3 |
| GLUT4EX3.112 | C | G | G/G | G/G | G/G | C/C | C/C | C/C | 3 |
| GALNREX1.553 | G | C | G/C | G/G | G/C | G/G | G/G | G/G | 2 |
| ICAM1EX6.254 | G | A | G/G | G/G | G/G | A/A | A/A | A/A | 3 |
| GMP-140.25 | T | G | G/G | G/G | G/G | G/G | T/G | G/G | 1 |
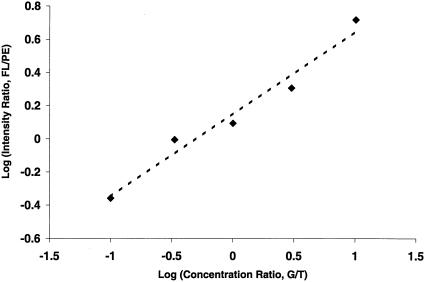
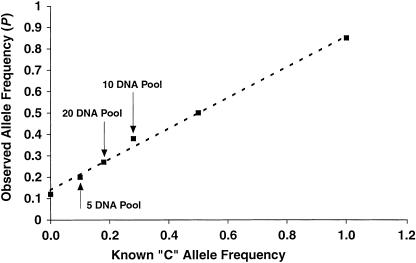
The quantitative nature of the two-color TAG–SBE measurements suggests the possibility of using pooled DNA samples to estimate allele frequencies and screen large numbers of loci for allele frequency differences between groups of phenotypically distinct individuals (Shaw et al. 1998 for microsatellite markers; Syvanen et al. 1993; Hacia et al. 1998 for SNP markers). To test this, we first synthesized two artificial SBE templates and performed controlled mixing experiments. As shown in Figure 4, the intensity ratio of the two fluorophores and the template concentration ratio are highly correlated over a 100-fold concentration range. We further tested the TAG–SBE assay performance with pooled DNA samples. Genomic DNA from five, 10, and 20 individuals with known genotypes was pooled and treated the same way as the DNA samples from individuals in all subsequent PCR amplification, SBE reaction, and chip hybridization steps. In general, the observed allele frequencies were related directly to the values expected based on the known genotypes of the individuals in the pool (Fig. 5), and relatively small differences in allele frequency could be reliably detected for many markers. This strategy may be used to estimate allele frequencies in populations and to scan large numbers of markers for allele-frequency differences while greatly reducing the number of individual measurements required for association studies designed to detect genetic differences between groups of individuals with phenotypic differences. The minimum detectable allele-frequency differences and the maximum number of markers that can be genotyped in parallel remain to be determined.
Figure 4.
Quantitative allele frequency estimation based on two-color analysis of synthetic mixed templates. The two templates were mixed in the ratios of 1 nM/10 nM, 1 nM/3 nM, 1 nM/1 nM, 3 nM/1 nM, and 10 nM/1 nM, respectively. The logarithm of intensity ratios of the two colors (Y-axis) are plotted against the logarithm of concentration ratios of the two mixed templates (X-axis). FL, fluorescein intensity; PE, phycoerythrin intensity; G/T, concentration ratio of template G to template T.
Figure 5.
Allele frequency estimation for individual homozygotes, heterozygotes, and collections of multiple individuals at the SNP marker ANPex3.33. For the pooled samples, genomic DNA from a group of 5, 10, and 20 individuals (C-allele frequencies of 0.10, 0.28, and 0.18, respectively) was pooled in equal amounts and treated in the same way as the samples from single individuals. The observed allele fraction value P is plotted against the known C allele frequency, along with the best fit line as a guide to the eye. The line intercepts the Y-axis above the origin, and this systematic offset is the result of a small amount of cross-hybridization and misincorporation of the wrong base in the two-color SBE reaction. A correction can be applied to the data following the observation of pure genotypes to obtain a more accurate estimate of the absolute allele frequencies.
Our approach combines the parallelism and flexibility of a standardized high-density oligonucleotide array readout with the enhanced fidelity of enzymatic primer extension reactions. Using a standard array of generic tags eliminates the need to design and manufacture custom arrays for specific sets of markers, as only the PCR and extension primers need to be customized. Furthermore, the tag-based approach uses as few as one or two oligonucleotide probes per marker rather than the 56 probes used previously on variant detector arrays (VDAs) (Wang et al. 1998). The standard tag array could also be used in combination with other genotyping approaches including multiplex oligonucleotide ligation assays (OLA) (Delahunty et al. 1996; Tobe et al. 1996; Chen et al. 1998), invasive cleavage of oligonucleotide probe assays (Lyamichev et al. 1999), and allele-specific PCR methods (Newton et al. 1989; Lo et al. 1991).
The experiments described here used only a small fraction of the 32,000 tags synthesized on the array and have not taken full advantage of the multiplexing possibilities. Our previous experience with developing highly discriminating sets of oligonucelotide probes for yeast gene expression measurements and genotyping, suggests that it should be possible to use a large fraction of the 32,000 tags on the array in a single experiment (Wodicka et al. 1997; Winzeler et al. 1998). A set of three such arrays would allow the determination of nearly 100,000 genotypes. The current array was synthesized using 30 μm features on an 8×8 mm chip. A single, 12.8×12.8 mm array with 24 μm features could interrogate 128,000 SNPs at a time. Physically smaller arrays with fewer tags may also be useful. Scaling down the array size to 2×2 mm, an array containing 24 μm features could encode over 3000 tags and accommodate many important genotyping applications in which more markers may not be necessary. In addition, multiple sets of tags can be associated with each locus-specific extension primer in separate reactions (pooled for hybridization). In this manner, a single array could be used to analyze the same loci from multiple individuals at once.
The highly parallel nature of oligonucleotide arrays and their ability to interrogate complex mixtures of nucleic acids enables significant flexibility in the design of genotyping assays. Simple calculations suggest that the cost of amplification and labeling reactions can be a significant barrier to the broad use of large-scale genotyping methods. The multiplex sample preparations demonstrated here permit significant reductions in reagent use. Thus, multiplexing both specific genomic amplifications and SBE reactions reduced the 284 reactions needed for the 142 SNPs to only 18 reactions. This 16-fold reduction can be extended by pooling strategies. The current scheme uses two colors and requires six separate SBE reactions. The use of four colors would allow a single-tube reaction, with associated increases in efficiency and reduction of genotyping costs.
METHODS
Sample Collection and DNA Isolation
DNA samples from 44 individuals were collected as part of the ongoing GenNet network of the National Heart, Lung, and Blood Institute Family Blood Pressure Program. The sampling scheme was designed to ascertain nuclear families through a hypertensive proband. Samples were collected under informed consent and IRB approval at each of two field centers in Tecumseh, MI and Maywood, IL. DNA was extracted from buffy coats isolated from 5 to 10 ml of whole blood using a standard salting-out method and the PureGene kit (Gentra Systems). For the pooling experiments, genomic DNA from five, 10, and 20 individuals was pooled in equal amounts, and treated like single DNA samples in subsequent PCR amplifications, SBE reactions, and chip hybridizations.
Primer Design
For each SNP, primary PCR amplification primers were designed as described previously (Wang et al. 1998). The SBE primers were designed so that the 3' end terminates one base before the polymorphic site. The Primer 3.0 software (http://www.genome.wi.mit.edu/cgi-bin/primer/primer3.cgi) was modified and used to pick SBE primers at a predicted length of 20 nucleotides (range: 16–26) and melting temperature of 57°C (range: 53°C–64°C). SBE primers were picked from the forward direction first (i.e., 5' to the SNP), the reverse direction being used when a suitable primer could not be chosen for the forward direction.
Multiplex PCR
Specific amplification of the genomic regions containing the 142 SNPs was achieved with nine multiplex PCR reactions, each containing 50 ng of human genomic DNA, 0.5 μM of each primer, 1 mM deoxynucleotide triphosphates (dNTPs), 10 mM Tris-HCl (pH 8.3), 50 mM KCl, 5 mM MgCl2 and 2 units of AmpliTaq Gold (Perkin Elmer) in a total volume of 25 μl. PCR was performed on a Thermo Cycler (MJ Research) with initial denaturation of the DNA templates and Taq enzyme activation at 96°C for 10 min, followed by 40 cycles of denaturation at 94°C for 30 sec, 57°C for 40 sec, and 72°C for 90 sec. The final extension reaction was at 72°C for 10 min.
SBE Template Preparation
One μl of Exonuclease I (10 U/μl, Amersham Life Science) and 1 μl of Shrimp Alkaline Phosphatase (1 U/μl, Amersham Life Science) were added to 25 μl PCR products and incubated at 37°C for 1 hr. The enzymes were inactivated at 100°C for 15 min. The enzymatically treated samples were applied to an S-300 column (Pharmacia) to further remove residual PCR primers and dNTPs. The buffer was replaced with ddH2O.
Multiplex SBE Reaction
SBE reactions were carried out in 33 μl reactions using 6 μl of the template (see above), 1.5 nM of each SBE primer, 2.5 Units of Thermo Sequenase (Amersham), 52 mM Tris-HCl (pH 9.5), 6.5 mM MgCl2, 25 μM of fluorescein-N6-d-dNTPs (New England Nuclear), 7.5 μM biotin-N6-d-dUTP or biotin-N6-d-CTP or 3.75 μM biotin-N6-d-dATP, and 10 μM of the other cold ddNTPs. Extension reactions were carried out on a Thermo Cycler (MJ Research) with 1 cycle at 96°C for 3 min, then 45 cycles of 94°C for 20 sec and 58°C for 11 sec. After SBE reactions, the products of the nine reactions from each sample were combined and mixed with 30 μl of 100 μg/ml glycogen (Boehringer Mannheim), 18.75 μl of 8 M LiCl (Sigma), and 1.1 ml of prechilled (−20°C) ethanol (200 proof), and precipitated by centrifugation (Eppendorf centrifuge 5415C) for 15 min at room temperature; precipitated samples were dried at 40°C for 40 min and resuspended in 33 μl ddH2O.
Tag Array Design and Hybridization
For each tag sequence, two probes were synthesized on the array: one matches the designed-tag sequence exactly (PM probe) and the other being identical except for a single base difference in the central position (MM probe). The mismatch probe serves as an internal control for hybridization specificity and enables effective subtraction of background and cross-hybridization signals. Over 32,000 20-mer tag probes and their mismatch partners were chosen (Shoemaker et al. 1996) and fabricated on 8×8 mm arrays. Each probe (feature) occupies an area of 30×30 μm, which contains ∼107 copies of the chosen 20-mer oligonucleotide. Sets of 100 arrays were synthesized together on a single glass wafer.
The labeled SBE reaction products were denatured at 95°C–100°C for 10 min and snap cooled on ice for 2–5 min. The tag array was prehybridized with 6× SSPE-T [0.9 M NaCl, 60 mM NaH2PO4, 6 mM EDTA (pH 7.4), 0.005% Triton X-100] and 0.5 mg/ml BSA for a few minutes, then hybridized with 120 μl hybridization solution (shown below) at 42°C for 2 hr on a rotisserie (at 40 RPM). The hybridization solution consisted of 3M TMACl (tetramethylammonium chloride), 50 mM MES [2-(N-morpholinoethanesulfonic acid) sodium salt] (pH 6.7), 0.01% of Triton X-100, 0.1 mg/ml of herring sperm DNA, 50 pM of fluorescein-labeled control oligo, 0.5 mg/ml of BSA (Sigma) and 29.4 μl-labeled SBE products (see above) in a total value of 120 μl.
After hybridization, the arrays were rinsed twice with 1× SSPE-T for ∼10 sec at room temperature, then washed with 1× SSPE-T for 15–20 minutes at 40°C on a rotisserie at 40 RPM. The arrays were washed 10 times with 6× SSPE-T at 22°C on a fluidics station (FS400, Affymetrix) and then stained at room temperature with 120 μl staining solution [2.2 μg/ml streptavidin R-phycoerythrin (Molecular Probes), and 0.5 mg/ml acetylated BSA, in 6× SSPET] and mixed on a rotisserie for 15 min at 40 RPM. After staining, the arrays were washed 10 times with 6× SSPET on the fluidics station at 22°C. The arrays were scanned on a confocal scanner (Affymetrix) and fluorescence at 530 nm (fluorescein), and 560 nm (phycoerythrin) was collected with a spatial resolution of 60–70 pixels per feature. GeneChip software (Affymetrix) was used to convert image files into digitized files for further data analysis.
Genotype Determination
For a given marker (at a given tag probe position), the fluorescence intensity of each of the two fluorophores (fluorescein and phycoerythrin) was corrected for background and nonspecific hybridization by subtracting the intensity at the MM from that of the PM; negative values of PM–MM were treated as zero. Because of the overlap between the emission spectra of the two fluorophores, a fraction of the fluorescein signal (7.6%) was subtracted from the signal seen in the phycoerythrin channel (Hacia et al. 1998). A metric P which estimates the relative amount of each allele in the target mixture was computed as the relative proportion of the corrected intensities [fluorescein/(fluorescein+phycoerythrin)]. To define genotype clusters for each SNP (see Figure 3), the P values associated with each sample were sorted, and ranges corresponding to the three SNP genotypes were computed using an algorithm based on empirical observations across many genotyping experiments. The purpose of this algorithm is to identify well-separated ranges of experimental values that correspond to distinct genotypes. The specific algorithm employed here used the following rules: (1) At most four values (outliers), about 10% of the total data may be excluded from the computed ranges; (2) each pair of ranges must extend over an area of ≥0.3 and all three ranges must extend over ≥0.5; (3) individual ranges must be separated by a gap of ≥ 0.1; (4) the width of a single range may be ≤0.4. A “goodness” of fit statistic computed as 1−(sum of range widths/total range)−(number of outliers /10) was maximized for the set of ranges chosen.
Quantitative Allele Analysis
Two templates, template-T (5'-TGCTGAATATTCAGATTCTCTAGTGCTACCTGAAAGATCCTG-3') and template-G (5'-TGCTGAATATTCAGATTCTCGAGTGCTACCTGAAAGATCCTG-3') were synthesized. They were identical except at a single (21st) position: T in template-T, and G in template-G. The two templates were mixed in the ratios of 1 nM/10 nM, 1 nM/3 nM, 1 nM/1 nM, 3 nM/1 nM, and 10 nM/1 nM, respectively. The following five distinct SBE primers, 5'-TGCGATTCTTTGCCGTCAGGCAGGATCTTTCAGGTAGCACT-3′, 5′-GGCGAAGTTCCTCTAGTGTTCAGGATCTTTCAGGTAGCACT-3′, 5′-GGCCTCGGTGTTCAGCATATCAGGATCTTTCAGGTAGCACT-3′, 5′-TGGAGATCGTTGCTTGTACCCAGGATCTTTCAGGTAGCACT-3′, 5′-TGCATTGATTTAACTGCGCGCAGGATCTTTCAGGTAGCACT-3′, were added separately to five SBE reactions containing the five types of mixed templates. The SBE primers were extended in the presence of biotin-labeled ddATP and fluorescein-labeled ddCTP, pooled, and hybridized to a tag array.
Gel-based Automated DNA Sequencing
To independently confirm the genotypes called using the TAG–SBE assay, three samples (904957, 904896, and 904889) were sequenced for 115 SNPs from the table in the online supplement, using conventional gel-based methods. Samples were amplified for all sites with T7- and T3-tagged primers using standard PCR cycling conditions [2.5 μl of 20 ng/μl DNA, 0.375 μl of 20 μM primer (X2), 1.5 μl of 10× PCR buffer, 0.9 μl 25mM MgCl2, 0.15 μl 10 mM dNTPs, 0.25 μl 10 U/μl Taq DNA Polymerase (Sigma), in a total volume of 15 μl with ddH20]. Some products were sequenced directly while others required an M13 nesting strategy because of the close proximity of the polymorphic base and primer end. Samples from the initial amplification were diluted 1:50 with ddH20 and amplified with M13F-T7 (5′-TGTAAAACGACGGCCAGTTAATACGACTCACTATAGGGAGA-3′) and M13R-T3 (5′-AACAGCTATGACCATGAATTAACCCTCACTAAAGGGAGA-3′) primers using standard PCR conditions. All PCR products were cleaned with Exonuclease I (Amersham 0.15 μl of 10 U/μl per well) and Shrimp Alkaline Phosphatase (Amersham, 0.30 μl of 1 U/μl per well) in a volume of 10 μl. Dye terminator sequencing using an M13R primer (AACAGCTATGACCATG) or T7 primer (TAATACGACTCACTATAGGGAGA) on an ABI377 (Perkin Elmer) using Big Dye (Perkin Elmer) was performed to determine the genotype status for each SNP in each of the three individuals. Trace files were read with Edit View 1.0 (Perkin Elmer) software.
Acknowledgments
We thank Drs. A. Weder and R. Cooper for DNA sample collection, M. Mittmann and D. Shoemaker for tag selection and array design, D. Stern for construction of array scanners used in this study, K. Bentley for DNA sequencing, and K. Gunderson for helpful discussions. This work was supported by a grant from the Advanced Technology Program of the National Institutes of Standards and Technology (70NANB5H1031) to Affymetrix, and research funds from Case Western Reserve University, University Hospitals of Cleveland, the National Heart, Lung, and Blood Institute (HL54466), and the National Institute of Mental Health (MH60007) to A.C. This research is a contribution of GenNet, a network of the National Heart, Lung, and Blood Institute's Family Blood Pressure Program.
The publication costs of this article were defrayed in part by payment of page charges. This article must therefore be hereby marked “advertisement” in accordance with 18 USC section 1734 solely to indicate this fact.
Footnotes
E-MAIL rob_lipshutz@affymetrix.com; FAX (408) 481-0422.
REFERENCES
- Cargill M, Altshuler D, Ireland J, Sklar P, Ardlie K, Patil N, Lane CR, Lim EP, Kalayanaraman N, Nemesh J, et al. Characterization of single-nucleotide polymorphisms in coding regions of human genes. Nature Genet. 1999;22:231–238. doi: 10.1038/10290. [DOI] [PubMed] [Google Scholar]
- Chakravarti A. Population genetics–making sense out of sequence. Nature Genet. 1999;21:56–60. doi: 10.1038/4482. [DOI] [PubMed] [Google Scholar]
- Chee M, Yang R, Hubbell E, Berno A, Huang XC, Stern D, Winkler J, Lockhart DJ, Morris MS, Fodor SP. Accessing genetic information with high-density DNA arrays. Science. 1996;274:610–614. doi: 10.1126/science.274.5287.610. [DOI] [PubMed] [Google Scholar]
- Chen X, Kwok PY. Template-directed dye-terminator incorporation (TDI) assay: a homogeneous DNA diagnostic method based on fluorescence resonance energy transfer. Nucleic Acids Res. 1997;25:347–353. doi: 10.1093/nar/25.2.347. [DOI] [PMC free article] [PubMed] [Google Scholar]
- Chen X, Zehnbauer B, Gnirke A, Kwok PY. Fluorescence energy transfer detection as a homogeneous DNA diagnostic method. Proc Natl Acad Sci . 1997;94:10756–10761. doi: 10.1073/pnas.94.20.10756. [DOI] [PMC free article] [PubMed] [Google Scholar]
- Chen X, Livak KJ, Kwok PY. A homogeneous, ligase-mediated DNA diagnostic test. Genome Res. 1998;8:549–556. doi: 10.1101/gr.8.5.549. [DOI] [PMC free article] [PubMed] [Google Scholar]
- Collins FS, Guyer MS, Chakravarti A. Variations on a theme: Cataloging human DNA sequence variation. Science. 1997;278:1580–1581. doi: 10.1126/science.278.5343.1580. [DOI] [PubMed] [Google Scholar]
- Collins FS, Patrinos A, Jordan E, Chakravarti A, Gesteland R, Walters L. New goals for the U.S. Human Genome Project: 1998–2003. Science. 1998;282:682–689. doi: 10.1126/science.282.5389.682. [DOI] [PubMed] [Google Scholar]
- Delahunty C, Ankener W, Deng Q, Eng J, Nickerson DA. Testing the feasibility of DNA typing for human identification by PCR and an oligonucleotide ligation assay. Am J Hum Genet. 1996;58:1239–1246. [PMC free article] [PubMed] [Google Scholar]
- Giaever G, Shoemaker DD, Jones TW, Liang H, Winzeler EA, Astromoff A, Davis RW. Genomic profiling of drug sensitivities via induced haploinsufficiency. Nature Genet. 1999;21:278–283. doi: 10.1038/6791. [DOI] [PubMed] [Google Scholar]
- Hacia JG, Edgemon K, Sun B, Stern D, Fodor SP, Collins FS. Two color hybridization analysis using high density oligonucleotide arrays and energy transfer dyes. Nucleic Acids Res. 1998;26:3865–3866. doi: 10.1093/nar/26.16.3865. [DOI] [PMC free article] [PubMed] [Google Scholar]
- Halushka M, Fan J-B, Bentley K, Hsie L, Shen N, Weder A, Cooper R, Lipshutz R, Chakravarti A. Patterns of single nucleotide polymorphisms in candidate genes regulating blood pressure homeostasis. Nature Genet. 1999;22:239–247. doi: 10.1038/10297. [DOI] [PubMed] [Google Scholar]
- Head SR, Rogers YH, Parikh K, Lan G, Anderson S, Goelet P, Boyce-Jacino MT. Nested genetic bit analysis (N-GBA) for mutation detection in the p53 tumor suppressor gene. Nucleic Acids Res. 1997;25:5065–5071. doi: 10.1093/nar/25.24.5065. [DOI] [PMC free article] [PubMed] [Google Scholar]
- Kuppuswamy MN, Hoffmann JW, Kasper CK, Spitzer SG, Groce SL, Bajaj SP. Single nucleotide primer extension to detect genetic diseases: experimental application to hemophilia B (factor IX) and cystic fibrosis genes. Proc Natl Acad Sci . 1991;88:1143–1147. doi: 10.1073/pnas.88.4.1143. [DOI] [PMC free article] [PubMed] [Google Scholar]
- Lipshutz RJ, Fodor SP, Gingeras TR, Lockhart DJ. High density synthetic oligonucleotide arrays. Nature Genet. 1999;21:20–24. doi: 10.1038/4447. [DOI] [PubMed] [Google Scholar]
- Lo YM, Patel P, Newton CR, Markham AF, Fleming KA, Wainscoat JS. Direct haplotype determination by double ARMS: Specificity, sensitivity and genetic applications. Nucleic Acids Res. 1991;19:3561–3567. doi: 10.1093/nar/19.13.3561. [DOI] [PMC free article] [PubMed] [Google Scholar]
- Lyamichev V, Mast AL, Hall JG, Prudent JR, Kaiser MW, Takova T, Kwiatkowski RW, Sander TJ, de Arruda M, Arco DA, et al. Polymorphism identification and quantitative detection of genomic DNA by invasive cleavage of oligonucleotide probes. Nature Biotech. 1999;17:292–296. doi: 10.1038/7044. [DOI] [PubMed] [Google Scholar]
- Newton CR, Graham A, Heptinstall LE, Powell SJ, Summers C, Kalsheker N, Smith JC, Markham AF. Analysis of any point mutation in DNA: The amplification refractory mutation system (ARMS) Nucleic Acids Res. 1989;17:2503–2516. doi: 10.1093/nar/17.7.2503. [DOI] [PMC free article] [PubMed] [Google Scholar]
- Nikiforov TT, Rendle RB, Goelet P, Rogers YH, Kotewicz ML, Anderson S, Trainor GL, Knapp MR. Genetic bit analysis: a solid phase method for typing single nucleotide polymorphisms. Nucleic Acids Res. 1994;22:4167–4175. doi: 10.1093/nar/22.20.4167. [DOI] [PMC free article] [PubMed] [Google Scholar]
- Pastinen T, Kurg A, Metspalu A, Peltonen L, Syvanen AC. Minisequencing: A specific tool for DNA analysis and diagnostics on oligonucleotide arrays. Genome Res. 1997;7:606–614. doi: 10.1101/gr.7.6.606. [DOI] [PubMed] [Google Scholar]
- Pastinen T, Perola M, Niini P, Terwilliger J, Salomaa V, Vartiainen E, Peltonen L, Syvanen AC. Array-based multiplex analysis of candidate genes reveals two independent and additive genetic risk factors for myocardial infarction in the Finnish population. Hum Mol Genet. 1998;7:1453–1462. doi: 10.1093/hmg/7.9.1453. [DOI] [PubMed] [Google Scholar]
- Risch N, Merikangas K. The future of genetic studies of complex human diseases. Science. 1996;273:1516–1517. doi: 10.1126/science.273.5281.1516. [DOI] [PubMed] [Google Scholar]
- Shaw SH, Carrasquillo MM, Kashuk C, Puffenberger EG, Chakravarti A. Allele frequency distributions in pooled DNA samples: applications to mapping complex disease genes. Genome Res. 1998;8:111–123. doi: 10.1101/gr.8.2.111. [DOI] [PubMed] [Google Scholar]
- Shoemaker DD, Lashkari DA, Morris D, Mittmann M, Davis RW. Quantitative phenotypic analysis of yeast deletion mutants using a highly parallel molecular bar-coding strategy. Nature Genet. 1996;14:450–456. doi: 10.1038/ng1296-450. [DOI] [PubMed] [Google Scholar]
- Syvanen AC. Solid-phase minisequencing as a tool to detect DNA polymorphism. Methods Mol Biol. 1998;98:291–298. doi: 10.1385/0-89603-443-7:291. [DOI] [PubMed] [Google Scholar]
- Syvanen AC, Aalto-Setala K, Harju L, Kontula K, Soderlund HA. Primer-guided nucleotide incorporation assay in the genotyping of apolipoprotein E. Genomics. 1990;8:684–692. doi: 10.1016/0888-7543(90)90255-s. [DOI] [PubMed] [Google Scholar]
- Syvanen AC, Sajantila A, Lukka M. Identification of individuals by analysis of biallelelic DNA markers, using PCR and solid-phase minisequencing. Am J Hum Genet. 1993;52:46–59. [PMC free article] [PubMed] [Google Scholar]
- Tobe VO, Taylor SL, Nickerson DA. Single-well genotyping of diallelic sequence variations by a two-color ELISA-based oligonucleotide ligation assay. Nucleic Acids Res. 1996;24:3728–3732. doi: 10.1093/nar/24.19.3728. [DOI] [PMC free article] [PubMed] [Google Scholar]
- Wang DG, Fan J-B, Siao CJ, Berno A, Young P, Sapolsky R, Ghandour G, Perkins N, Winchester E, Spencer J, et al. Large-scale identification, mapping, and genotyping of single-nucleotide polymorphisms in the human genome. Science. 1998;280:1077–1082. doi: 10.1126/science.280.5366.1077. [DOI] [PubMed] [Google Scholar]
- Winzeler EA, Richards DR, Conway AR, Goldstein AL, Kalman S, McCullough MJ, McCusker JH, Stevens DA, Wodicka L, Lockhart DJ, Davis RW. Direct allelic variation scanning of the yeast genome. Science. 1998;281:1194–1197. doi: 10.1126/science.281.5380.1194. [DOI] [PubMed] [Google Scholar]
- Winzeler EA, Shoemaker DD, Astromoff A, Liang H, Anderson K, Andre B, Bangham R, Benito R, Boeke JD, Bussey H, et al. Functional characterization of the S. cerevisiae genome by gene deletion and parallel analysis. Science. 1999;285:901–906. doi: 10.1126/science.285.5429.901. [DOI] [PubMed] [Google Scholar]
- Wodicka L, Dong H, Mittmann M, Ho MH, Lockhart DJ. Genome-wide expression monitoring in Saccharomyces Cerevisiae. Nat Biotechnology. 1997;15:1359–1367. doi: 10.1038/nbt1297-1359. [DOI] [PubMed] [Google Scholar]


