

Abstract
This study assesses the utility of compartmental analysis of SPECT data in lateralizing ictal onset in cases of a putative mesial temporal lobe epilepsy (mTLE). An institutional archival review provided 46 patients (18M, 28F) operated for a putative mTLE who achieved an Engel class Ia postoperative outcome. This established the standard to assure a true ictal origin. Ictal and interictal SPECT images were separately coregistered to T1-weighted (T1W) magnetic resonance (MR) image using a rigid transformation and the intensities matched with an l1 norm minimization technique. The T1W MR image was segmented into separate structures using an atlas-based automatic segmentation technique with the hippocampi manually segmented to improve accuracy. Mean ictal-interictal intensity difference values were calculated for select subcortical structures and the accuracy of lateralization evaluated using a linear classifier. Hippocampal SPECT analysis yielded the highest lateralization accuracy (91%) followed by the amygdala (87%), putamen (67%) and thalamus (61%). Comparative FLAIR and volumetric analyses yielded 89% and 78% accuracies, respectively. A multi-modality analysis did not generate a higher accuracy (89%). A quantitative anatomically compartmented approach to SPECT analysis yields a particularly high lateralization accuracy in the case of mTLE comparable to that of quantitative FLAIR MR imaging. Hippocampal segmentation in this regard correlates well with ictal origin and shows good reliability in the preoperative analysis.
Keywords: ictal onset, quantification, atlas-based segmentation, hippocampus, SPECT, volumetry, normalization
INTRODUCTION
Patterns of blood perfusion have been studied both qualitatively (Hwang et al., 2001; Kaiboriboon et al., 2002; Lee et al., 2000a; O’Brien et al., 1998; O’Brien et al., 1999; Shin et al., 2001; Sojkova et al., 2003; Tan et al., 2008; Vera et al., 1999; Won Chul et al., 2001; Zaknun et al., 2008; Zubal et al., 1995) and quantitatively (Aubert-Broche et al., 2003; Blumenfeld et al., 2004; Chang et al., 2002; Grova et al., 2005; Hogan et al., 1997; Houston et al., 1994; Kaiboriboon et al., 2005; Lee et al., 2000b; Lee et al., 2005; McNally et al., 2005; Pagani et al., 2002; Rossman et al., 2006; Stoeckel et al., 2001; Van Paesschen et al., 2003) for localization of epileptogenic sites. Quantitative analysis of cerebral blood perfusion patterns using single photon emission computed tomography (SPECT) imaging holds promise for providing more accurate anatomically-specific information compared to that of qualitative assessment (Aubert-Broche et al., 2005). The analysis may be performed by comparing the two cerebral hemispheres for perfusion asymmetry (Aubert-Broche et al., 2003; Aubert-Broche et al., 2005; Hogan et al., 1997), by comparing ictal and interictal images (Blumenfeld et al., 2004; Kaiboriboon et al., 2005; Lee et al., 2005; Rossman et al., 2006; Shin et al., 2001; Van Paesschen et al., 2003) and by comparing epileptic and nonepileptic subjects (Houston et al., 1994; Lee et al., 2005; Stoeckel et al., 2001). Stratification by age group in nonepileptic subjects has been reported to provide more reasonable age-related comparisons with patient groups (Pagani et al., 2002). Coregistration of SPECT with MR imaging allows accurate blood perfusion estimates in comparable brain regions (Blumenfeld et al., 2004; Kaiboriboon et al., 2005; Pagani et al., 2002; Van Paesschen et al., 2003), brain structures (Grova et al., 2005; Hogan et al., 1997; Sojkova et al., 2003; Won Chul et al., 2001) or merely for declaring perfusion asymmetry in a more general sense (Aubert-Broche et al., 2003). Alternatively, an atlas, usually a T1-weighted or SPECT image template, may be coregistered with all SPECT volumes (Blumenfeld et al., 2004; Kaiboriboon et al., 2005; Lee et al., 2005; Pagani et al., 2002). Meaningful changes in blood perfusion within the brain may then be declared using voxel-based analysis (Aubert-Broche et al., 2003; Blumenfeld et al., 2004; Chang et al., 2002; Houston et al., 1994; Kaiboriboon et al., 2005; Lee et al., 2000b; Lee et al., 2005; McNally et al., 2005; Patterson et al., 1997; Rossman et al., 2006; Van Paesschen et al., 2003) or analysis based on region-of-interest (ROI) or volume-of-interest (VOI) (Aubert-Broche et al., 2005; Blumenfeld et al., 2004; Grova et al., 2005; Hogan et al., 1997; Pagani et al., 2002).
Aside from accurate anatomical segmentation, there is a need to provide intensity normalization of both ictal and interictal SPECT images to account for possible changes in global cerebral blood flow and the effects of the particular administered radioactive tracer. Several suggestions have been made to accomplish this. These include a normalization to the mean intensity of the whole brain (O’Brien et al., 1998; Zubal et al., 1995), use of reference sites least affected by ictal perfusion (Boussion et al., 2000; Lewis et al., 2000), division of the intensities by the mean of the intensities in the top one percent of the imaged plane (Saxena et al., 1998), minimization of “difference histogram entropy” (Chang et al., 2002), and use of the z map (Boussion et al., 2002). Intensity normalization requires a transformation model. Perault et al (2002), in their evaluation of normalization methods using both one- and two-parameter linear transformation models and different methods of parameter estimation, suggested that a simple robust scaling is preferred for SPECT subtraction imaging (Perault et al., 2002).
SPECT intensities have not been thoroughly studied in individual brain sites in the case of mTLE. In this paper, individual compartmentalized neuroanatomical structures (i.e., hippocampus, amygdala, thalamus, and putamen) in the epileptic network are analyzed to determine whether their inclusion will benefit lateralization of the epileptogenic site. This is accomplished by linear coregistration of SPECT and MR images and automatic segmentation of the MR image using an atlas-based segmentation algorithm. An l1 norm minimization technique is then used to match the intensities of the ictal and interictal SPECT image. The method requires no reference site and, theoretically, maximizes the contrast between abnormal and normal regions in the ictal-interictal difference image. This approach is compared to attempts at lateralization by the application of hippocampal volumetry and fluid-attenuated inversion recovery (FLAIR) signal analysis in the same population of patients.
MATERIALS AND METHODS
2.1 Subjects
A single institutional archival review yielded 46 patients operated for mTLE by a single surgeon (KE) during a 12 year period (1997–2009) at Henry Ford Hospital, Detroit, Michigan (18 males, 28 females; age range 19–66, mean±SD = 40±12) who underwent a full complement of preoperative studies designated for such patients (Table 1). The patients had sufficient clinical followup (6.0±3.5, range 1–12 years) to establish surgical outcome specified by Engel Ia classification (Engel, 1987). All patients underwent video-electroencephalographic (vEEG) inpatient assessment over a minimum three day period, MR imaging, SPECT imaging, sodium amobarbital study, and neuropsychological assessment. Seventeen (5 males, 12 females) of the 46 patients (37%) required extraoperative electrocorticography (ECoG) with intracranially implanted electrode arrays. The epileptic focus resided on the right in 16 cases (35%) and on the left in 30 cases (65%). Patients with major motion artifact on MR imaging (13% of the archived population) had been excluded. MR images were qualitatively reviewed to render an impression of mesial temporal sclerosis (MTS) according to the following criteria: 1. Reduction of hippocampal volume as determined by a right-left asymmetry on T1-weighted (T1W) coronal images; 2. Increased FLAIR MR signal intensity; and 3. Loss of intrinsic hippocampal laminar structure. These features were required on at least two sequential coronal images to declare the impression of MTS. A single feature such as volume loss alone would, therefore, not support this impression. Those in whom ambiguity regarding laterality of the focus remained, intracranial electrodes were implanted for extraoperative ECoG.
Table 1.
Clinical profiles and hippocampal volumes of study patients. Patients are identified by gender, the need for intracranial electrographic study (II) in addition to the preliminary scalp EEG study (I), side of surgery, age at surgery, duration of epilepsy, and duration of followup. The likely initial precipitating event (risk) causing the epilepsy is provided along with the age at which it occurred, if known. The presence or absence of mesial temporal sclerosis (MTS) according to the radiologist’s report establishes the preoperative qualitative interpretation. Histopathology, when available, indicates the main feature of the interpretation. The volumes of both left and right hippocampi and the relative difference (left – right) between the two indicate that a negative outcome implicates but does not necessarily confirm a left mTLE when comparison is made with the side of surgery. Normalization ((L – R)/R) allows a comparison among cases. Abbreviations: I, inpatient scalp EEG study; II, extraoperative ECoG; AHS, Ammon’s horn sclerosis; CA, corpora amylacea; CHI, closed head injury; CP, complex partial; F, female; FCD, focal cortical dysplasia, FH, family history; FS, febrile seizure; Hipp, hippocampal; HypBI, hypoxic brain injury; L, left; LBG, low blood glucose, M, male; MDG, microdysgenesis; men, meningitis; mgioma, meningioma; NF1, neurofibromatosis type 1; N, no; ND, no diagnosis; PNI, perinatal ischemia; R, right; SG, secondary generalized; SP, simple partial; Vol, volume; Y, yes; y, year; s, second.
| Number | Gender | EEG | Side | Age at Surgery |
Duration of Epilepsy (y) |
Duration of Followup (y) |
Risk | MTS | Pathology | Semiology | Seizure Duration (s) |
Left Hipp Vol (mm3) |
Right Hipp Vol (mm3) |
Relative Difference (L-R)/R |
Injection Time (s) |
Ictal SPECT | Interictal SPECT |
|---|---|---|---|---|---|---|---|---|---|---|---|---|---|---|---|---|---|
| 1 | F | I/II | L | 30 | 23 | 10 | CHI(2y);FH | N | gliosis | CP | 78 | 3050 | 3023 | 0.01 | 4 | L | L |
| 2 | F | I/II | L | 54 | 40 | 7 | NF1 | N | AHS | CP | 55 | 2291 | 3566 | −0.36 | 28 | L | L |
| 3 | F | I/II | L | 43 | 15 | 9 | CHI | N | MDG | CP | <25 | 2572 | 2690 | −0.04 | <12 | ND | L |
| 4 | M | I/II | L | 32 | 28 | 9 | kernicterus | Y | AHS | CP | 100 | 2230 | 2922 | −0.24 | 22 | L | ND |
| 5 | F | I/II | L | 47 | 5 | 2 | unknown | N | CA | CP | 47 | 2075 | 1962 | 0.06 | 22 | L | R |
| 6 | F | I/II | R | 39 | 13 | 5 | unknown | N | — | CP/SG | 68 | 2769 | 2974 | −0.07 | 5 | R | ND |
| 7 | F | I/II | R | 45 | 29 | 3 | unknown | N | CA | CP/SG | 97 | 2737 | 2979 | −0.08 | 14 | R | R |
| 8 | F | I/II | R | 31 | 8 | 4 | CHI(16y);FH | N | gliosis | SP/CP | 60 | 2433 | 3014 | −0.19 | −6 | R | R |
| 9 | F | I/II | L | 50 | 38 | 11 | FS | Y | AHS | SP/CP/SG | 25 | 1646 | 2193 | −0.25 | 36 | L | L |
| 10 | F | I/II | R | 40 | 18 | 11 | CHI(17y,21y) | N | CA | CP/SG | <40 | 1339 | 1882 | −0.29 | <16 | ND | ND |
| 11 | F | I/II | R | 66 | 16 | 11 | RFmgioma(40y) | N | gliosis;CA | SP/CP | <74 | 2656 | 2853 | −0.07 | 35 | R | R |
| 12 | M | I/II | L | 21 | 5 | 12 | CHI | Y | — | CP | <113 | 2169 | 2839 | −0.24 | <26 | R | L |
| 13 | F | I/II | L | 42 | 38 | 10 | FH, FS(2y) | Y | gliosis | CP | 157 | 1618 | 2711 | −0.40 | <38 | R | L |
| 14 | F | I/II | L | 46 | 45 | 2 | FH | Y | CA, AHS | CP/SG | 78 | 1252 | 1655 | −0.24 | 46 | L | L |
| 15 | M | I/II | L | 63 | 31 | 4 | men(18m) | Y | — | SP/CP/SG | 38 | 1832 | 1465 | 0.25 | 18 | L | ND |
| 16 | M | I/II | L | 38 | 33 | 3 | men(8m) | Y | CA, AHS | CP | 92 | 1189 | 2585 | −0.54 | 35 | L | L |
| 17 | M | I/II | L | 27 | 10 | 10 | CHI | N | gliosis | SP/CP | 54 | 1521 | 2329 | −0.35 | 11 | L | L |
| 18 | M | I | L | 31 | 18 | 5 | men(6m);CHI(1y) | Y | AHS | CP/SG | 79 | 1514 | 2565 | −0.41 | 19 | L | L |
| 19 | F | I | L | 57 | 34 | 5 | birth trauma | Y | AHS | CP/SG | 75 | 2146 | 3088 | −0.31 | 56 | L | ND |
| 20 | M | I | R | 33 | 22 | 4 | CHI | Y | AHS/MDG | SP/CP | 59 | 2808 | 3072 | −0.09 | 13 | R | R |
| 21 | M | I | L | 53 | 16 | 8 | CHI;FH | Y | AHS | CP | 62 | 2470 | 3440 | −0.28 | −30 | L | L |
| 22 | F | I | R | 34 | 24 | 9 | FS;CHI | Y | CA | SP/CP/SG | 49 | 2855 | 1386 | 1.06 | <29 | R | ND |
| 23 | M | I | L | 47 | 48 | 10 | unknown | Y | AHS | CP/SG | 48 | 1863 | 2795 | −0.33 | 5 | ND | L |
| 24 | M | I | L | 19 | 18 | 5 | FCD | N | FCD | CP | 69 | 5282 | 3417 | 0.55 | 44 | ND | L |
| 25 | F | I | R | 32 | 20 | 9 | FS | Y | AHS | SP/CP | <91 | 2267 | 1763 | 0.29 | 30 | ND | R |
| 26 | M | I | R | 26 | 21 | 7 | PNI | Y | AHS | SP/CP/SG | 99 | 2940 | 2053 | 0.43 | 47 | ND | R |
| 27 | F | I | L | 56 | 42 | 9 | unknown | Y | AHS | CP | 136 | 1880 | 2902 | −0.35 | −23 | ND | L |
| 28 | F | I | R | 45 | 34 | 8 | FS | Y | AHS | SP/CP | 118 | 2444 | 2142 | 0.14 | 47 | ND | R |
| 29 | M | I | L | 24 | 21 | 9 | prematurity | Y | — | CP/SG | <67 | 2232 | 2640 | −0.15 | 22 | L | L |
| 30 | F | I | L | 48 | 44 | 8 | unknown | Y | AHS | CP | 123 | 831 | 1593 | −0.48 | 24 | ND | L |
| 31 | F | I | R | 50 | 23 | 9 | CHI | Y | — | SP/CP/SG | 126 | 2859 | 1859 | 0.54 | 22 | ND | R |
| 32 | M | I | L | 61 | 59 | 3 | FS | Y | AHS | CP/SG | 62 | 1156 | 2003 | −0.42 | <28 | L | ND |
| 33 | M | I | R | 28 | 8 | 4 | CHI | N | — | CP | 70 | 3002 | 3068 | −0.02 | 26 | ND | R |
| 34 | F | I | L | 52 | 31 | 3 | CHI; fever | Y | AHS | SP/CP | 84 | 1927 | 2676 | −0.28 | 25 | L | L |
| 35 | F | I | L | 48 | 12 | 9 | CHI(34y) | N | AHS | SP/CP/SG | 85 | 1541 | 2537 | −0.39 | 10 | L | L |
| 36 | M | I | L | 30 | 28 | 2 | FS(2y) | Y | CA | CP/SG | 68 | 1361 | 2807 | −0.51 | 27 | L | L |
| 37 | F | I | L | 24 | 18 | 5 | HypBI | Y | CA, AHS | SP/CP | 70 | 1422 | 3042 | −0.53 | −8 | ND | ND |
| 38 | M | I | R | 27 | 12 | 2 | CHI | Y | — | SP/CP/SG | 109 | 2842 | 1924 | 0.48 | 27 | ND | R |
| 39 | F | I | R | 34 | 19 | 8 | unknown | Y | — | SP/CP | <83 | 2080 | 1242 | 0.67 | 21 | ND | ND |
| 40 | F | I | L | 39 | 37 | 1 | FS | Y | — | SP/CP | 172 | 2591 | 3371 | −0.23 | 25 | L | ND |
| 41 | M | I | L | 29 | 27 | 1 | unknown | Y | FCD | SP/CP/SG | 120 | 1969 | 3408 | −0.42 | 3 | R | L |
| 42 | F | I | L | 44 | 39 | 1 | unknown | Y | AHS | SP/CP/SG | 392 | 1641 | 3146 | −0.48 | 22 | L | L |
| 43 | F | I | R | 48 | 47 | 2 | FS,CP | Y | gliosis, FCD | SP/CP/SG | 11 | 1492 | 848 | 0.76 | 19 | R | R |
| 44 | M | I | R | 49 | 28 | 2 | unknown | Y | CA, AHS | SP/CP | 85 | 2804 | 1955 | 0.43 | 41 | R | R |
| 45 | F | I | L | 38 | 3 | 3 | lbg(18m),CHI(22y) | N | — | CP | 53 | 3079 | 3443 | −0.11 | 21 | L | ND |
| 46 | F | I | L | 38 | 18 | 1 | men(1.5y) | Y | AHS | CP | 1242 | 1774 | 3003 | −0.41 | 39 | L | ND |
Control subjects were neurologically intact, nonepileptic individuals without overt lesional pathology on imaging. Two groups of subjects were made available from the following sources:
Group 1
Six healthy subjects (2 males, 4 females; age range 25–38, mean±SD = 30±5) with Technetium-99m (99mTc) ethylcisteinate dimer (ECD) SPECT scans obtained from the Department of Biomedical Imaging and Radiological Sciences, National Yang-Ming University, Taipei, Taiwan, R.O.C (Yang et al., 2006). Corresponding MR images were also available for these subjects.
Group 2
Fourteen healthy subjects (6 males, 8 females; age range 24–48, mean 33) with [99mTc]-labeled hexamethyl-propylene amine oxime (HMPAO) SPECT scans obtained from Yale University through http://spect.yale.edu (Chang et al., 2002; McNally et al., 2005). No corresponding MR images were provided for these subjects.
The availability of SPECT imaging of such subjects is limited by safety concerns regarding injection of radioactive tracer. Ideally, as regards this study, control subjects would be both age- and gender-matched with ECD administration and corresponding MR imaging study. Although there are differences in the regional distributions of the ECD and HMPAO (Inoue et al., 2003; Ito et al., 2006; Koyama et al., 1997; Leveille et al., 1992; Oku et al., 1997; Patterson et al., 1997), they remain, for the most part, bilateral and symmetric (Inoue et al., 2003; Patterson et al., 1997). On the other hand, perfusion does change with age, but often does so bilaterally in the absence of lateralizing vascular compromise (Inoue et al., 2003).
Control subjects were used to generate boundary domain in the feature space defined as the region in which there is no sufficient certainty in lateralization. For MR FLAIR signal analysis and volumetry, boundary domains were generated using 25 control subjects in a previous study (Jafari-Khouzani et al., 2010).
2.2 SPECT Imaging
Patients
SPECT images of 26 epileptic patients were acquired with a triple-head Picker gamma camera 3000XP imaging system with high-resolution fan-beam collimators (Picker International, Inc, Cleveland Heights, Ohio) within 2–3 h after the injection of 99mTc-ethylcysteinate diethylester at a dose of 550 MBq. The energy window was set at 140 keV ± 7.5%. Interictal SPECT studies were performed when the patient had no documented seizure activity for at least 24 h. For ictal studies, the radiotracer was injected within 56 s of seizure onset, while the patients were monitored simultaneously by a long-term video-EEG monitoring system. The time of seizure onset and seizure end, the time of radiotracer injection, and the seizure semiology were determined by reviewing long-term video EEG monitoring. Consensus regarding seizure onset time in some cases could not be achieved because of artifact and, hence, seizure duration and injection time could not be exactly stated. In such circumstances, both were agreed upon as less than a given limit in each case (Table 1). Tomography was performed using 120 images at 7.5 s per image in a 360° rotation. Total acquisition time was about 30 min. The images were reconstructed by filtered backprojection and then filtered with a Wiener filter. The images were reconstructed into a 128×128 image matrix with a voxel size of 2.2×2.2×6.1 mm3.
SPECT images of 20 epileptic patients were acquired with a dual-head Siemens e.cam using high-resolution, parallel hole collimators. All other aspects of the acquisition were the same except for the voxel size which was variable from 3.3×3.3×3.3 mm3 to 4.9×4.9×4.9 mm3. The acquired data was then reconstructed using an ordered-subsets, expectation-maximum algorithm that used 8 subsets and 4 iterations. The data was then smoothed using a Gaussian filter with a full-width at half-maximum of 6 mm.
Any difference in the acquisition of data by each of the two cameras was mitigated by the normalization of SPECT intensities prior to the assessment for asymmetry of perfusion in individual structures.
Attenuation was corrected using the method of Chang (Chang, 1979) which assumes a homogeneous attenuation in the body. Moreover, because of the near symmetry of the head, attenuation effects are ostensibly similar in the hippocampi on either side of midline.
Control subjects
For subjects of group 1, two ECD SPECT scans with an interval separation of 2–4 weeks were obtained (Yang et al., 2006). For subjects of group 2, two HMPAO SPECT scans were provided for each subject with an inter-scan interval of at least one day (McNally et al., 2005). Scan-to-scan variability could thus be assessed as a background to the ictal-interictal difference images obtained in patients.
2.3 MR Imaging
Patients
For 29 epilepsy patients, MR images were acquired with a General Electric 1.5 T Signa system (GE Medical Systems, Milwaukee WI). Subjects underwent coronal T1W MR study using a spoiled gradient-echo (SPGR) sequence with TR/TI/TE = 7.6/1.7/500 ms, flip angle = 20°, FOV = 200×200 mm2, matrix size = 256×256, pixel size = 0.781×0.781 mm2, slice thickness = 2.0 mm (voxel size = 0.781×0.781×2.0 mm3), number of slices = 124, bandwidth = 25 kHz, and scanning time of 5.75 min. Coronal FLAIR MR data sets were acquired with TR/TI/TE = 10002/2200/119 ms, flip angle = 90°, FOV = 200×200 mm2, matrix size = 256×256, pixel size = 0.781×0.781 mm2, slice thickness = 3.0 mm (voxel size = 0.781×0.781×3.0 mm3), minimum number of slices = 47, bandwidth = 20.8 kHz, and scanning time of 12 min. For the remaining 17 patients, MR images were acquired with a General Electric 3 T Signa system. These subjects underwent coronal T1W MR study using a SPGR sequence with TR/TE/TI = 10.4/4.5/300 ms, flip angle = 15°, FOV = 200×200 mm2, matrix size = 512×512, pixel size = 0.39×0.39 mm2, and slice thickness = 2.00 mm (voxel size = 0.39×0.39×2.00 mm3). Coronal FLAIR MR data sets were acquired with TR/TI/TE = 9002/2250/124 ms, flip angle = 900, FOV = 200×200 mm2, matrix size = 512×512, pixel size = 0.39×0.39 mm2, slice thickness = 3.0 mm (voxel size = 0.39×0.39×3.0 mm3), and minimum number of slices = 48. When required, translational corrections were made for FLAIR images to correct for head position from slice-to-slice. Most adjustments were made in the dorsoventral direction.
Control subjects
Axial T1W MR images with pixel size = 1.02×1.02 mm2 and slice thickness = 1.5 mm were available for each subject of group 1 (Yang et al., 2006). No MR images were available for subjects of group 2.
2.4 Image Processing
2.4.1 Image coregistration
The ictal and interictal SPECT MR images were coregistered to a corresponding T1W MR image using a rigid registration technique (FLIRT) (Jenkinson and Smith, 2001) based on a correlation ratio (Fig. 1). Likewise, the T1W and FLAIR MR image sets were coregistered. To increase the accuracy of coregistration, non-brain tissues were eliminated using Brain Extraction Tool (BET) (Smith, 2002). This step facilitated the compartmental analysis by allowing the mapping of anatomical information from the T1W MR image to the respective SPECT and FLAIR MR images.
Fig. 1.
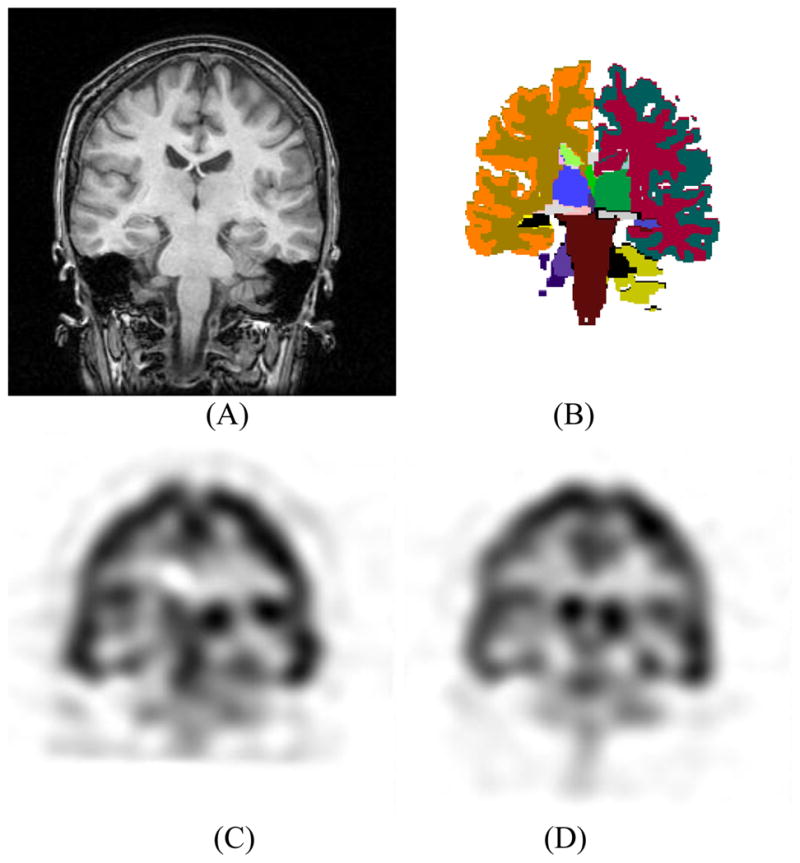
Coregistration of MR and SPECT images. (A) T1W MR coronal image. (B) Color-coded anatomical segmentation using the FreeSurfer software (Fischl et al., 2002). Interictal (C) and ictal (D) SPECT images coregistered to the indicated T1W MR image.
For control subjects, only SPECT signal analysis was performed as MR images were not available for some. Both FLAIR and volumetric MR image analysis of control subjects have been reported elsewhere (Jafari-Khouzani et al., 2010). For each control subject of group 1, both SPECT images were separately coregistered to the corresponding T1W MR image. For group 2 subjects, the SPECT images were coregistered to the SPM5 HMPAO SPECT template (http://www.fil.ion.ucl.ac.uk/spm/) using FLIRT rigid coregistration. The anatomical information of the corresponding SPM T1W template was therefore used for evaluation of the SPECT signal within the desired structures. The coregistration was done first by alignment of the two SPECT scans followed by coregistration of one scan to the template and application of the same transformation to the second scan. Since HMPAO images have more non-brain uptake and retention (Leveille et al., 1992), the non-brain tissues were semi-automatically removed using BET before coregistration.
2.4.2 Segmentation
T1W MR images were used to segment the brain into anatomical structures. The whole brain was segmented into 45 structures using the FreeSurfer software (Fischl et al., 2002), an automatic segmentation tool based on non-rigid coregistration of an atlas to the T1W MR image (Fig. 1). The labels were then visually checked. No significant inaccuracy was observed for the structures of interest. In addition to automatic segmentation, the ROIs encompassing the entire hippocampi were outlined manually for patients. For hippocampal FLAIR and volumetric analysis, accurate manual segmentation is required (Jafari-Khouzani et al., 2011). A single investigator (KJ) outlined all coronal hippocampal contours (usually 20 slices/case) using Eigentool, an in-house software (http://www.radiologyresearch.org/eigentool.htm). These were then verified by another investigator (KE). Manual segmentation increases the accuracy of subsequent FLAIR and volumetric analyses but may not make a significant difference in SPECT signal analysis due to limited spatial resolution. Nevertheless, the manual hippocampal segmentation was used for SPECT analysis in patients. The generated labels using automatic and manual segmentation were mapped to the SPECT and FLAIR MR images using their respective registration parameters allowing both the SPECT and FLAIR intensities to be assessed in segmented structures.
In group 2, concern regarding localization accuracy of anatomical structures with HMPAO SPECT data using a SPECT template led to an experiment to test this. The subcortical structures of group 2 subjects were segmented using the SPM/T1W MR template. The ECD SPECT images of group 1 control subjects were then used to obtain an approximation of how accurately the desired structures could be overlaid. To this end, for each pair of subjects in group 1, one SPECT scan of a single subject was selected and coregistered to another using rigid coregistration. The same transformation was applied to its corresponding T1W MR image with the label volume generated by FreeSurfer. The two label volumes were compared and the similarity of selected structures measured by reporting two segmentation metrics: (i) the Dice coefficient (Dice, 1945) defined as 2|X ∩ Y|/(|X|+ |Y|) where X and Y are the two label sets and |·| represents cardinality. The Dice coefficient varies from 0 to 1 with 1 identifying a perfect overlap of labels; and, (ii) the mean distance, defined as the average distance of every point on the surface of one structure label to the nearest point on the surface of the other structure label. Mean distance shows how close the surfaces of two structures are on average. An average Dice coefficient of 0.63±0.06 (mean±SD), 0.58±0.06, 0.61±0.10 and 0.73±0.11 and a mean distance of 1.01±0.24 mm, 0.99±0.18 mm, 1.6±0.40 mm and 1.83±0.85 mm were calculated for the hippocampus, amygdala, putamen, and thalamus, respectively. Although this accuracy was not perfect, it was acceptable for this study as SPECT imaging has limited spatial resolution. Non-rigid coregistration of the two SPECT images did not significantly improve their overlap and even reduced it for some. Thus, non-rigid coregistration was not applied for the alignment of SPECT images to the SPECT template.
2.4.3 SPECT intensity normalization
Matching of the ictal and interictal intensities requires a model for intensity transformation and a cost function. Ideally, the ictal and interictal intensities within the unaffected areas should become similar after signal matching in order to increase the contrast found in the ictogenic area in the difference image. Using a general 2-parameter linear model, a linear transformation of the intensities of one set of images (i.e., ictal or interictal) is obtained such that the sum of absolute values of the intensity differences (i.e., l1 norm of the difference) of the two images is minimized. Specifically, find a and b such that
is minimized where Iinterictal and Iictal are the SPECT interictal and ictal images, respectively. Using l1 norm of the difference of images, instead of l2 norm or mean ratio, minimizes the intensity difference of the normal (i.e., unaffected) regions of the two images without being affected by the heightened signal intensity in the abnormal regions. This holds when the abnormal region is smaller than the normal region which is commonly the case. The ictal-interictal difference in the normal regions is therefore suppressed while it is pronounced in the abnormal regions. This characteristic of l1 norm may be better shown by a 1D example. Fig. 2 illustrates the outcome of matching two 1D signals using three different techniques: (i) mean ratios, (ii) l2 norm and (iii) l1 norm. The two signals are generated using sinusoidal functions and have a similar trend of variation in all regions except one which resembles the region of hyperintensity in the ictal study and hypointensity in the interictal study. The l1 norm results in the best signal match.
Fig. 2.

Outcome of matching two one-dimensional signals with similar shapes. (A) The signal shapes differ in a small region resembling a site of hyperperfusion on ictal SPECT study and hypoperfusion on interictal study. The results of signal matching are shown using three techniques: mean ratio (B), l2 norm (C) and l1 norm (D).
The above formulation is for a 2-parameter model with scaling factor a and an additive constant b. In practice, the additive constant is not required for SPECT images (Perault et al., 2002). Also a approximates the ratio of the mean intensities when the abnormal zone is small. However, for special cases where the abnormal zone is not small, the proposed method is less affected and provides more relevant results. It can be shown that E is a convex function (Boyd, 2004) and thus can be minimized by iterative algorithms. For simplicity, in a 1-parameter model in which b = 0, the whole brain SPECT ictal/interictal mean ratio is used to generate an initial value for a and a steepest descent algorithm is used to minimize the cost function. The background voxels are removed using the label volumes to quicken the minimization. The SPECT difference is then normalized to the whole brain interictal mean value.
2.4.4 SPECT analysis
Using the generated labels, the mean intensity of the normalized SPECT ictal-interictal difference was calculated for selected subcortical structures including the hippocampus, amygdala, putamen and thalamus. For each structure, the right-left SPECT mean value difference was thresholded at 0 for lateralization which is equivalent to the application of a linear classifier with a single feature. In cases where small SPECT right-left differences were noted, the certainty of lateralization was diminished. A linear boundary domain was therefore specified by measuring the range of variation for control subjects. Cases falling within the boundary domain were considered less reliable. Accuracies were calculated with and without consideration of the boundary domain.
2.4.5 Hippocampal FLAIR analysis
Increased hippocampal signal intensity in FLAIR images is a criterion for MTS (Jack et al., 1994; Jack et al., 1996). FLAIR signal may be quantitatively analyzed by measuring the mean and standard deviation within each hippocampus (Jafari-Khouzani et al., 2010). The ratios of the features (right/left) were then generated for the entire hippocampus rather than the hippocampal body alone. A linear classifier (i.e., discriminator line) and its boundary domain were generated from FLAIR features of a cohort of 25 nonepileptic control subjects in a previous study (Jafari-Khouzani et al., 2010). The boundary domain contained a cluster of all control subjects with a decision boundary line passing through its middle. Accuracies were calculated with and without consideration of the boundary domain.
2.4.6 Hippocampal volumetry
Hippocampal volume reduction correlates favorably with the side of mTLE (Cendes et al., 1993). The volumes of both left and right hippocampi were established from manually drawn ROIs and then normalized to (i.e., divided by) the intracranial volume measured using BET. The accuracy of FreeSurfer was judged inferior to manual segmentation in reliably measuring hippocampal volume (Akhondi-Asl et al., 2011). The right-left hippocampal volume difference was used along with thresholding (linear classifier) for lateralization. Similar to FLAIR analysis, a boundary domain was generated using the hippocampal volumes of a cohort of 25 nonepileptic control subjects in a previous study (Jafari-Khouzani et al., 2010). The threshold of the decision boundary was equivalent to the bias of the right-left hippocampal volume difference and calculated as the average of the right-left hippocampal volume difference in control subjects.
RESULTS
3.1 Patients
The mean duration of epilepsy was 25 years (median 18 years; range 3 – 59 years) (Table 1). Risk factors were established in all but ten patients with the proviso that the strength of the causation may be variable from case-to-case. Early childhood febrile seizures were definitively reported in nine cases and moderate to severe closed head injury with a loss of consciousness exceeding 30 minutes in duration (Annegers et al., 1998) in 16 cases with a single case of overlap of the two factors. An infectious etiology was raised in four cases and a family history of epilepsy was noted in five cases. Hippocampal pathology was not available in ten cases and in six cases, gliosis was identified in the temporopolar and hippocampal tissues. There appeared to be no distinctive clinicopathological correlation between risk factor and histopathology.
The largest etiological grouping, that of closed head injury, was found to manifest an Ammon’s horn sclerosis (AHS) in only 31% of cases. Ammon’s horn sclerosis of varying severity and characterized by pyramidal and/or dentate granule cell dropout, gliosis and, in most cases, corpora amylacea was found in 22 cases. Magnetic resonance imaging identified 32 cases of MTS in which AHS was confirmed in 20, although in seven cases, no histopathology was available. All nine cases having early febrile seizures were shown to have MTS although only four were shown to have AHS with a single case not pathologically confirmed. Each was correctly lateralized by either interictal (6 cases) or ictal (6 cases) SPECT study with only three cases (9, 36, 43) correctly lateralized by both. Eight (50%) of the 16 cases of closed head injury had MTS. Of these, four cases (18, 20, 21, 34) showed both corroborating ictal and interictal SPECT features. Interictal SPECT established correct lateralization in 13 (81%) of these cases, whereas, ictal SPECT provided the same in 10 cases (62%).
3.2 SPECT Analysis
Separate analysis of ictal SPECT studies using the qualitative method showed that, in 30% of cases, results were nondiagnostic leaving only 63% of cases as correctly localizing. With the hippocampus manually segmented, the quantitative method yielded a 80% correct localization (Fig. 3). Similar comparisons on interictal SPECT studies identified 26% of studies to be nondiagnostic and 72% correctly localizing using the qualitative approach. Quantitative hippocampal segmentation yielded a 70% localization accuracy (Fig. 3). No boundary domain was considered in the above two quantitative analyses.
Fig. 3.

Scatter plots of left and right hippocampal mean values of SPECT ictal (A) and interictal (B) signal intensity. Cases are distinguished by the symbols, ‘R’ and ‘L’, respectively, corresponding to individual cases in which the right or left hippocampus was judged to be epileptogenic according to Engel class Ia postoperative outcomes. The symbols ‘o’ and ‘x’ represent ECD and HMPAO control subjects, respectively. The ictal scatter plot (A) has been scaled to clearly show the difference between left-sided and right-sided subjects. This scaling resulted in elimination of six subjects (4L, 2R) from the graph. These subjects were correctly classified using the illustrated boundary line.
The scatter plots of hippocampal SPECT features in the subtraction images are presented in Fig. 4. The y = x line is the boundary line with the threshold of the SPECT right-left difference set at zero for lateralization purposes. The boundary domain specified by the two parallel lines encompasses the ECD nonepileptic control subjects. The nonepileptic cases are clustered around the origin. Nonepileptic control subjects from Group 1 (ECD injection) occupy a smaller cluster compared with those of Group 2 (HMPAO injection). This may be attributable to a relative inaccuracy of hippocampal localization in HMPAO images. There is no clear distinction between the patients who required extraoperative ECoG and those who did not (Fig. 4). Several patients who required extraoperative ECoG are far from the boundary domain indicating that other factors confounded the final interpretation of the several studies and negated the impact of SPECT imaging alone. Misclassified subjects are found, as might be expected, near the boundary domain where the findings may be interpreted as less definitive. There is no clear distinction between patients with and without MTS on the hippocampal SPECT scatter plot (Fig. 4). In particular, the presence of MTS did not tend towards either a hypo- or hyperperfused state.
Fig. 4.

Scatter plots of left and right hippocampal mean values of SPECT ictal-interictal difference. (A) Cases are distinguished by the symbols, ‘R’ and ‘L’, respectively, corresponding to individual cases in which the right or left hippocampus was judged to be epileptogenic according to Engel class Ia postoperative outcomes. The symbols ‘o’ and ‘x’ represent ECD and HMPAO control subjects, respectively. (B) Cases are distinguished according to whether they required solely scalp electroencephalographic application to distinguish laterality (‘1’) or further extraoperative ECoG (‘2’). (C) Cases are distinguished by the symbols, ‘Y’ and ‘N’, respectively, according to whether medial temporal sclerosis (MTS) was appreciated by qualitative assessment of MR images with those identified as MTS labeled ‘Y’ and the others, ‘N’. (D) Cases are identified by their numerical assignment for cross-referencing of clinical profiles (see Table 1).
The right and left compartmental SPECT mean values for the ictal-interictal difference image were calculated as described for the hippocampus, amygdala, putamen and thalamus. The right–left SPECT mean value difference was then used for lateralization by a simple thresholding at zero. Table 2 summarizes the lateralization accuracy using each of the SPECT features. Hippocampal SPECT analysis yielded the highest lateralization accuracy (91%) followed by the amygdala (87%), putamen (67%), and thalamus (61%). In the presence of a boundary domain these values were reduced to 89%, 78%, 35% and 50%, respectively.
Table 2.
Comparative classification accuracies using the introduced feature sets reported and the employed number of features.
| No. | Feature set | Number of features | Range for patients (Mean±SD) | Accuracy (percentage) respectively with and, in brackets, without considering the boundary domain |
|---|---|---|---|---|
| 1 | Hippocampal FLAIR mean value ratio | 1 | 0.98±0.05 | 50 (78) |
| 2 | Hippocampal FLAIR standard deviation ratio | 1 | 0.97±0.25 | 59 (83) |
| 3 | Hippocampal FLAIR mean and standard deviation ratios | 2 | — | 74 (89) |
| 4 | Hippocampal volume (right/left) | 1 | 1.26±0.45 | 70 (78) |
| 5 | Hippocampal normalized SPECT ictal-interictal difference | 1 | −0.05±0.17 | 89 (91) |
| 6 | Amygdala normalized SPECT ictal-interictal difference | 1 | −0.03±0.22 | 78 (87) |
| 7 | Putamen normalized SPECT ictal-interictal difference | 1 | 0.002±0.13 | 35 (67) |
| 8 | Thalamus normalized SPECT ictal-interictal difference | 1 | −0.005±0.09 | 50 (61) |
| 9 | Combination of feature sets 3, 4, and 5, with voting method | 4 | — | 76 (89) |
When considering the hippocampal SPECT ictal-interictal difference in the presence of a boundary domain, several cases were identified along the boundary lines but only a single case (27) was found within the domain (Fig. 4). Twenty cases were identified with secondary generalization as part of their semiology. Only six cases (10, 19, 29, 31, 32, 38) in this cohort were found alongside the boundary domain with the remainder well lateralized despite the tendency for propagation of the ictal pattern.
Of the 17 cases requiring extraoperative ECoG, five (29%) harbored a histologically sclerotic hippocampus whereas preoperative imaging declared an MTS in seven cases (41%) with four showing an overlap of these attributes. Of the 14 cases without MTS, only two (14%) were found to be insufficiently lateralizing by the quantitative SPECT approach as they appeared on the edge of the boundary domain (Fig. 4). Moreover, 10 (70%) of the 14 cases required extraoperative ECoG prior to resective surgery including the two latter cases.
Hippocampal subtraction ictal SPECT values varied by side with respect to control subjects and between lateralized study cohorts (ANOVA; F(2,63) = 47; p < 3×10⁻¹³). Compared to control subjects, cases of left-sided and right-sided mTLE were found to have differences of −0.15 and 0.11 with 95% confidence intervals of [−0.21 to −0.09] and [0.04 to 0.19], respectively, and between the left- and right-sided cohorts, difference of −0.26 with a 95% confidence interval of [−0.33 to −0.20] was obtained.
Comparative qualitative assessment of ictal and interictal SPECT images resulted in an 85% lateralization accuracy. This assessment was considered correct if both ictal and interictal images correctly lateralized or if one of the two images correctly lateralized and the other was nondiagnostic. Although qualitative assessment accuracy is expected to be lower than that of automated hippocampal SPECT analysis in most cases, this was not always confirmed in the current study (Fig. 5). Three cases (5, 39, 41) incorrectly lateralized by qualitative analysis were correctly lateralized using the automated approach and, moreover, were located outside the boundary domain. Two cases (10, 12) were incorrectly lateralized by both methods. Two other cases (31, 38), misclassified by the automated approach were correctly lateralized by qualitative assessment of the interictal SPECT despite ictal SPECT showing no hyperperfusion in either case.
Fig. 5.
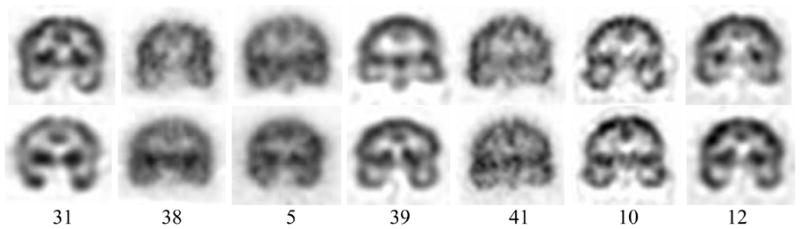
Representative ictal (first row) and interictal (second row) SPECT images of cases misclassified by quantitative (31, 38), qualitative (5, 39, 41) and by both (10, 12) approaches, respectively. Cases are identified by number in each column.
Those patients requiring extraoperative ECoG in order to definitively lateralize the site of temporal lobe epileptogenicity were segregated as a separate cohort in order to establish whether the same analysis might specifically address a population in which conventional noninvasive investigation has failed to establish laterality. Of these 17 cases, 11 were judged to have overt features of MTS or a distinct volumetric asymmetry (Table 1). Eight cases (1, 3, 5, 6, 7, 14, 15, 17) were identified as showing sufficient separation from the discriminator line to be considered definitively lateralizing (Fig. 4). Of these, six cases lacked MR imaging evidence of MTS.
3.3 FLAIR Analysis
The ratios (right/left) of hippocampal FLAIR mean and standard deviation were calculated as previously described (Jafari-Khouzani et al., 2010) (Fig. 6) using the entire hippocampus. The lateralization accuracy of FLAIR signal analysis was 89%, lower than a previous estimate of 97% (Jafari-Khouzani et al., 2010) when only the hippocampal body was considered in the analysis. Considering the boundary domain, accuracy is reduced to 74%, close to a previous estimate of 75%. Approximately half of the patients who required extraoperative ECoG are clustered at unity on the scatter plot (Fig. 6). All misclassified cases had undergone extraoperative ECoG. The same was true for patients who did not have MTS (Fig. 6). No significant correlation was evident between hippocampal FLAIR mean and standard deviation ratios and hippocampal SPECT ictal-interictal difference (r = 0.50, p < 10−60 and r = 0.52, p < 10−30, respectively) suggesting that the two modalities bear complementary information.
Fig. 6.

Scatter plots of the mean and standard deviation ratios (right/left) of hippocampal FLAIR MR signal intensity. (A) The symbols, ‘R’ and ‘L’, respectively, correspond to the right and left surgery sides. (B) Cases are distinguished according to their requirement for extraoperative ECoG (i.e., ‘1’ indicating those cases proceeding to surgery without such study and ‘2’, those cases requiring it). (C) Cases are distinguished by the symbols, ‘Y’ and ‘N’, respectively, according to whether medial temporal sclerosis (MTS) was appreciated by qualitative assessment of MR images with those identified as MTS labeled ‘Y’ and the others, ‘N’. (D) Cases are identified by their numerical assignment for cross-referencing of clinical profiles (see Table 1).
3.4 Volume Analysis
Hippocampal volumes were calculated for all patients and normalized to the intracranial volume (Fig. 7). Accuracy by outcome classification using this measure (i.e., the right/left hippocampal volume ratio, also specified in Fig. 7 by the y=x+b discriminator line where b corrects the bias) was found to be 78%. Considering the boundary domain, accuracy was reduced to 70%. One patient (case 24) with a left-sided mTLE was found to have a larger hippocampus ipsilaterally but did not undergo extraoperative ECoG. Two cases (2, 16) still required invasive study despite harboring a smaller hippocampal volume on the epileptogenic side as a result of other ambiguities arising in their preliminary investigation. A number of misclassified cases were not found near the discriminator line, in contrast to that found with both selective hippocampal SPECT and FLAIR MR signal analyses.
Fig. 7.

Scatter plots of normalized hippocampal volumes (HVs). (A) The symbols, ‘R’ and ‘L’, respectively, correspond to the right and left surgery sides. (B) Patients proceeding to resection without the need for extraoperative ECoG (‘1’) and those who required intracranial study prior to resection (‘2’) are identified. (C) Cases are distinguished by the symbols, ‘Y’ and ‘N’, respectively, according to whether medial temporal sclerosis (MTS) was appreciated by qualitative assessment of MR images with those identified as MTS labeled ‘Y’ and the others, ‘N’. (D) Cases are identified by their numerical assignment for cross-referencing of clinical profiles (see Table 1).
Approximately half of the patients who required extraoperative ECoG are clustered around the y = x+b discriminator line (Fig. 7). This is also the case for patients who did not show MTS (Fig. 7). Hippocampal volume ratios did not correlate significantly with selective hippocampal SPECT differences (r = 0.49, p = 0.57) and hippocampal FLAIR mean ratio (r = −0.58, p < 10−4). However, some correlation was apparent with the hippocampal FLAIR standard deviation ratio (r=−0.80, p < 10−11). A single case (10) was incorrectly lateralized by all three sets of features (i.e., SPECT, FLAIR MR, and volume). This particular case appeared near the discriminator line in all the feature spaces (Figs. 4D, 6D, 7D).
Table 2 summarizes the results of applying each of the above three feature sets to the study population as a whole. The negative mean value for the majority of SPECT features may be caused by a higher number of left-sided cases (16 R, 30 L). With 61% accuracy, the thalamic SPECT difference was not helpful as has been previously reported (Sojkova et al., 2003). Of the sets examined, the selective hippocampal SPECT ictal-interictal difference and combination of FLAIR mean and standard deviation proved to be most closely in agreement with the presence of left- or right-sided epileptogenicity.
3.5 Combination of Features
Comparison of Figs. 4, 6, and 7 reveals that in all cases, except five (5, 6, 7, 8, 10), focal epileptogenicity was correctly lateralized by at least two feature sets out of the three studied. Thus, the use of all three classifiers and a voting scheme, i.e., lateralization based on the agreement of the majority of classifiers, results in an 89% lateralization accuracy which is lower than the maximum accuracy obtained with the individual feature sets. In the presence of the boundary domain, lateralization accuracy is reduced to 76%, a figure not significantly higher than that obtained with individual feature sets.
DISCUSSION
The study of mTLE may raise contradictory features that confound adequate lateralization. Despite the supremacy of both EEG and MR imaging there is need for inclusion of other studies to better lateralize a putative single epileptogenic focus. To investigate further the potential impact of SPECT upon surgical decision-making, this study examined the lateralization accuracy in cases of mTLE with established Engel class Ia outcomes using an automated method of compartmental subtraction ictal SPECT analysis. Comparison was made with MR imaging applications, specifically, FLAIR MR signal analysis (i.e., mean and standard deviation) and volumetry in the same population. A notable lateralization accuracy was achieved with hippocampal subtraction ictal SPECT (91%), slightly higher than that found with FLAIR MR signal analysis in this study. Of particular importance in this study has been the finding that 80% of cases with a nonlateralizing (i.e., nonMTS) MR imaging appearance and which required extraoperative ECoG were correctly lateralized by the quantitative SPECT approach. Each of these cases was situated well outside the boundary domain in the scatter plot display.
Independent analysis of both ictal and interictal SPECT studies was performed to compare qualitative results indicating which temporal lobe was epileptogenic. In the ictal case, the qualitative method yielded a 63% localization accuracy with a high nondiagnostic yield (30%). The quantitative approach, using a more restrictive hippocampal segmentation, yielded a 80% localization accuracy. Several cases were situated immediately adjacent to the discriminator line indicating that the difference in comparative left-right signal intensities was too subtle for definitive lateralization by the qualitative approach. Moreover, the more restricted analysis of the immediate epileptogenic volume afforded by the segmentation approach allows perhaps a clearer separation of left and right signal intensities.
Comparison of interictal SPECT studies identified a 72% localization accuracy using the qualitative approach, higher than that achieved with ictal SPECT study. This may indicate that, in the latter situation, perfusion may have normalized during ictogenesis rendering the left-right comparison nondiagnostic. A nondiagnostic yield of 26% was obtained, again perhaps reflecting an inability to distinguish perfusion differences in limited areas such as the hippocampus. Quantitative segmented hippocampal analysis yielded a 70% localization accuracy which was comparable but less than with qualitative analysis. Although it may be argued that perfusion normalization during ictogenesis may be responsible for a lower diagnostic yield, this was not supported by quantitative analysis.
No significant correlation was apparent between the measurements obtained with hippocampal subtraction ictal SPECT study and those with either FLAIR MR signal analysis or volumetry. It is, therefore, arguable that such studies, applied in concert, could provide complementary information that might serve to discount or support a decision to proceed with further invasive study or to proceed with resection (Tan et al., 2008). Despite the lack of such correlation, the combination of features did not result in higher lateralization accuracy compared with individual features. The combination of uncorrelated features does not necessarily result in higher classification accuracy as the labels (i.e., side of surgery) are not taken into account for calculation of the correlation coefficient.
Accuracy of tracer concentration measurement with SPECT imaging is limited by the partial volume effect (PVE) caused by low spatial resolution (Jaszczak et al., 1981). The tracer concentration may be underestimated in small structures such as an atrophic hippocampus. Nevertheless, this problem may be alleviated after subtraction of ictal and interictal images. For bilateral atrophic hippocampi, signal asymmetry may not be significantly affected despite signal underestimation. Some studies have reported improvements in SPECT analysis after applying a PVE correction (Kanetaka et al., 2004; Kato et al., 2008). It is not clear to what extent this problem has affected the current analysis.
Other factors may affect the accuracy of compartmental quantitative SPECT measurements. These include the precision of image coregistration, signal normalization, MR image segmentation, injection time latency, seizure duration, pattern of electrographic propagation, and the actual semiology of ictal behavior (Knowlton et al., 2004). Image attenuation could affect the reliability of the compartmental method and was addressed in this study. The near symmetry of the head mitigates this effect even in circumstances where an inhomogeneous attenuation may exist. Several studies have addressed coregistration techniques and their validation for SPECT-MR image and SPECT-SPECT alignment (Barnden et al., 2000; Brinkmann et al., 1999; Grova et al., 2001; Grova et al., 2003; Grova et al., 2004; Hutton et al., 2002; Yokoi et al., 2004). The well-known similarity measurements, namely, mutual information, normalized mutual information, and correlation ratio perform equally for intrasubject SPECT-MR image coregistration (Grova et al., 2001). The current study employed the correlation ratio with separate coregistration of ictal and interictal SPECT images with MR images. Alternatively, ictal-interictal SPECT coregistration could have preceded interictal SPECT-MR image coregistration (Avery et al., 2000; Zubal et al., 1995).
Injection latency relative to electrographic or clinical ictal onset must be minimized to restrict the volume of hyperperfusion to the immediate ictogenic zone and, at the same time, limit the network effect elicited by propagation of electrochemical activity (Cross et al., 1995; Lee et al., 2006; Zubal et al., 1999). An injection delay of under 20 seconds after ictal onset provides SPECT imaging that correlates significantly with correct localization in neocortical epilepsy (Lee et al., 2006). Postictal SPECT analysis has also been shown to be useful for lateralization purposes (Rowe et al., 1991). In the current study, injection latencies exceeded 20 seconds in some cases although the mean value was 21 ± 18 seconds (mean ± SD). In those cases with longer latencies, other structures such as the putamen and thalamus may have been activated providing further confirmation of lateralization while perhaps diminishing focality.
Four cases (10, 12, 31, 38) in our study were misclassified using the quantitative approach. All had suffered a closed head injury and all but one (10) were found to have MTS on MR imaging. Their graphic representation indicated a location immediately adjacent to the boundary domain suggesting that the intensity feature was not striking. Two of the cases (10, 12) which had also been qualitatively misclassified were found in the boundary domain of the FLAIR study. The remaining two cases (31, 38) were falsely lateralized by quantitative measures. Interictal SPECT study had correctly lateralized the site of epileptogenicity although the ictal SPECT itself showed no lateralized hyperperfusion. Quantitative study in both cases had established each on the edge of the boundary domain and, therefore, neither case was considered definitive.
An alternative approach for the analysis of SPECT images involves Statistical Parametric Mapping (SPM) (Friston et al., 1994) in which a voxel-by-voxel analysis is performed (Chang et al., 2002; Knowlton et al., 2004; Lee et al., 2000b; Lee et al., 2005; McNally et al., 2005; Patterson et al., 1997; Yang et al., 2006). All SPECT images are first coregistered to single SPECT template. Voxel clusters showing a significant change compared to that of the normal state are identified by statistical analysis. The normal state is estimated from SPECT images obtained in nonepileptic, neurologically intact subjects. Coregistration inaccuracies arise in the absence of MR imaging and may preclude a precise estimate of perfusion in restricted subcortical compartments, particularly an atrophic hippocampus, or in highly convoluted regions such as the deep perisylvian area or the insula itself. The current analysis of compartmental SPECT signal intensity asymmetries is better served by MR image coregistration because of the required anatomical precision afforded by the latter.
Intensity normalization is an important issue in the analysis of SPECT ictal-interictal subtraction images. The mean intensity of the whole brain is often used for normalization (O’Brien et al., 1998; Zubal et al., 1995); however, use of the whole brain mean value has been disputed (Boussion et al., 2000) as the volume of hyperperfusion on ictal SPECT study is likely to be dependent upon the latency of injection and pathological variation of blood flow. Use of reference sites least affected by ictal perfusion have been suggested (Boussion et al., 2000; Lewis et al., 2000). However, locating an unaffected region is not trivial. We proposed an l1 norm minimization technique which is not sensitive to the mean intensity variations caused by the regional hypo- or hyper-perfusion and does not require any reference site
The primary intent of a compartmental SPECT analysis is that of lateralization rather than the exact localization of ictal onset zone as it evaluates signal intensity asymmetries within bilateral structures. Similar asymmetry analyses in other studies have been structure-based (Hogan et al., 1997), voxel-based (Aubert-Broche et al., 2003) or VOI-based (Aubert-Broche et al., 2005). Apart from anatomical precision in the structure-based approach, there is little to recommend one over the other. There remains the matter of improved lateralization with the use of subtraction ictal imaging rather than strictly periictal studies. Judgment here is confounded by the lack of sufficient patient numbers or insufficient clinical verification of the ictogenic zone. Hogan et al (’97) used Tc-HMPAO SPECT to assess periictal hyperperfusion in 10 patients, eight of whom had pathologically confirmed Ammon’s horn sclerosis and EEG lateralization in eight patients (Hogan et al., 1997). Engel class I postoperative outcomes were achieved in eight operated cases. Of the 10 cases, six showed a hippocampal hyperperfusion. In an earlier study, Newton et al (’95) (Newton et al., 1995) identified correct lateralization of the putative epileptogenic temporal lobe in 97% of case with hyperperfusion found diffusely throughout the temporal lobe. No mention was made of postoperative outcome or pathology and the Tc-HMPAO injections varied within the time of the ictus up to 30 seconds following its electrographic cessation. Moreover, HMPAO tends to underestimate large blood flow measures hampering the expression of subtracted SPECT images and resulting in poorly displayed ictal onset zones (Rossman et al., 2006).
The present study employed ECD which has the advantage of high radiochemical stability and rapid washout from extracerebral tissues (Grunwald et al., 1994). In addition to six ECD SPECT images of nonepileptic subjects, HMPAO SPECT images were used in a group of 14 other nonepileptic subjects for comparison. As the latter group did not have MR imaging performed, an SPM HMPAO SPECT template was used for analysis. A more reliable method would be to use ECD SPECT images of age- and gender-matched control subjects to account for respective variations of cerebral blood flow. This, however, would require dual SPECT scans for each control subject. Addition of more ECD subjects could possibly widen the boundary domain and result in a lower accuracy when imposed.
Fluorodeoxyglucose positron emission tomography (PET) may, alternatively, be used for lateralization in cases of TLE in certain centers (Gambhir et al., 2001). This imaging assesses metabolism interictally, whereas, SPECT imaging examines perfusion both interictally and periictally. Assessment of serotonin (HT1A) receptor binding by PET also has identified reduced uptake in the temporal lobe of patients with TLE (Didelot et al., 2008; Toczek et al., 2003) even in the absence of pathological changes including neuronal loss (Merlet et al., 2004). Both PET and SPECT imaging appear to have comparable lateralization accuracy (Hwang et al., 2001; Kim et al., 2009; Lee et al., 2005; Won et al., 1999).
A multicompartmental analysis of subtraction SPECT imaging is supported by a number of studies that have identified a cerebrocortical and subcortical network of perfusion changes associated with an ictal event of mesial temporal lobe origin (Blumenfeld et al., 2004; Grova et al., 2005; Kaiboriboon et al., 2005; Shin et al., 2001; Van Paesschen et al., 2003). Alternatively, the application of this approach may be of considerable benefit for the study of neocortical epilepsy. Current findings indicate a clear predominance of ictal hyperperfusion of the primary ictogenic zone with a marked drop in lateralization value of other subcortical structures such as the putamen and thalamus. In fact, hippocampal hyperperfusion compares favorably with that of FLAIR mean signal and standard deviation measures in identifying the laterality of mTLE in this study. This study addressed only SPECT perfusion analysis in cases of Engel class Ia outcomes. In cases of bilateral mTLE, this approach may mislead the investigation by yielding distinctly unilateral ictal features. Conversely, because of its high lateralization accuracy for a given ictal event, it may provide sufficient contradictory evidence in the body of the entire investigation to warrant further study of a particular case. Hence, a prospective study is required to properly assess its place in the investigational scheme. Moreover, an analysis of SPECT imaging findings in cases of known poor postoperative outcome would also be of value in establishing whether its application may potentially be predictive of such.
Acknowledgments
We would like to thank Christian Libres and Aimee Wielinga for providing ictal SPECT injection time information, Jodie Honsowetz for helping with patient clinical information retrieval, and Beth Harkness for providing SPECT imaging specifications. We would also like to thank Jyh-Cheng Chen and Bang-Hung Yang of the Department of Biomedical Imaging and Radiological Sciences, National Yang-Ming University, Taipei, Taiwan, R.O.C, for providing ECD SPECT images of nonepileptic subjects and Hal Blumenfeld of Yale University for providing HMPAO SPECT images of nonepileptic subjects. This work was supported in part by NIH under grant R01-EB002450.
Footnotes
CONFLICT OF INTEREST
The authors declare that they have no conflict of interest.
Publisher's Disclaimer: This is a PDF file of an unedited manuscript that has been accepted for publication. As a service to our customers we are providing this early version of the manuscript. The manuscript will undergo copyediting, typesetting, and review of the resulting proof before it is published in its final citable form. Please note that during the production process errors may be discovered which could affect the content, and all legal disclaimers that apply to the journal pertain.
References
- Akhondi-Asl A, Jafari-Khouzani K, Elisevich K, Soltanian-Zadeh H. Hippocampal volumetry for lateralization of temporal lobe epilepsy: Automated versus manual methods. Neuroimage. doi: 10.1016/j.neuroimage.2010.03.066. In Press. [DOI] [PMC free article] [PubMed] [Google Scholar]
- Annegers JF, Hauser WA, Coan SP, Rocca WA. A population-based study of seizures after traumatic brain injuries. N Engl J Med. 1998;338:20–24. doi: 10.1056/NEJM199801013380104. [DOI] [PubMed] [Google Scholar]
- Aubert-Broche B, Grova C, Jannin P, Buvat I, Benali H, Gibaud B. Detection of inter-hemispheric asymmetries of brain perfusion in SPECT. Physics in Medicine and Biology. 2003;48:1505–1517. doi: 10.1088/0031-9155/48/11/302. [DOI] [PubMed] [Google Scholar]
- Aubert-Broche B, Jannin P, Biraben A, Bernard AM, Haegelen C, Le Jeune FP, Gibaud B. Evaluation of methods to detect interhemispheric asymmetry on cerebral perfusion SPECT: application to epilepsy. Journal of Nuclear Medicine. 2005;46:707–713. [PubMed] [Google Scholar]
- Avery RA, Zubal IG, Stokking R, Studholme C, Corsi M, Seibyl JP, Spencer SS. Decreased cerebral blood flow during seizures with ictal SPECT injections. Epilepsy Res. 2000;40:53–61. doi: 10.1016/s0920-1211(00)00109-1. [DOI] [PubMed] [Google Scholar]
- Barnden L, Kwiatek R, Lau Y, Hutton B, Thurfjell L, Pile K, Rowe C. Validation of fully automatic brain SPET to MR co-registration. Eur J Nucl Med. 2000;27:147–154. doi: 10.1007/s002590050020. [DOI] [PubMed] [Google Scholar]
- Blumenfeld H, McNally KA, Vanderhill SD, Paige AL, Chung R, Davis K, Norden AD, Stokking R, Studholme C, Novotny EJ, Jr, Zubal IG, Spencer SS. Positive and negative network correlations in temporal lobe epilepsy. Cereb Cortex. 2004;14:892–902. doi: 10.1093/cercor/bhh048. [DOI] [PubMed] [Google Scholar]
- Boussion N, Houzard C, Ostrowsky K, Ryvlin P, Mauguiere F, Cinotti L. Automated detection of local normalization areas for ictal-interictal subtraction brain SPECT. J Nucl Med. 2002;43:1419–1425. [PubMed] [Google Scholar]
- Boussion N, Ryvlin P, Isnard J, Houzard C, Mauguiere F, Cinotti L. Towards an optimal reference region in single-photon emission tomography difference images in epilepsy. Eur J Nucl Med. 2000;27:155–160. doi: 10.1007/s002590050021. [DOI] [PubMed] [Google Scholar]
- Boyd SP. Convex optimization. Cambridge; New York: 2004. [Google Scholar]
- Brinkmann BH, O’Brien TJ, Aharon S, O’Connor MK, Mullan BP, Hanson DP, Robb RA. Quantitative and clinical analysis of SPECT image registration for epilepsy studies. Journal of Nuclear Medicine. 1999;40:1098–1105. [PubMed] [Google Scholar]
- Cendes F, Leproux F, Melanson D, Ethier R, Evans A, Peters T, Andermann F. MRI of amygdala and hippocampus in temporal lobe epilepsy. J Comput Assist Tomogr. 1993;17:206–210. doi: 10.1097/00004728-199303000-00008. [DOI] [PubMed] [Google Scholar]
- Chang DJ, Zubal IG, Gottschalk C, Necochea A, Stokking R, Studholme C, Corsi M, Slawski J, Spencer SS, Blumenfeld H. Comparison of statistical parametric mapping and SPECT difference imaging in patients with temporal lobe epilepsy. Epilepsia. 2002;43:68–74. doi: 10.1046/j.1528-1157.2002.21601.x. [DOI] [PubMed] [Google Scholar]
- Chang L. Attenuation correction and incomplete projection in single photon emission computed tomography. IEEE Transactions on Nuclear Science. 1979;26:2780–2789. [Google Scholar]
- Cross JH, Gordon I, Jackson GD, Boyd SG, Todd-Pokropek A, Anderson PJ, Neville BG. Children with intractable focal epilepsy: ictal and interictal 99TcM HMPAO single photon emission computed tomography. Dev Med Child Neurol. 1995;37:673–681. doi: 10.1111/j.1469-8749.1995.tb15013.x. [DOI] [PubMed] [Google Scholar]
- Dice LR. Measures of the amount of ecologic association between species. Ecology. 1945;26:297–302. [Google Scholar]
- Didelot A, Ryvlin P, Lothe A, Merlet I, Hammers A, Mauguiere F. PET imaging of brain 5-HT1A receptors in the preoperative evaluation of temporal lobe epilepsy. Brain. 2008;131:2751–2764. doi: 10.1093/brain/awn220. [DOI] [PubMed] [Google Scholar]
- Engel JJ. Outcome with respect to epileptic seizures. In: Engel JJ, editor. Surgical Treatment of the Epilepsies. Raven Press; New York: 1987. pp. 553–571. [Google Scholar]
- Fischl B, Salat DH, Busa E, Albert M, Dieterich M, Haselgrove C, van der Kouwe A, Killiany R, Kennedy D, Klaveness S, Montillo A, Makris N, Rosen B, Dale AM. Whole brain segmentation: automated labeling of neuroanatomical structures in the human brain. Neuron. 2002;33:341–355. doi: 10.1016/s0896-6273(02)00569-x. [DOI] [PubMed] [Google Scholar]
- Friston KJ, Holmes AP, Worsley KJ, Poline JP, Frith CD, Frackowiak RSJ. Statistical parametric maps in functional imaging: A general linear approach. Hum Brain Mapp. 1994;2:189–210. [Google Scholar]
- Gambhir SS, Czernin J, Schwimmer J, Silverman DH, Coleman RE, Phelps ME. A tabulated summary of the FDG PET literature. J Nucl Med. 2001;42:1S–93S. [PubMed] [Google Scholar]
- Grova C, Biraben A, Scarabin JM, Jannin P, Buvat I, Benali H, Gibaud B. Lecture Notes in Computer Science (MICCAI01) Springer; Berlin: 2001. A methodology to validate MRI/SPECT registration methods using realistic simulated SPECT data; pp. 275–282. [Google Scholar]
- Grova C, Jannin P, Biraben A, Buvat I, Benali H, Bernard AM, Scarabin JM, Gibaud B. A methodology for generating normal and pathological brain perfusion SPECT images for evaluation of MRI/SPECT fusion methods: application in epilepsy. Phys Med Biol. 2003;48:4023–4043. doi: 10.1088/0031-9155/48/24/003. [DOI] [PubMed] [Google Scholar]
- Grova C, Jannin P, Buvat I, Benali H, Bansard JY, Biraben A, Gibaud B. From anatomic standardization analysis of perfusion SPECT data to perfusion pattern modeling. Academic Radiology. 2005;12:554–565. doi: 10.1016/j.acra.2004.08.014. [DOI] [PMC free article] [PubMed] [Google Scholar]
- Grova C, Jannin P, Buvat I, Benali H, Gibaud B. Evaluation of registration of ictal SPECT/MRI data using statistical similarity methods. Springer-Verlag; Berlin, Germany: 2004. pp. 687–695. [Google Scholar]
- Grunwald F, Menzel C, Pavics L, Bauer J, Hufnagel A, Reichmann K, Sakowski R, Elger CE, Biersack HJ. Ictal and interictal brain SPECT imaging in epilepsy using technetium-99m-ECD. J Nucl Med. 1994;35:1896–1901. [PubMed] [Google Scholar]
- Hogan RE, Cook MJ, Binns DW, Desmond PM, Kilpatrick CJ, Murrie VL, Morris KF. Perfusion patterns in postictal 99mTc-HMPAO SPECT after coregistration with MRI in patients with mesial temporal lobe epilepsy. J Neurol Neurosurg Psychiatry. 1997;63:235–239. doi: 10.1136/jnnp.63.2.235. [DOI] [PMC free article] [PubMed] [Google Scholar]
- Houston AS, Kemp PM, Macleod MA. A method for assessing the significance of abnormalities in HMPO brain SPECT images. J Nucl Med. 1994;35:239–244. [PubMed] [Google Scholar]
- Hutton BF, Braun M, Thurfjell L, Lau DY. Image registration: an essential tool for nuclear medicine. Eur J Nucl Med Mol Imaging. 2002;29:559–577. doi: 10.1007/s00259-001-0700-6. [DOI] [PubMed] [Google Scholar]
- Hwang SI, Kim JH, Park SW, Han MH, Yu IK, Lee SH, Lee DS, Lee SK, Chung CK, Chang KH. Comparative analysis of MR imaging, positron emission tomography, and ictal single-photon emission CT in patients with neocortical epilepsy. AJNR Am J Neuroradiol. 2001;22:937–946. [PMC free article] [PubMed] [Google Scholar]
- Inoue K, Nakagawa M, Goto R, Kinomura S, Sato T, Sato K, Fukuda H. Regional differences between 99mTc-ECD and 99mTc-HMPAO SPET in perfusion changes with age and gender in healthy adults. Eur J Nucl Med Mol Imaging. 2003;30:1489–1497. doi: 10.1007/s00259-003-1234-x. [DOI] [PubMed] [Google Scholar]
- Ito H, Inoue K, Goto R, Kinomura S, Taki Y, Okada K, Sato K, Sato T, Kanno I, Fukuda H. Database of normal human cerebral blood flow measured by SPECT: I. Comparison between I-123-IMP, Tc-99m-HMPAO, and Tc-99m-ECD as referred with O-15 labeled water PET and voxel-based morphometry. Ann Nucl Med. 2006;20:131–138. doi: 10.1007/BF02985625. [DOI] [PubMed] [Google Scholar]
- Jack CR, Jr, Krecke KN, Luetmer PH, Cascino GD, Sharbrough FW, O’Brien PC, Parisi JE. Diagnosis of mesial temporal sclerosis with conventional versus fast spin-echo MR imaging. Radiology. 1994;192:123–127. doi: 10.1148/radiology.192.1.8208923. [DOI] [PubMed] [Google Scholar]
- Jack CR, Jr, Rydberg CH, Krecke KN, Trenerry MR, Parisi JE, Rydberg JN, Cascino GD, Riederer SJ. Mesial temporal sclerosis: diagnosis with fluid-attenuated inversion-recovery versus spin-echo MR imaging. Radiology. 1996;199:367–373. doi: 10.1148/radiology.199.2.8668780. [DOI] [PubMed] [Google Scholar]
- Jafari-Khouzani K, Elisevich K, Patel S, Smith B, Soltanian-Zadeh H. FLAIR signal and texture analysis for lateralizing mesial temporal lobe epilepsy. Neuroimage. 2010;49:1559–1571. doi: 10.1016/j.neuroimage.2009.08.064. [DOI] [PMC free article] [PubMed] [Google Scholar]
- Jafari-Khouzani K, Elisevich KV, Patel S, Soltanian-Zadeh H. Dataset of magnetic resonance images of nonepileptic subjects and temporal lobe epilepsy patients for validation of hippocampal segmentation techniques. Neuroinformatics. 2011 doi: 10.1007/s12021-010-9096-4. to appear. [DOI] [PMC free article] [PubMed] [Google Scholar]
- Jaszczak RJ, Coleman RE, Whitehead FR. Physical factors affecting quantitative measurements using camera-based single photon emission computed tomography (SPECT) IEEE Transactions on Nuclear Science ns-28. 1981:69–80. [Google Scholar]
- Jenkinson M, Smith S. A global optimisation method for robust affine registration of brain images. Med Image Anal. 2001;5:143–156. doi: 10.1016/s1361-8415(01)00036-6. [DOI] [PubMed] [Google Scholar]
- Kaiboriboon K, Bertrand ME, Osman MM, Hogan RE. Quantitative analysis of cerebral blood flow patterns in mesial temporal lobe epilepsy using composite SISCOM. J Nucl Med. 2005;46:38–43. [PubMed] [Google Scholar]
- Kaiboriboon K, Lowe VJ, Chantarujikapong SI, Hogan RE. The usefulness of subtraction ictal SPECT coregistered to MRI in single- and dual-headed SPECT cameras in partial epilepsy. Epilepsia. 2002;43:408–414. doi: 10.1046/j.1528-1157.2002.21201.x. [DOI] [PubMed] [Google Scholar]
- Kanetaka H, Matsuda H, Asada T, Ohnishi T, Yamashita F, Imabayashi E, Tanaka F, Nakano S, Takasaki M. Effects of partial volume correction on discrimination between very early Alzheimer’s dementia and controls using brain perfusion SPECT. Eur J Nucl Med Mol Imaging. 2004;31:975–980. doi: 10.1007/s00259-004-1491-3. [DOI] [PubMed] [Google Scholar]
- Kato H, Shimosegawa E, Oku N, Kitagawa K, Kishima H, Saitoh Y, Kato A, Yoshimine T, Hatazawa J. MRI-based correction for partial-volume effect improves detectability of intractable epileptogenic foci on 123I-iomazenil brain SPECT images. J Nucl Med. 2008;49:383–389. doi: 10.2967/jnumed.107.046136. [DOI] [PubMed] [Google Scholar]
- Kim JT, Bai SJ, Choi KO, Lee YJ, Park HJ, Kim DS, Kim HD, Lee JS. Comparison of various imaging modalities in localization of epileptogenic lesion using epilepsy surgery outcome in pediatric patients. Seizure. 2009;18:504–510. doi: 10.1016/j.seizure.2009.04.012. [DOI] [PubMed] [Google Scholar]
- Knowlton RC, Lawn ND, Mountz JM, Kuzniecky RI. Ictal SPECT analysis in epilepsy: subtraction and statistical parametric mapping techniques. Neurology. 2004;63:10–15. doi: 10.1212/01.wnl.0000132885.83350.45. [DOI] [PubMed] [Google Scholar]
- Koyama M, Kawashima R, Ito H, Ono S, Sato K, Goto R, Kinomura S, Yoshioka S, Sato T, Fukuda H. SPECT imaging of normal subjects with technetium-99m-HMPAO and technetium-99m-ECD. J Nucl Med. 1997;38:587–592. [PubMed] [Google Scholar]
- Lee HW, Hong SB, Tae WS. Opposite ictal perfusion patterns of subtracted SPECT. Hyperperfusion and hypoperfusion. Brain. 2000a;123 (Pt 10):2150–2159. doi: 10.1093/brain/123.10.2150. [DOI] [PubMed] [Google Scholar]
- Lee JD, Kim HJ, Lee BI, Kim OJ, Jeon TJ, Kim MJ. Evaluation of ictal brain SPET using statistical parametric mapping in temporal lobe epilepsy. Eur J Nucl Med. 2000b;27:1658–1665. doi: 10.1007/s002590000364. [DOI] [PubMed] [Google Scholar]
- Lee JJ, Kang WJ, Lee DS, Lee JS, Hwang H, Kim KJ, Hwang YS, Chung JK, Lee MC. Diagnostic performance of 18F-FDG PET and ictal 99mTc-HMPAO SPET in pediatric temporal lobe epilepsy: quantitative analysis by statistical parametric mapping, statistical probabilistic anatomical map, and subtraction ictal SPET. Seizure. 2005;14:213–220. doi: 10.1016/j.seizure.2005.01.010. [DOI] [PubMed] [Google Scholar]
- Lee SK, Lee SY, Yun CH, Lee HY, Lee JS, Lee DS. Ictal SPECT in neocortical epilepsies: clinical usefulness and factors affecting the pattern of hyperperfusion. Neuroradiology. 2006;48:678–684. doi: 10.1007/s00234-006-0106-z. [DOI] [PubMed] [Google Scholar]
- Leveille J, Demonceau G, Walovitch RC. Intrasubject comparison between technetium-99m-ECD and technetium-99m-HMPAO in healthy human subjects. J Nucl Med. 1992;33:480–484. [PubMed] [Google Scholar]
- Lewis PJ, Siegel A, Siegel AM, Studholme C, Sojkova J, Roberts DW, Thadani VM, Gilbert KL, Darcey TM, Williamson PD. Does performing image registration and subtraction in ictal brain SPECT help localize neocortical seizures? J Nucl Med. 2000;41:1619–1626. [PubMed] [Google Scholar]
- McNally KA, Paige AL, Varghese G, Zhang H, Novotny EJ, Jr, Spencer SS, Zubal IG, Blumenfeld H. Localizing value of ictal-interictal SPECT analyzed by SPM (ISAS) Epilepsia. 2005;46:1450–1464. doi: 10.1111/j.1528-1167.2005.06705.x. [DOI] [PubMed] [Google Scholar]
- Merlet I, Ostrowsky K, Costes N, Ryvlin P, Isnard J, Faillenot I, Lavenne F, Dufournel D, Le Bars D, Mauguiere F. 5-HT1A receptor binding and intracerebral activity in temporal lobe epilepsy: an [18F]MPPF-PET study. Brain. 2004;127:900–913. doi: 10.1093/brain/awh109. [DOI] [PubMed] [Google Scholar]
- Newton MR, Berkovic SF, Austin MC, Rowe CC, McKay WJ, Bladin PF. SPECT in the localisation of extratemporal and temporal seizure foci. J Neurol Neurosurg Psychiatry. 1995;59:26–30. doi: 10.1136/jnnp.59.1.26. [DOI] [PMC free article] [PubMed] [Google Scholar]
- O’Brien TJ, So EL, Mullan BP, Hauser MF, Brinkmann BH, Bohnen NI, Hanson D, Cascino GD, Jack CR, Jr, Sharbrough FW. Subtraction ictal SPECT co-registered to MRI improves clinical usefulness of SPECT in localizing the surgical seizure focus. Neurology. 1998;50:445–454. doi: 10.1212/wnl.50.2.445. [DOI] [PubMed] [Google Scholar]
- O’Brien TJ, So EL, Mullan BP, Hauser MF, Brinkmann BH, Jack CR, Jr, Cascino GD, Meyer FB, Sharbrough FW. Subtraction SPECT co-registered to MRI improves postictal SPECT localization of seizure foci. Neurology. 1999;52:137–146. doi: 10.1212/wnl.52.1.137. [DOI] [PubMed] [Google Scholar]
- Oku N, Matsumoto M, Hashikawa K, Moriwaki H, Ishida M, Seike Y, Terakawa H, Watanabe Y, Uehara T, Nishimura T. Intra-individual differences between technetium-99m-HMPAO and technetium-99m-ECD in the normal medial temporal lobe. J Nucl Med. 1997;38:1109–1111. [PubMed] [Google Scholar]
- Pagani M, Salmaso D, Jonsson C, Hatherly R, Jacobsson H, Larsson SA, Wagner A. Regional cerebral blood flow as assessed by principal component analysis and (99m)Tc-HMPAO SPET in healthy subjects at rest: normal distribution and effect of age and gender. Eur J Nucl Med Mol Imaging. 2002;29:67–75. doi: 10.1007/s00259-001-0676-2. [DOI] [PubMed] [Google Scholar]
- Patterson JC, Early TS, Martin A, Walker MZ, Russell JM, Villanueva-Meyer H. SPECT image analysis using statistical parametric mapping: comparison of technetium-99m-HMPAO and technetium-99m-ECD. J Nucl Med. 1997;38:1721–1725. [PubMed] [Google Scholar]
- Perault C, Papathanassiou D, Wampach H, Vera P, Kaminska A, Chiron C, Peruzzi P, Liehn JC. Computer-aided intrapatient comparison of brain SPECT images: the gray-level normalization issue applied to children with epilepsy. Journal of Nuclear Medicine. 2002;43:715–724. [PubMed] [Google Scholar]
- Rossman M, Adjouadi M, Ayala M, Yaylali I. An interactive interface for seizure focus localization using SPECT image analysis. Comput Biol Med. 2006;36:70–88. doi: 10.1016/j.compbiomed.2004.09.001. [DOI] [PubMed] [Google Scholar]
- Rowe CC, Berkovic SF, Austin MC, McKay WJ, Bladin PF. Patterns of postictal cerebral blood flow in temporal lobe epilepsy: qualitative and quantitative analysis. Neurology. 1991;41:1096–1103. doi: 10.1212/wnl.41.7.1096. [DOI] [PubMed] [Google Scholar]
- Saxena P, Pavel DG, Quintana JC, Horwitz B. An automatic threshold-based scaling method for enhancing the usefulness of Tc-HMPAO SPECT in the diagnosis of Alzheimer’s disease. Springer-Verlag; Berlin, Germany: 1998. pp. 623–630. [Google Scholar]
- Shin WC, Hong SB, Tae WS, Seo DW, Kim SE. Ictal hyperperfusion of cerebellum and basal ganglia in temporal lobe epilepsy: SPECT subtraction with MRI coregistration. J Nucl Med. 2001;42:853–858. [PubMed] [Google Scholar]
- Smith SM. Fast robust automated brain extraction. Hum Brain Mapp. 2002;17:143–155. doi: 10.1002/hbm.10062. [DOI] [PMC free article] [PubMed] [Google Scholar]
- Sojkova J, Lewis PJ, Siegel AH, Siegel AM, Roberts DW, Thadani VM, Williamson PD. Does asymmetric basal ganglia or thalamic activation aid in seizure foci lateralization on ictal SPECT studies? J Nucl Med. 2003;44:1379–1386. [PubMed] [Google Scholar]
- Stoeckel J, Malandain G, Migneco O, Koulibaly PM, Robert P, Ayache N, Darcourt J. Classification of SPECT Images of Normal Subjects versus Images of Alzheimer’s Disease Patients. Proceedings of the 4th International Conference on Medical Image Computing and Computer-Assisted Intervention; Springer-Verlag; 2001. pp. 666–674. [Google Scholar]
- Tan KM, Britton JW, Buchhalter JR, Worrell GA, Lagerlund TD, Shin C, Cascino GD, Meyer FB, So EL. Influence of subtraction ictal SPECT on surgical management in focal epilepsy of indeterminate localization: a prospective study. Epilepsy Res. 2008;82:190–193. doi: 10.1016/j.eplepsyres.2008.08.007. [DOI] [PubMed] [Google Scholar]
- Toczek MT, Carson RE, Lang L, Ma Y, Spanaki MV, Der MG, Fazilat S, Kopylev L, Herscovitch P, Eckelman WC, Theodore WH. PET imaging of 5-HT1A receptor binding in patients with temporal lobe epilepsy. Neurology. 2003;60:749–756. doi: 10.1212/01.wnl.0000049930.93113.20. [DOI] [PubMed] [Google Scholar]
- Van Paesschen W, Dupont P, Van Driel G, Van Billoen H, Maes A. SPECT perfusion changes during complex partial seizures in patients with hippocampal sclerosis. Brain. 2003;126:1103–1111. doi: 10.1093/brain/awg108. [DOI] [PubMed] [Google Scholar]
- Vera P, Kaminska A, Cieuta C, Hollo A, Stievenart JL, Gardin I, Ville D, Mangin JF, Plouin P, Dulac O, Chiron C. Use of subtraction ictal SPECT co-registered to MRI for optimizing the localization of seizure foci in children. J Nucl Med. 1999;40:786–792. [PubMed] [Google Scholar]
- Won Chul S, Seung Bong H, Woo Suk T, Dae Won S, Sang Eun K. Ictal hyperperfusion of cerebellum and basal ganglia in temporal lobe epilepsy: SPECT subtraction with MRI coregistration. Journal of Nuclear Medicine. 2001;42:853–858. [PubMed] [Google Scholar]
- Won HJ, Chang KH, Cheon JE, Kim HD, Lee DS, Han MH, Kim IO, Lee SK, Chung CK. Comparison of MR imaging with PET and ictal SPECT in 118 patients with intractable epilepsy. AJNR Am J Neuroradiol. 1999;20:593–599. [PMC free article] [PubMed] [Google Scholar]
- Yang BH, Wang SJ, Chou YH, Su TP, Chen JC. The effect of templates on 99mTc-ECD SPECT healthy brain perfusion analysis using statistical parametric mapping. Biomedical Engineering, Applications Basis Communications. 2006;18:296–304. [Google Scholar]
- Yokoi T, Soma T, Shinohara H, Matsuda H. Accuracy and reproducibility of co-registration techniques based on mutual information and normalized mutual information for MRI and SPECT brain images. Ann Nucl Med. 2004;18:659–667. doi: 10.1007/BF02985959. [DOI] [PubMed] [Google Scholar]
- Zaknun JJ, Bal C, Maes A, Tepmongkol S, Vazquez S, Dupont P, Dondi M. Comparative analysis of MR imaging, Ictal SPECT and EEG in temporal lobe epilepsy: a prospective IAEA multi-center study. Eur J Nucl Med Mol Imaging. 2008;35:107–115. doi: 10.1007/s00259-007-0526-y. [DOI] [PubMed] [Google Scholar]
- Zubal IG, Spanaki MV, MacMullan J, Corsi M, Seibyl JP, Spencer SS. Influence of technetium-99m-hexamethylpropylene amine oxime injection time on single-photon emission tomography perfusion changes in epilepsy. Eur J Nucl Med. 1999;26:12–17. doi: 10.1007/s002590050353. [DOI] [PubMed] [Google Scholar]
- Zubal IG, Spencer SS, Imam K, Seibyl J, Smith EO, Wisniewski G, Hoffer PB. Difference images calculated from ictal and interictal technetium-99m-HMPAO SPECT scans of epilepsy. J Nucl Med. 1995;36:684–689. [PubMed] [Google Scholar]