
Figure 1.
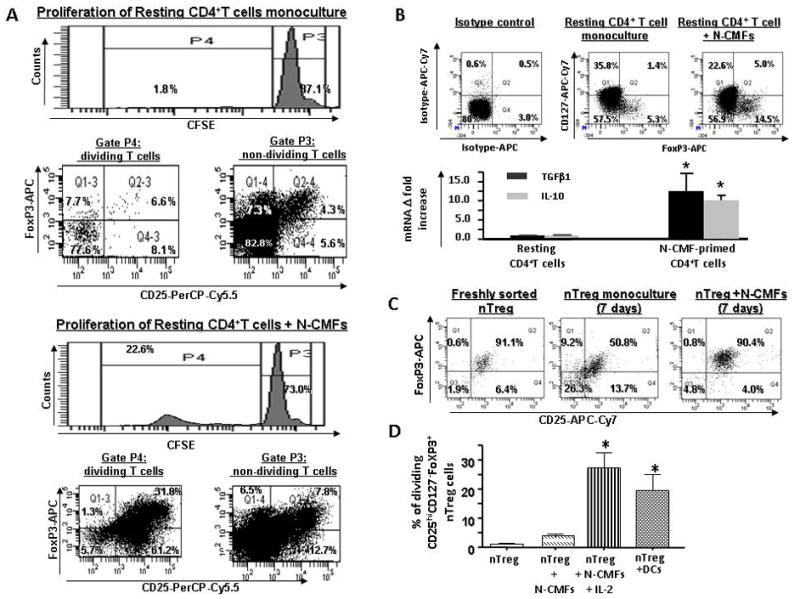
Normal (N) CMFs contribute to the maintenance of nTreg phenotype. CFSE-labeled resting CD4+ T cells were cultured without or with allogeneic N-CMFs at a ratio 1:10 for 7 days in 24 well plates. T cell from these co-cultures were subjected to surface CD4 and CD25, CD127 and intracellular FoxP3 staining following by flow cytometry. (A) Live events were gated in P1 and percentage of CD25+FoxP3+ T cells in non dividing (P3) and dividing (P4) fractions of CD4+ resting T cells growing in monoculture or cocultured with N-CMFs was evaluated. A representative experiment is shown (n=5 allogeneic donor pair, two experimental replicate each) (B) Distribution of CD127 and FoxP3 (FACS analysis) and expression of TGFβ1 and IL-10 (real-time RT-PCR) in the CD4+ resting T cells growing in monoculture or cocultured with N-CMFs was evaluated. A representative experiment is shown (n=4 allogeneic donor pair, two experiment replicate each) (D) The surface CD25 and intracellular FoxP3 expression in the freshly isolated and seven day monoculture of nTreg, and N-CMF primed nTreg was analyzed. A representative experiment is shown (n=5 allogeneic donor pair, two experiment replicate each). (D) Percentage of the dividing CD4+CD25highCd127−FoxP3+ nTreg in response to the allogeneic stimulation with N-CMF in presence/absence of IL-2 (10 ng/mL) or BM-derived DC was measured in 7 day co-culture as described above. Results are calculated as the mean value of the percentage of the dividing cells for three independent allogeneic pair of N-CMFs and CD4+ T cells healthy donors ± SD. Each assay was conducted in duplicate. * p < 0.05.