Abstract
Cooperativity, a universal property of biological macromolecules, is typically characterized by a Hill slope, which can provide fundamental information about binding sites and interactions. We demonstrate, via simulations and single molecule FRET experiments, that molecular heterogeneity lowers bulk cooperativity from the intrinsic value for the individual molecules. As heterogeneity is common in smFRET experiments, appreciation of its influence on fundamental measures of cooperativity is critical for deriving accurate molecular models.
Cooperativity is a universal property of biological macromolecules that is exploited widely in biological regulation and function.1-4 Cooperativity of ligand binding is defined as positive if binding of one ligand molecule strengthens binding of subsequent molecules, and as negative if binding of one molecule weakens binding of subsequent molecules. Quantitative measurements of cooperativity typically rely on fitting the Hill equation5 to ligand binding data:
| (1), |
where f is the fraction of the ligand bound, [L] is the concentration of ligand, and L1/2 is the midpoint. In the simple case of all-or-none binding, the Hill cooperativity coefficient n indicates the binding stoichiometry, and in situations in which the stoichiometry is known the value of n provides fundamental information about intramolecular communication.6,7 In bulk studies, individual macromolecules within an ensemble have traditionally been assumed to be identical. However, modern single molecule methods are revealing unexpected molecular heterogeneity in many instances (additional references are provided in Supplementary References due to space limitations).8-12 We address herein, via numerical simulations and single molecule FRET experiments, how such heterogeneity distorts the cooperativity measured in bulk from the actual cooperativity of the individual molecules.
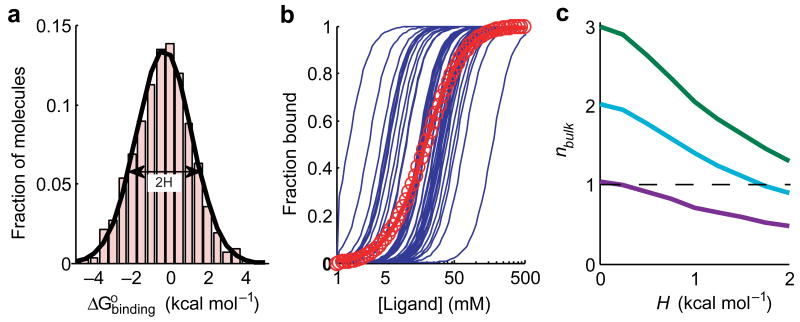
Consider an ensemble of macromolecules in which the affinity for a ligand varies between molecules. For simplicity, we assume that the affinity variation is characterized by a normal distribution (Fig. 1a). We refer to the standard deviation of the distribution as the “heterogeneity parameter” H. We further assume that all molecules have the same binding cooperativity, n = 3 in this example (Fig. 1b, blue lines). When the individual binding curves are summed to give the overall curve for the ensemble, a shallower dependence on ligand concentration is obtained, with a bulk cooperativity parameter nbulk = 1.6 for this example (Fig. 1b, red circles).
Figure 1.
Simulations of ligand binding cooperativity with a heterogeneous population of molecules. (a) A simulated distribution of ligand binding energies, , for 3000 hypothetical molecules. The standard deviation of the distribution, referred to as the heterogeneity parameter, H, is 1.5 kcal mol-1. (b) Simulated ligand binding curves for individual molecules with the cooperativity coefficient n = 3 (blue lines). Fifty randomly drawn curves are displayed. The bulk binding curve is the sum of curves of all of the molecules (red circles). The red line is the best Hill fit to the bulk binding curve, giving nbulk = 1.6. (c) Reduction of the bulk cooperativity parameter nbulk as a function of the heterogeneity parameter H for three different true values of n. The dashed line at nbulk = 1 separates positive and negative observed cooperativity.
The origin of the decrease in apparent cooperativity can be readily seen from Fig. 1b. The ensemble binding curve is the sum of individual binding curves, which are shifted relative to one another along the ligand concentration axis. The ensemble curve starts to rise before the highest abundance binding curves rise because macromolecules with the highest affinities bind ligand at lower concentrations than the most highly represented molecules. At high ligand concentrations, the ensemble curve does not level off as sharply as the individual curves, because the macromolecules with the lowest affinities are not yet saturated at ligand concentrations that saturate other molecules. Thus, the curve for the ensemble of molecules has a shallower dependence on the ligand concentration than curves for the individual molecules.
The observed cooperativity derived from the ensemble curve becomes smaller as heterogeneity increases (Fig. 1c). With sufficient heterogeneity, cooperative binding can appear non-cooperative (Fig. 1c, cyan curve gives n = 1 with a heterogeneity of H = 1.7 kcal mol-1), and binding of a ligand that was cooperative or non-cooperative can even appear anti-cooperative (Fig. 1c, cyan and magenta curves). Conversely, the more uniform the behavior of the molecules, the closer the value of nbulk approaches the true value of n. Thus, only for a truly uniform ensemble can nbulk be directly interpreted as reflecting the fundamental properties of individual molecules. To unambiguously interpret nbulk measured for a potentially heterogeneous ensemble, the extent of heterogeneity must be known.
Single molecule experiments have almost invariably revealed heterogeneity of biological macromolecules with respect to ligand binding, folding, and activity.8-12 Heterogeneity may be a property of macromolecules undetected in bulk experiments (from multiple long-lived conformations, or from multiple covalently distinct molecules), or an artifact of single molecule experiments (such as interactions with heterogeneous surfaces used for immobilization of molecules). Some studies have provided evidence that heterogeneity is not an artifact of surface immobilization,10,12 so it is likely that heterogeneity exists in bulk experiments and distorts cooperativity measured in at least some experiments. Single molecule experiments have unique abilities to directly measure the extent of heterogeneity and to obtain binding curves for individual molecules, and thus to directly determine n for each molecule.
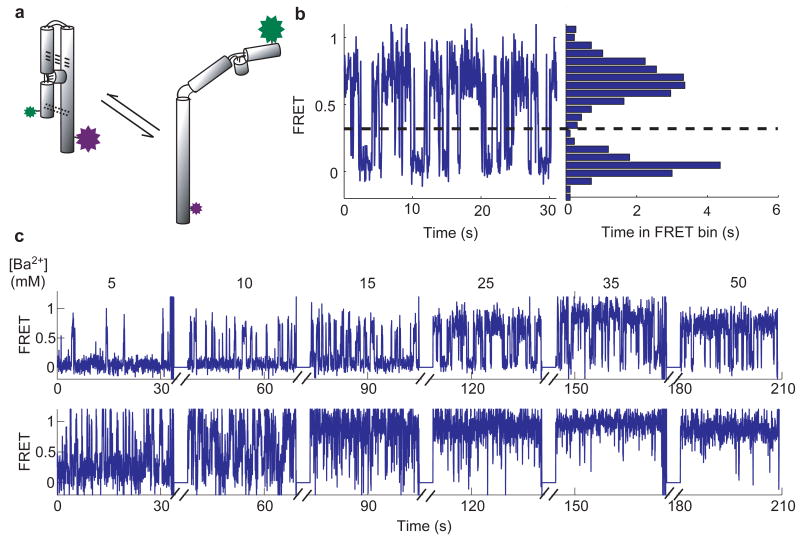
Taking advantage of these abilities, we measured heterogeneity and cooperativity coefficients for ion-dependent folding of P4-P6 RNA using single molecule FRET (smFRET). P4-P6 (Fig. 2a) is an independently folding domain from the Tetrahymena group I intron and is a convenient system for smFRET studies (Fig. 2b, Fig. 2c & Supplementary Materials).13 The molecular basis for the cooperativity coefficients for ion-dependent folding is complex because most ions are not site-bound to RNA, but instead form a diffuse “ion atmosphere”.14-17 Nevertheless, the effect of heterogeneity on n arises from differences in folding of individual molecules, and does not depend on the underlying basis of n. It also does not depend on the molecular basis of heterogeneity, which for P4-P6 is mostly covalent (Greenfeld, M., Solomatin, S., Herschlag, D., unpublished data). In other systems heterogeneity is, at least in substantial part, conformational.12 We used P4-P6 here as a powerful system to demonstrate the effect of heterogeneity on the cooperativity with actual experimental data. The overall interpretation holds regardless of whether the heterogeneity is covalent or conformational.
Figure 2.
Single molecule FRET (smFRET) measurements of P4-P6 RNA folding. (a) Scheme of folding of fluorescent dye-labelled P4-P6. The green and the purple stars indicate the positions of the donor (Cy3) and the acceptor (Cy5) dyes, respectively.13 The dashed and the dotted lines indicate tertiary interactions that stabilize the folded state. (The tertiary interaction indicated by the dashed lines involves bound Mg2+ ions and is not made in the presence of Ba2+).20 (b) FRET trace of a single P4-P6 molecule displaying fluctuations between a folded (high FRET) and an unfolded (low FRET) state. The dashed line is the threshold used to calculate according to the Eq. 2. (c) FRET traces of two individual P4-P6 molecules observed over a range of Ba2+ concentrations. Breaks in the x-axis indicate when data collection was suspended to change Ba2+ concentration.
We measured heterogeneity of P4-P6 folding for an ensemble of 126 molecules in Ba2+ at a concentration close to the mid-point (Fig. 2b). These conditions allowed us to follow many folding transitions prior to dye photobleaching, and thus to obtain the most accurate measurements of the folding free energy (Supplementary Information).12,18 The value of for each molecule was calculated from smFRET traces as follows:
| (2), |
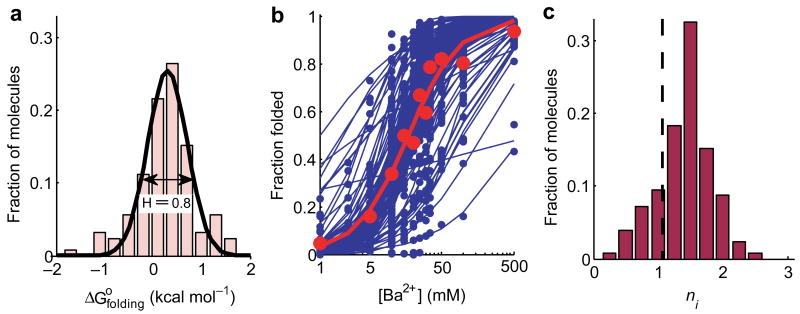
where tfolded and tunfolded are the times each molecule spent folded and unfolded, respectively. Individual P4-P6 traces produced a range of values from −1 kcal mol-1 to 1.5 kcal mol-1 (Fig. 3a). This range was much broader than expected from statistical variability arising from finite time sampling, and corresponds to molecular heterogeneity (Supplementary Methods & Supplementary Fig. 1). Fitting a Gaussian to the histogram of allowed us to calculate the heterogeneity parameter H = 0.8 ± 0.2 kcal mol-1. The same value of H was obtained for a much larger ensemble of 1241 molecules (Supplementary Fig. 2), indicating that 126 molecules adequately cover P4-P6 heterogeneity.
Figure 3.
Cooperativity of Ba2+-dependent folding for 126 P4-P6 molecules measured by smFRET. (a) Heterogeneity of for 126 individual P4-P6 molecules at [Ba2+] = 10 mM. Heterogeneity parameter H = 0.8 ± 0.2 kcal mol-1 (the error is the s.e.m.). (b) Individual folding isotherms for 126 P4-P6 molecules and Hill fits to each of these isotherms (blue circles and blue lines, respectively). The bulk folding curve (red circles) was calculated as the sum of the data for all of the molecules. (c) The distribution of individual cooperativity parameters ni obtained from the fits displayed in the panel b. The value of nbulk is indicated by a dashed line.
At this level of heterogeneity, our simulations predict that nbulk is substantially reduced relative to the true value for individual molecules. To test this prediction, we designed single molecule titration experiments and obtained folding isotherms for individual P4-P6 molecules (Fig. 2c & Supplementary Methods). The bulk folding isotherm was obtained from the total time all of the molecules spent in the folded state at each Ba2+ concentration. The best fit of the Hill equation to the bulk folding curve (Fig. 3b, red symbols) gave the cooperativity parameter nbulk = 1.1 ± 0.14. This value of n is indistinguishable from 1, which could have suggested an absence of folding cooperativity with respect to Ba2+. However, when we fitted the Hill equation to the folding isotherms of the individual molecules (Fig. 3b) and directly determined the individual cooperativity coefficients, ni, we observed ni = 1.5 ± 0.3 for most molecules (Fig. 3c). These measurements indicate that folding is, in fact, cooperative, and directly illustrate how molecular heterogeneity distorts ensemble-averaged cooperativity. Furthermore, individual molecules had different cooperativity coefficients, varying from as low as ni = 0.5 ± 0.12 to as high as 2.7 ± 0.7 (Fig. 3c). The differences in cooperativity parameters between molecules were much larger than the errors associated with these parameters (Supplementary Fig. 3). These observations further underscores the wealth of mechanistic information that can be revealed in single molecule experiments.
In conclusion, we have demonstrated how molecular heterogeneity distorts cooperativity observed in ensemble measurements, via simulation and the first reported experimental single molecule titrations. Knowledge of the cooperativity actually exhibited by individual molecules is critical for developing an atomic-level mechanistic understanding of macromolecular behavior. In addition, there is increasing awareness of molecular heterogeneity, and possible roles of heterogeneity in biological systems are being widely discussed (e.g., ref. 19).19 We speculate that controlled heterogeneity, possibly established by variations in covalent modification of proteins, might be used to fine tune cooperative behavior in biology.
Supplementary Material
Acknowledgments
We thank H. Mabuchi (Department of Applied Physics, Stanford University) for technical support and D. Pavlichin for helping to create data analysis software. This work was funded by the National Institute of Health through grant GM49243 to D.H.
Footnotes
Supplementary information is available on the Nature Structural and Molecular Biology web site.
Author Contributions All authors contributed to the experimental design and writing of the manuscript; M.G. performed the experiments; M.G. and S.V.S. carried out data analysis.
References
- 1.Demeyts P, Roth J, Neville DM, Gavin JR, Lesniak MA. Bioch Biophys Res Comm. 1973;55:154–161. doi: 10.1016/s0006-291x(73)80072-5. [DOI] [PubMed] [Google Scholar]
- 2.Levitzki A, Koshland DE. Proc Natl Acad Sci USA. 1969;62:1121–1128. doi: 10.1073/pnas.62.4.1121. [DOI] [PMC free article] [PubMed] [Google Scholar]
- 3.Lohman TM, Ferrari ME. Ann Rev Biochem. 1994;63:527–570. doi: 10.1146/annurev.bi.63.070194.002523. [DOI] [PubMed] [Google Scholar]
- 4.Perutz MF. Quarterly Rev Biophys. 1989;22:139–236. doi: 10.1017/s0033583500003826. [DOI] [PubMed] [Google Scholar]
- 5.Hill AV. J Phys. 1910;40:iv–vii. [Google Scholar]
- 6.Weiss JN. FASEB J. 1997;11:835–841. [PubMed] [Google Scholar]
- 7.Wyman J. Adv Protein Chem. 1964;19:223–286. doi: 10.1016/s0065-3233(08)60190-4. [DOI] [PubMed] [Google Scholar]
- 8.Lu HP, Xun LY, Xie XS. Science. 1998;282:1877–1882. doi: 10.1126/science.282.5395.1877. [DOI] [PubMed] [Google Scholar]
- 9.Zhuang X, et al. Science. 2002;296:1473–1476. doi: 10.1126/science.1069013. [DOI] [PubMed] [Google Scholar]
- 10.Okumus B, Wilson TJ, Lilley DMJ, Ha T. Biophys J. 2004;87:2798–2806. doi: 10.1529/biophysj.104.045971. [DOI] [PMC free article] [PubMed] [Google Scholar]
- 11.Qu XH, et al. Proc Natl Acad Sci U S A. 2008;105:6602–6607. doi: 10.1073/pnas.0801436105. [DOI] [PMC free article] [PubMed] [Google Scholar]
- 12.Solomatin SV, Greenfeld M, Chu S, Herschlag D. Nature. 2010;463:681–684. doi: 10.1038/nature08717. [DOI] [PMC free article] [PubMed] [Google Scholar]
- 13.Sattin BD, Zhao W, Travers K, Chu S, Herschlag D. J Am Chem Soc. 2008;130:6085–6087. doi: 10.1021/ja800919q. [DOI] [PMC free article] [PubMed] [Google Scholar]
- 14.Draper DE, Grilley D, Soto AM. Ann Rev Biophys Biomol Struct. 2005;34:221–243. doi: 10.1146/annurev.biophys.34.040204.144511. [DOI] [PubMed] [Google Scholar]
- 15.Draper DE. Biophys J. 2008;95:5489–5495. doi: 10.1529/biophysj.108.131813. [DOI] [PMC free article] [PubMed] [Google Scholar]
- 16.Das R, Travers KJ, Bai Y, Herschlag D. J Am Chem Soc. 2005;127:8272–8273. doi: 10.1021/ja051422h. [DOI] [PMC free article] [PubMed] [Google Scholar]
- 17.Das R, et al. J Mol Biol. 2003;332:311–319. doi: 10.1016/s0022-2836(03)00854-4. [DOI] [PubMed] [Google Scholar]
- 18.Bartley LE, Zhuang XW, Das R, Chu S, Herschlag D. J Mol Biol. 2003;328:1011–1026. doi: 10.1016/s0022-2836(03)00272-9. [DOI] [PubMed] [Google Scholar]
- 19.Tawfik DS. Nat Chem Biol. 6:692–696. doi: 10.1038/nchembio.441. [DOI] [PubMed] [Google Scholar]
- 20.Travers KJ, Boyd N, Herschlag D. RNA. 2007;13:1205–1213. doi: 10.1261/rna.566007. [DOI] [PMC free article] [PubMed] [Google Scholar]
Associated Data
This section collects any data citations, data availability statements, or supplementary materials included in this article.


