

Abstract
We previously characterized human islet-derived precursor cells (hIPCs) as a specific type of mesenchymal stem cell capable of differentiating to insulin (INS)- and glucagon (GCG)-expressing cells. However, during proliferative expansion, INS transcript becomes undetectable and then cannot be induced, a phenomenon consistent with silencing of the INS gene. We explored this possibility by determining whether ectopic expression of transcription factors known to induce transcription of this gene in β cells, pancreatic and duodenal homeobox factor 1 (Pdx1), V-maf musculoaponeurotic fibrosarcoma oncogene homolog A (Mafa), and neurogenic differentiation 1 (Neurod1), would activate INS gene expression in long-term hIPC cultures. Coexpression of all three transcription factors had little effect on INS mRNA levels but unexpectedly increased GCG mRNA at least 100,000-fold. In contrast to the endogenous promoter, an exogenous rat INS promoter was activated by expression of Pdx1 and Mafa in hIPCs. Chromatin immunoprecipitation (ChIP) assays using antibodies directed at posttranslationally modified histones show that regions of the INS and GCG genes have similar levels of activation-associated modifications but the INS gene has higher levels of repression-associated modifications. Furthermore, the INS gene was found to be less accessible to micrococcal nuclease digestion than the GCG gene. Lastly, ChIP assays show that exogenously expressed Pdx1 and Mafa bind at very low levels to the INS promoter and at 20- to 25-fold higher levels to the GCG promoter in hIPCs. We conclude that the INS gene in hIPCs is modified epigenetically (“silenced”) so that it is resistant to activation by transcription factors.
Keywords: Epigenetics, Gene silencing, Glucagon, Insulin, Mesenchymal stem cells, Pancreatic precursor cells, Transcription factors
Introduction
Islet transplantation can lead to restoration of endogenous blood glucose control for patients with type 1 diabetes [1]. However, scarcity of donated islets has encouraged research to identify and develop alternative cells capable of acting as functional insulin (INS)-secreting cells [2]. Human islet-derived precursor cells (hIPCs) are a type of mesenchymal stem cells (MSCs) generated in vitro from adult cadaveric human islet preparations [3, 4]. We have shown previously that hIPCs differentiate into INS-secreting cells when placed under the kidney capsules of mice after more than 1,000-fold expansion in culture. In vitro differentiation has been less successful. Under our current protocol, hIPCs express less than 0.02% of the INS transcript observed in human islets [3, 4]. Moreover, hIPCs exhibit gradual decreases in INS mRNA with time in culture, the level becoming undetectable, and the ability to induce INS gene transcription with our protocol is lost. This loss of INS gene transcription is consistent with “silencing” of the INS gene during proliferation in culture.
Gene silencing, or long-term gene repression, is a critical component of cell differentiation in animal cells [5]. Indeed, it appears that most tissue-specific genes are repressed early in development and are subsequently activated only in the cells in which they are to be expressed in differentiated tissues. A common mechanism of gene repression involves changes in chromatin that limit accessibility of the transcription complex to the promoter region of a gene and thereby inhibit gene transcription. Indeed, it has been shown that the pancreatic and duodenal homeobox factor 1 (Pdx1) is able to bind to the endogenous INS gene promoter in a β cell line but that the INS gene is inaccessible in a pancreatic ductal cell line [6]. Posttranslational modification of the tails of histones H3 and H4, for example by acetylation or methylation, has been shown to affect chromatin structure and function [7]. Specifically, these covalent alterations affect the packing of histone proteins and thereby the accessibility to the DNA. Silencing of genes previously expressed in adult cells has been shown to occur in human disease, for example in cancer [8].
Human islets are composed of multiple cell types with the two most abundant being INS-expressing β cells and glucagon (GCG)-expressing α cells. The cell type-specific expression of both INS and GCG is conferred by proximal promoters of about 300 base pairs [9–11]. Intensive studies identified regulatory elements within these regions and their cognate transcription factors (TFs). Three factors have been shown to be necessary for development and function of adult β cells. Pdx1, a homeodomain protein, acts at A-boxes and GG elements within the INS promoter [12]. Pdx1 is expressed in all pancreatic precursor cells during embryonic development but primarily in β cells in the adult [13]. Total Pdx1 deficiency results in pancreatic agenesis in both mice and humans [14, 15], whereas β cell-specific deficiency of Pdx1 in the adult leads to diabetes [16]. Neurogenic differentiation 1 (Neurod1), a member of the basic helix-loop-helix family, regulates INS gene expression through the E-box sequence [12, 17]. Neurod1-deficient mice have major reductions in β-cell numbers, lack mature islet structures, and develop severe diabetes shortly after birth [18]. V-maf musculoaponeurotic fibrosarcoma oncogene homolog A (Mafa), a member of the basic leucine zipper family, regulates INS gene expression through the C1-box [19]. Mafa expression is restricted to β cells in adult islets and Mafa-deficient mice develop diabetes and exhibit abnormal islet morphology [20–22].
Ectopic expression of endocrine TFs, most notably Pdx1, has been shown to lead to INS expression in several cell types including MSCs [23, 24]. As a cell population derived from an INS-expressing niche, introduction of TFs into hIPCs might improve their potential for endocrine differentiation. Although we have previously determined that hIPCs share many characteristics with MSCs [4], a quantitative difference in the two cell types was observed in chromatin modifications on the INS promoter. Although neither cell type expressed INS transcripts, the INS promoter in hIPCs exhibited hyperacetylation of histone H4 and dimethylation of lysine 4 on histone H3 that is typical of active genes, whereas in MSCs these levels were lower. These epigenetic marks suggested that hIPCs might be poised for activation of INS expression [25]. We tested this idea by determining whether expression of Pdx1, Mafa, and Neurod1 would activate INS gene expression in long-term hIPC cultures. We found that coexpression of all three factors had little effect on INS mRNA levels but unexpectedly increased GCG transcript up to 100,000-fold in both proliferating hIPCs and bone marrow-derived MSCs (BM-MSCs). Our results suggest that the failure to induce INS transcription may be explained by reduced accessibility of the TFs to the INS promoter compared with the GCG promoter.
Materials and Methods
Cell Culture
hIPCs were derived from fresh human islets as described previously [3] and maintained in 150-mm tissue culture dishes in growth medium. Growth medium was CMRL-1066 (Gibco, Grand Island, NY, http://www.invitrogen.com) supplemented with 10% fetal bovine serum (Gibco, Grand Island, NY, http://www.invitrogen.com), 2 mM l-glutamine, and penicillin/streptomycin. Cells were passaged every 3–4 days at 80%-90% confluence. Briefly, growth medium was removed, and 10 ml of tryp-sin-EDTA (Cellgro; Mediatech, Manassas, VA) was added per dish. After 2–5 minutes at 37°C, an equal volume of growth medium was added and cells were collected by centrifugation. Cells were resuspended in fresh growth medium, counted using a Vi-Cell XR analyzer (Beckman Coulter, Fullerton, CA), and seeded in new dishes at 1.3 × 10⁴ cells per cm2. Over the initial 20–25 passages, cell number approximately doubled with each passage. The formation of epithelial cell clusters was performed as described previously [4].
Human BM-MSCs (hBM-MSCs) were obtained from Lonza (Walkersville, MD, http://www.lonza.com) and cultured as recommended by the vendor.
AD-293 cells were obtained from Stratagene (La Jolla, CA, http://www.stratagene.com) and were maintained according to their protocol in Dulbecco's modified Eagle's medium with 10% fetal bovine serum, 2 mM l-glutamine, and penicillin/streptomycin.
Human Islets of Langerhans
Human islets were obtained from cadaveric pancreases from the National Islet Cell Resource Center Basic Science Islet Distribution Program.
Adenoviral Expansion and Infection
Adenoviruses expressing mouse Pdx1 (Ad-Pdx1), mouse Mafa (Ad-Mafa), and green fluorescent protein (Ad-GFP) under control of the cytomegalovirus promoter were obtained from the Beta Cell Biology Consortium (Nashville, TN, http://www.betacell.org). Adenovirus-expressing rat Neurod1 (rNeurod1) was obtained from Harry Heimberg [26]. Adenovirus expressing green fluorescent protein from the rat insulin promoter (Ad-RIP/GFP) was obtained from Larry Moss [27]. Adenoviruses were amplified using the AD-293 cell line (Stratagene). Viral preparations with titers of up to 1010 infectious units per milliliter were obtained by infecting two T-175 flasks at 70%–80% confluence with a multiplicity of infection (MOI) of 5–15 in 25 ml/flask serum-containing medium (SCM). After 2–3 days, when a majority of the cells exhibited cytopathic effects, cells were collected by pipetting. After centrifugation at 150g for 5 minutes, the media and cells were subjected to three freeze/thaw cycles. Cellular debris was removed by centrifugation of 1000g for 10 minutes. The viral lysate was concentrated fourfold using an Ultra-15 Centrifugal Filter Unit (Amicon; Millipore, Billerica, MA, http://www.millipore.com). Concentrated lysate was buffered with 25 mM Tris-HCl buffer, pH 8.0. The lysate was sterile filtered and then brought to a final concentration of 10% sterile glycerol and stored at −80°C. Thawed aliquots were kept at 4°C for 2–3 weeks.
Adenovirus preparations were titered by plating 100 μl of diluted virus (10−3−10−8) with 500,000 AD-293 cells in duplicate into 12 wells in 1 ml of SCM. After 48 hours, cells were fixed with ice-cold 100% methanol and incubated at −20°C for 10 minutes. The fixed cells were washed three times with phosphate-buffered saline containing 1% bovine serum albumin (BSA) and stained with mouse anti-hexon antibody (Abcam, Cambridge, U.K., http://www.abcam.com) 1:1000 in PBS with 1% BSA for 1 hour at 37°C. After three washes with PBS containing 1% BSA, cells were incubated with goat anti-mouse Alexa-Fluor 488 or 546(ab)2 secondary antibodies (Molecular Probes Inc., Eugene, OR, http://probes.invitrogen.com).
hIPCs and hBM-MSCs were infected with adenoviruses at the indicated MOI in suspension culture using a minimal volume of basal media without serum or BSA. Plates were rocked gently every 15 minutes for 1 hour. Most cells adhere loosely to the plate surface during this time. Two volumes of SCM were then added to the cell suspension and incubation was continued for 24 hours, when cells were rinsed twice and, unless indicated otherwise, re-fed with BSA-containing serum-free medium.
Quantitative Polymerase Chain Reaction
Total RNA was purified using the RNeasy Mini Kit (Qiagen, Hilden, Germany, http://www1.qiagen.com). First-strand cDNA was prepared using a High Capacity cDNA Archive Kit (Applied Bio-Systems, Foster City, CA, http://www.appliedbiosystems.com). Quantitative polymerase chain reaction (qPCR) was performed in 25-μl reactions in 96-well plates using cDNA prepared from 100 ng or less of total RNA and Universal PCR Master Mix (Applied Biosystems). Primers and probes were Assay-on-Demand (Applied Biosystems). We have confirmed linear amplification of INS and GCG transcripts by reverse transcription and qPCR in samples containing various proportions of total RNA from human islets and HeLa cells. This linear relationship continued until the fluorescence cycle threshold (Ct) values were 38, and we therefore consider Ct values greater than 38 to be undetectable. Results for mRNA levels are presented as fold change over starting value after normalizing for human glyceraldehyde-3-phosphate dehydrogenase expression ± SD. If initial Ct values were greater than 38, fold changes were calculated using a starting Ct value of 38 equal to 1.
Cytometry
Cells were monodispersed using trypsin, washed once, resus-pended at 106/ml in Hanks' balanced salt solution, and maintained at 4°C Cells were analyzed for fluorescence using a FACSCalibur (BD Biosciences, San Diego, http://www.bdbiosciences.com).
Chromatin Immunoprecipitation
Primary antibodies for chromatin immunoprecipitation were rabbit anti-mouse Mafa (A300-611A; Bethyl Laboratories, Inc., Montgomery, TX, http://www.bethyl.com), rabbit anti-mouse, rat, human Pdx1 (AB3243; Chemicon, Temecula, CA, http://www.chemicon.com), rabbit anti-mouse, rat, human Neurod1 (AB15580; Chemicon), rabbit anti-human H3K4 Me1 (ab8895; Abcam), rabbit anti-human H3K4 Me2 (07–030; Millipore), rabbit anti-human H3K4me3 (ab12209; Abcam), rabbit anti-histone H4 (06–866; Millipore), rabbit anti-human H3K36me3 (ab9050; Abcam), rabbit anti-human H3K79me1 (ab2621; Abcam), rabbit anti-human H3K79me2 (ab3594; Abcam), rabbit anti-human H3K9me1 (ab8896; Abcam), rabbit anti-human H3K9me3 (ab8898; Abcam), rabbit anti-human H3K20me1 (ab9051; Abcam), rabbit anti-human H3K27me1 (07–448; Millipore), rabbit anti-human H3K27me2 (07–452; Millipore), and rabbit anti-human H3K27me3 (07–449; Millipore).
Cells were monodispersed using trypsin-EDTA solution (0.05% [wt/vol]) followed by two washes with medium. Formaldehyde cross-linking was performed at 1% for 10 minutes at room temperature. Fixed cells were lysed and then sonicated using a Bioruptor water bath sonicator (Diagenode, Inc., Sparta, NJ, http://www.diagenode.com) for a total of 10 cycles (30 seconds on and 30 seconds off) to obtain chromatin fragments of approximately 500 base pairs. Diluted chromatin equivalent to 5 millions cells was used for each immunoprecipitation. Purified ChIP DNA from input and antibody-bound chromatin was analyzed by qPCR. Cycle thresholds of individual ChIP assay were first normalized by input DNA to correct for differential primer efficiencies and fold enrichments were calculated relative to normal rabbit IgG.
Forward (F) and reverse (R) primers and 6-carboxyfluorescein (6FAM)-labeled probes (P) used for qPCR displayed 5′ to 3′ were: hINS–275(F) TGTGAGCAGGGACAGGTCTG; hINS–275(R) TCCTCAGGACCAGCGGG; hINS–275(P) 6FAM-CC ACCGGGCCCCTGGTTAAGACTCTA; hINS+5(F) TCAGAA GAGGCCATCAAGCA; hINS+5(R) GTCCAGCCACCCTGGAA TC; hINS+5(P) 6FAM-TTCCAAGGGCCTTTGCGTCAGG; hINS+1318(F) CAGCTGGAGAACTACTGCAACTAGA;hINS+1318(R) GCTGGTTCAAGGGCTTTATTCC; hINS+1318(P) 6FAM-CCGCCTCCTGCACCGAGAGAGA; hGCG–207(F) CTT AAGTGATTTTCATGCGTGATTG; hGCG–207(R) TGGGA ATGGAGAGAGCAGCTT; hGCG–207(P) 6FAM-AAGTAGAAGGTGGATTTC; hGCG+297(F) CACAGAGAGGAACTGAGATGGAAA; hGCG+297(R) GCTTTGCGGCTTCGCTATAT; hGCG+297(P) 6FAM-AATGCATTTACGTGTACTTT;hGCG+3142(F) GACACAGAGGAGAAATCCAGGTATTAA; hGCG+3142(R) CAGGCTTTATTCCAACCATATTGA; hGCG+3142(P) 6FAM-CCGTAGTCTCGAACTAA.
Micrococcal Nuclease Accessibility
Micrococcal nuclease accessibility assays were adapted from Rao et al. [28]. hIPCs were cultured to confluence and harvested. Approximately 5 × 10⁵ cells were used for each reaction. Nuclei were collected in 5 ml lysis buffer (10 mM Tris-HCl, pH 7.4; 10 mM NaCl; 3 mM MgCl2; 0.5% Nonidet P-40; 0.15 mM spermine; 0.5 mM spermidine), and digested with 50, 200, or 1,000 milliunits of micrococcal nuclease (Sigma-Aldrich, St. Louis, MO http://www.sigmaaldrich.com) in 1 ml digestion buffer (10 mM Tris-HCl, pH 7.4; 4 mM MgCl2; 1 mM CaCl2; 0.32 M sucrose) for 5 minutes at room temperature. Digestion was stopped by addition of 200 μl stop solution (2% SDS; 20 mM EDTA; 0.7 mg/ml proteinase K; 0.45 mg/ml glycogen; 0.45 ng/μl enhanced green fluorescent protein plasmid) and incubation for 2 hours in a 37°C water bath. The DNA was then extracted by phenol/chloroform/isoamyl alcohol and precipitated with ethanol. The DNA pellet was washed with 70% ethanol, dissolved in 20 μl nuclease-free water, and analyzed by qPCR targeting INS or GCG promoters using primer/probe sets hINS −275 and hGCG −207 described above.
Statistical Analysis
When appropriate, results are reported as means and standard deviations of each set of data. Comparisons between groups were made using the Student's t test assuming equal variances. A p value < .05 was considered statistically significant.
Results
PDX1, MAFA, and NEUROD1 are expressed in β cells of human islets and are known to play key roles in insulin gene transcription. With the goal of activating insulin gene transcription, expanded populations of hIPCs not expressing detectable INS transcript were infected with adenoviruses expressing mouse Mafa (Ad-Mafa), rat Neurod1 (Ad-Neurod1), and mouse Pdx1 (Ad-Pdx1) (Fig. 1). Infection with the three adenoviruses increased mRNAs for the rodent transcription factors to levels higher than the levels of the corresponding factors in fresh human islets: 4-fold higher for Mafa, 5-fold for Neurod1, and 64-fold for Pdx1. Expression of these three TFs, alone or in combination, had no effect on the levels of INS mRNA. In contrast, Mafa or Pdx1 alone, but not Neurod1, increased GCG mRNA levels by 10- to 100-fold and the combination of all three TFs increased GCG mRNA by more than 100,000-fold. The effect of the three TFs on GCG transcript levels was dependent on the MOI of adenoviruses, with MOIs of 10 for each adenovirus increasing GCG mRNA more than 1,000-fold, whereas maximum increases of more than 100,000-fold were attained with MOIs of 50 or greater (not shown). Expression of these three TFs in combination did not increase the levels of somatostatin or pancreatic polypeptide mRNAs (not shown).
Figure 1.
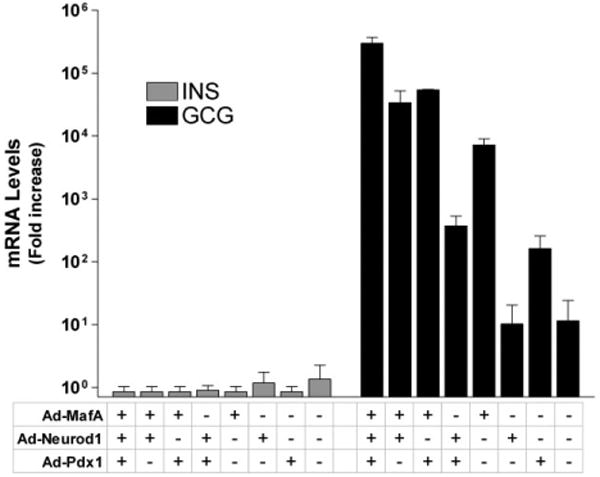
Overexpression of Mafa, Neurod1, and Pdx1 fails to activate the endogenous insulin gene but activates the endogenous glucagon gene in hIPCs. hIPCs were infected at a multiplicity of infection of 150 each for adenoviral constructs Ad-Mafa, Ad-Neurod1, and Ad-Pdx1 individually and in combination. After 4 days in monolayer cultures in serum-free medium, transcript levels for INS and GCG were determined and are presented as fold change over values in cells prior to infection ± SD from two experiments with duplicate wells. Abbreviations: Ad-Mafa, adenovirus expressing mouse V-maf musculoaponeurotic fibrosarcoma oncogene homolog A; Ad-Neurod1, adenovirus expressing rat neurogenic differentiation 1; Ad-Pdx1, adenovirus expressing mouse pancreatic and duodenal homeobox factor 1; GCG, glucagon; INS, insulin.
To determine whether these findings were specific for hIPCs, we infected hBM-MSCs with Ad-Mafa, Ad-Neurod1, and Ad-Pdx1 (Fig. 2). As in hIPCs, expression of the three TFs in hBM-MSCs did not increase INS mRNA but increased GCG mRNA by more than 100,000-fold.
Figure 2.

Overexpression of mouse V-maf musculoaponeurotic fibrosarcoma oncogene homolog A (Mafa), neurogenic differentiation 1 (Neurod1), and pancreatic and duodenal homeobox factor 1 (Pdx1) activates the endogenous glucagon gene in human bone marrow-derived mesenchymal stem cells (hBM-MSCs). Transcript levels for INS and GCG in hBM-MSCs after 4–6 days in serum-free medium following infection at 50 or 100 multiplicity of infection (MOI) with each of the three adenovirus vectors expressing mouse Mafa (Ad-Mafa), rat Neurod1 (Ad-Neurod1), and mouse Pdx1 (Ad-Pdx1) or with 150 or 300 MOI Ad-GFP. Bars represent the fold change ± SD over the average value in cells prior to infection in three experiments performed with two or three replicates. Abbreviations: AdGFP, adenovirus expressing green fluorescent protein; AdMNP, Ad-Mafa, Ad-Neurod1, and Ad-Pdx1; GCG, glucagon; INS, insulin.
To determine whether failure of INS mRNA to increase in response to expression of the three TFs was due to lack of another factor(s) necessary for INS gene transcription, we used Ad-RIP/GFP (Fig. 3). Although hIPCs infected with Ad-RIP/GFP alone exhibited no expression of GFP, 44% of cells coinfected with Ad-RIP/GFP, Ad-Mafa, and Ad-Pdx1 expressed GFP. This was similar to the fraction of cells expressing GFP under the control of the powerful cytomegalovirus promoter when hIPCs were infected with Ad-GFP. These results show that an exogenous INS gene promoter could be activated by ectopic expression of the TFs in the same cells in which the endogenous promoter could not be activated and are consistent with the idea that epigenetic changes may block transcription from the endogenous gene.
Figure 3.

Overexpression of mouse V-maf musculoaponeurotic fibrosarcoma oncogene homolog A (Mafa) and pancreatic and duodenal homeobox factor 1 (Pdx1) activates an ectopic insulin promoter construct in human islet-derived precursor cells (hIPCs). Fluorescence profiles of hIPCs infected with 100 multiplicity of infection each of (A) adenoviruses expressing mouse Mafa (Ad-Mafa) and mouse Pdx1 (Ad-Pdx1); (B) adenovirus expressing rat insulin promoter/green fluorescent protein (Ad-RIP/GFP); (C) Ad-GFP, Ad-Mafa, and Ad-Pdx1; and (D) Ad-RIP/GFP, Ad-Mafa, and Ad-Pdx1. Cells were collected for cytometric analysis 3 days after infection. Data are representative of two experiments. Adenovirus expressing neurogenic differentiation 1 was not included in these experiments because this adenovirus construct coexpresses GFP. Abbreviations: FL1-H, peak height of fluorescent detector 1 signal.
To begin to delineate the posttranslational chromatin modifications that are present on the INS and GCG genes in hIPCs, we determined the acetylation and methylation patterns of several lysine residues on histones H3 and H4 (Fig. 4). We compared these patterns in hIPCs to those present in human islets and in hBM-MSCs. Figure 4A illustrates the histone modifications within the promoter, exon 1, and exon 3 regions of the INS gene [25] in islets, hIPCs, and hBM-MSCs. For histone modifications that are usually associated with actively transcribing genes (“activatory marks”), the enrichment of these marks on the INS gene was greater in islets than in hIPCs and greater in hIPCs than in hBM-MSCs. For histone modifications usually associated with repressed genes (“repressive marks”), the enrichment on the INS gene was generally similar in hIPCs and BM-MSCs and was greater than in islets. Figure 4B illustrates histone modifications within the promoter, intron 1, and exon 2 regions of the GCG gene. For activatory marks on the GCG gene, there was more enrichment in islets than in hIPCs or hBM-MSCs but the differences between hIPCs and hBM-MSCs were smaller than for the INS gene. For repressive marks on the GCG gene, hIPCs were more enriched than islets and generally modestly more enriched than hBM-MSCs. Most importantly, regions of the INS and GCG genes in hIPCs have similar levels of activation-associated modifications but the INS gene has higher levels of repression-associated modifications than the GCG gene.
Figure 4.
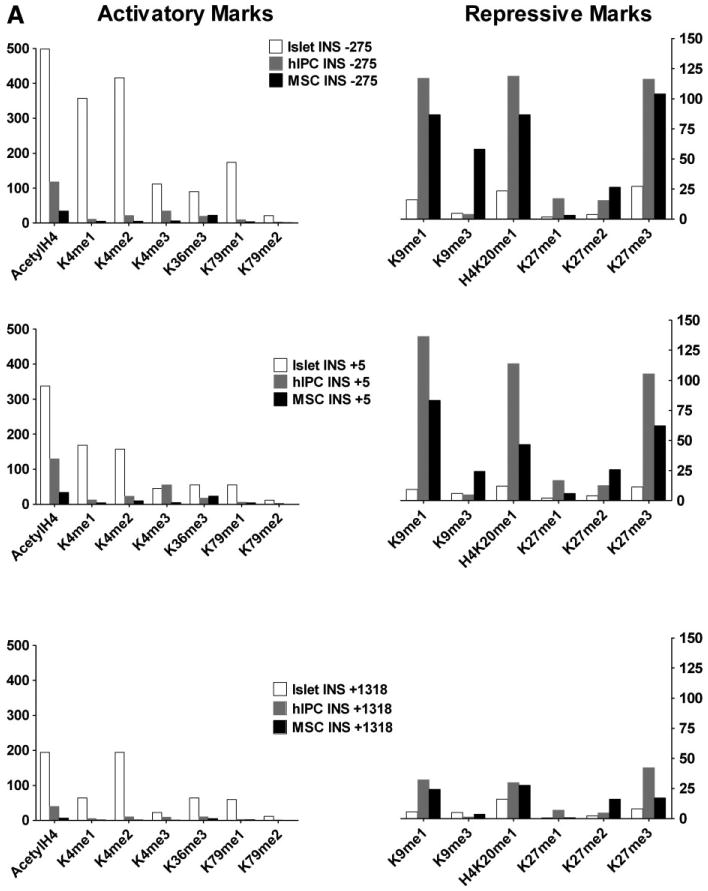
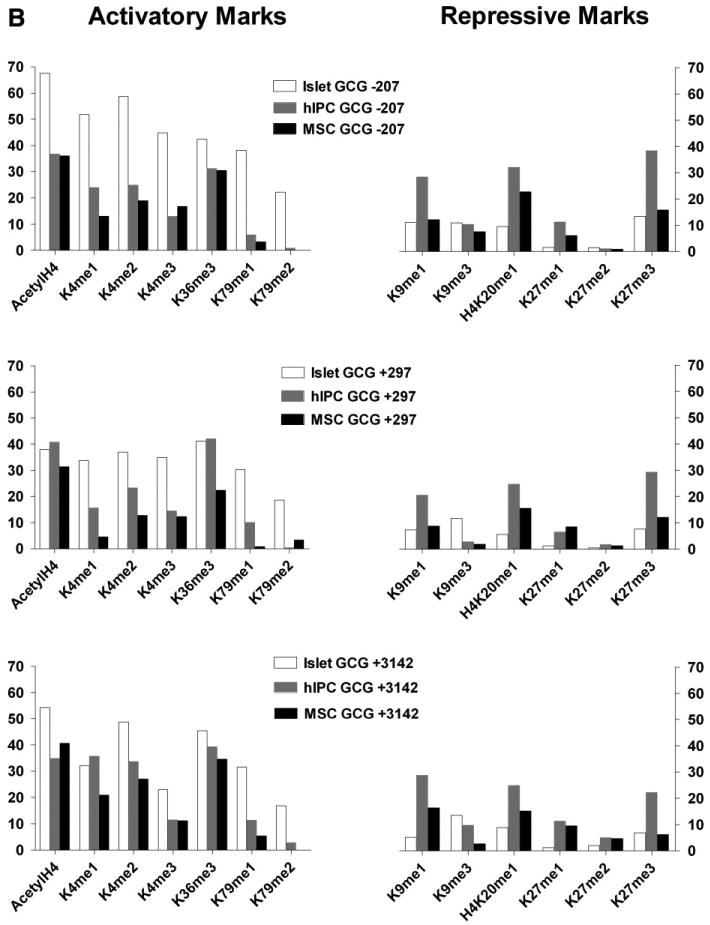
Chromatin immunoprecipitation analysis of histone modifications in human islets, hIPCs, and human bone marrow-derived MSCs. (A): Activatory and repressive marks over the promoter (−275), exon 1 (+5), and exon 3 (+1318) of the INS gene. (B): Activatory and repressive marks over the promoter (−207), intron 1 (+297), and exon 2 (+3142) of the GCG gene. Activatory marks were acetylated histone H4 (AcetylH4), histone H3 lysine (lys)-4 monomethylation (K4me1), histone H3 lys-4 dimethylation (K4me2), histone H3 lys-4 trimethylation (K4me3), histone H3 lys-36 trimethylation (K36me3), histone H3 lys-79 monomethylation (K79me1), and histone H3 lys-79 dimethylation (K79me2). Repressive marks were histone H3 lys-9 monomethylation (K9me1), histone H3 lys-9 trimethylation (K9me3), histone H4 lys-20 monomethylation (H4K20me1), histone H3 lys-27 monomethylation (K27me1), histone H3 lys-27 dimethylation (K27me2), and histone H3 lys-27 trimethylation (K27me3). The data represent measurements in one of two experiments. Abbreviations: GCG, glucagon; hIPC, human islet-derived precursor cells; INS, insulin; MSC, mesenchymal stem cell.
Because repressive chromatin marks are associated with denser packing of histone proteins and thereby decrease the accessibility to the underlying genes [29], we compared accessibility of the INS and GCG promoters by micrococcal nuclease digestion of nuclei extracted from hIPCs (Fig. 5). Digestion of hIPC nuclei with 200 or 1,000 milliunits of micrococcal nuclease led to less degradation of chromatin DNA within the INS gene promoter than within the GCG gene promoter. This observation that the INS promoter region was less accessible to digestion than the GCG promoter region suggested that the INS promoter might be less accessible for binding of TF proteins than the GCG promoter.
Figure 5.
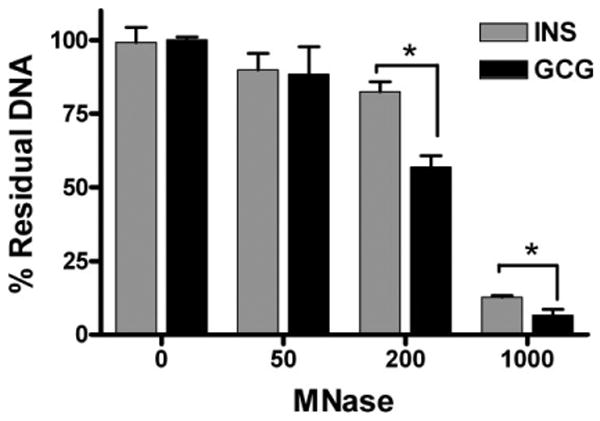
The INS gene promoter is less accessible than the GCG gene promoter in human islet-derived precursor cells (hIPCs) to digestion by micrococcal nuclease. Nuclei from hIPCs were digested with several concentrations of MNase and the residual intact DNA within the INS and GCG promoters was quantified by reverse-transcription polymerase chain reaction. The bars represent the mean ± SD of triplicate determinations in a representative of three experiments. Asterisks indicate p values < .05. Abbreviations: GCG, glucagon; hIPC, human islet-derived precursor cells; INS, insulin; MNase, micrococcal nuclease.
To test directly whether the INS promoter was less accessible to TF binding than the GCG promoter, hIPCs were infected with Ad-Mafa, Ad-Neurod1, and Ad-Pdx1 and binding of the TFs to the INS and GCG promoters was determined by ChIP (Fig. 6). hIPCs infected with Ad-GFP served as controls for binding by endogenous TFs. There were 20- to 25-fold greater enrichments of binding by Pdx1 and Mafa to the GCG promoter than to the INS promoter. There was only a twofold greater binding of Neurod1 to the GCG promoter than to the INS promoter but this finding may be attributed to poor precipitating activity of the anti-Neurod1 antibody. Thus, the GCG gene promoter was more accessible than the INS promoter for TF binding.
Figure 6.
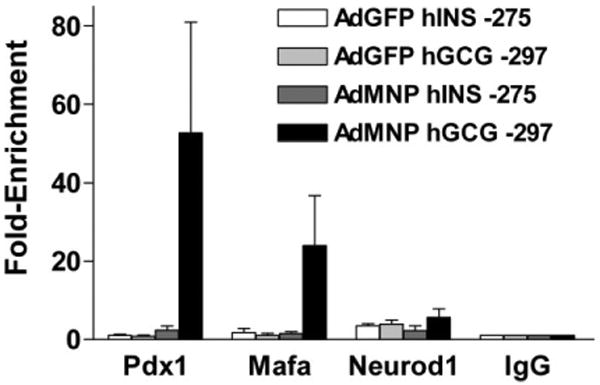
Overexpressed Pdx1 and Mafa associate with the GCG but not with the insulin gene promoters in human islet-derived precursor cells (hIPCs). hIPCs were infected with 100 multiplicity of infection (MOI) each of adenoviruses expressing mouse Mafa (Ad-Mafa), rat Neurod1 (Ad-Neurod1), and mouse Pdx1 (Ad-Pdx1) or with 300 MOI of Ad-GFP. After 4 days in monolayer culture in serum-free medium, cells were processed for chromatin immunoprecipitation assays using antibodies to mouse Pdx1, mouse Mafa, or rat Neurod1. The presence of a selected region of the INS and GCG gene promoters in precipitated chromatin DNA was assessed by quantitative polymerase chain reaction. Results are expressed as fold enrichment ± SD of the promoter DNA in chromatin precipitated by the specific antibodies compared with nonspecific IgG. The data represent the results from three experiments. Abbreviations: AdGFP, adenovirus expressing green fluorescent protein; AdMNP, Ad-Mafa, Ad-Neurod1, and Ad-Pdx1; hGCG, human glucagon; hINS, human insulin; Mafa, mouse V-maf musculoaponeurotic fibrosarcoma oncogene homolog A; Neurod1, neurogenic differentiation 1; Pdx1, pancreatic and duodenal homeobox factor 1.
Discussion
In this manuscript, we show that overexpression of three TFs that are important activators of the INS gene in the adult islet [12, 30] cannot activate INS gene transcription in hIPCs and hBM-MSCs but robustly increase GCG mRNA levels in both of these human mesenchymal cell types. The two more effective TFs are Mafa and Pdx1, whereas Neurod1 has no effect by itself but has a small effect when expressed in combination with Mafa and Pdx1. Other investigators have reported increases in INS mRNA levels when they have ectopically expressed Pdx1 in human MSCs [31–33]. However, in these reports the increases in INS mRNA levels were small. Previous studies of the effect of overexpression of Pdx1 on GCG gene expression have reached contradictory conclusions. Kawasaki et al. [34] reported that Pdx1 increased GCG mRNA levels in two different hepatocyte preparations derived from rat livers, whereas Ritz-Laser et al. [35] and Wang et al. [36] found that Pdx1 decreases GCG mRNA levels in the hamster glucagonoma cell line InR1G9 and a subclone of the rat insulinoma cell line INS-1 that expresses GCG in addition to INS, respectively. The effects of members of the Maf family on INS and GCG gene transcription are more clear. Mafa is an effective activator of INS gene transcription [37, 38] and Mafb is an effective activator of GCG gene transcription [39]. However, because of the similarities among members of this family, there may be activation of INS and GCG genes when Maf family members are expressed ectopically [40]. Although we are not aware of any reports describing the effects of overexpression of Neurod1 alone, Song et al. [41] reported that ectopic expression of Neurod1, Mafa, and neurogenin 3 caused increases in GCG mRNA levels in the livers of mice. Thus, although our observations with overexpression of Pdx1 and Mafa in human mesenchymal cells are not necessarily indicative of their physiologic effects, this approach provides a way to explore regulation of the INS and GCG genes in cells that have stem-like properties such as adult human MSCs [42].
Our finding that an ectopically expressed INS gene promoter was activated by expression of Pdx1 and Mafa (Fig. 3) suggested that their failure to activate the endogenous INS promoter was not caused by the absence of a critical positive factor or presence of an inhibitory factor. This led us to consider epigenetic modifications of the INS gene as the cause of unresponsiveness to overexpression of the three TFs. We reasoned that the ectopic rat insulin promoter in the Ad-RIP/GFP vector would not contain epigenetic modifications that might be responsible for repression of the endogenous INS promoter [43]. Histone modifications associated with actively transcribing genes, such as H3 and H4 hyperacetylation [6, 44–46] and H3K4 methylation [44, 47], have been shown to be present at higher levels on the INS promoter of βor β-like cells than in non-β cells. Indeed, a correlation between histone acetylation and H3K4 methylation over the INS gene promoter and active INS transcription has been made: H4 acetylation has been found to increase in β-like cells exposed to high glucose when INS gene transcription is increased [45, 46] and when Pdx1 is ectopically expressed and activates INS transcription in non-β cells [48]; increasing H3 and H4 acetylation by exposing β-like cells to the histone deacetylase inhibitor sodium butyrate increased INS gene occupancy and transcription by Pdx1 [6]; and decreasing Pdx1 by siRNA caused a decrease in INS gene transcription and of H3K4 dimethylation [47]. In contrast, we showed previously that the levels of H4 acetylation and H3K4 methylation were higher in hIPCs than in BM-MSCs but not as high as in human islet cells even though INS gene transcription was repressed [25]. In this report we extended the characterization of activatory marks over the INS gene in hIPCs to include H3K4 monomethylation and trimethylation, H3K36 trimethylation, and H3K79 monomethylation and dimethylation. For all the activatory marks we monitored, we found higher levels in human islet cells than in hIPCs and higher levels in hIPCs than in hBM-MSCs. Thus, hIPCs exhibited an increased level of activatory marks on the INS gene usually found in cells actively transcribing the INS gene even though INS was not expressed in these hIPCs.
In contrast to the reported studies of activatory marks, to our knowledge, the only report describing repressive histone marks on the INS gene is that by Mutskov et al. [25] in which we compared H3K9 dimethylation over the INS promoter, exon 1, and exon 3 in hIPCs to HeLa cells. HeLa cells exhibited much higher levels of H3K9 dimethylation in all regions of the INS gene than hIPCs. Herein, we show that the repressive marks, H3K9 monomethylation and trimethylation, H4K20 monomethylation, and H3K27 monomethylation, dimethylation, and trimethylation, over these regions of the INS gene are generally higher in hIPCs than in hBM-MSCs and substantially higher in both of these cell types than in human islets (Fig. 4A). These data are consistent with the idea that the INS gene is repressed in hIPCs (see below).
To our knowledge, chromatin modifications over the GCG gene have not been previously reported. However, global histone acetylation in rat INS-1 cells [49] and mouse BM-MSCs [50] has been found to be associated with increases in GCG mRNA levels. We found that activatory marks over the promoter, intron 1, and exon 3 of the GCG gene in hIPCs were not as enriched as in human islets but were generally higher than in hBM-MSCs. Of note, H4 acetylation levels in hIPCs were higher over the INS gene than over the GCG gene. Repressive marks were in general higher over the GCG gene in hIPCs than in hBM-MSCs and both were higher than in islets. Repressive marks in hIPCs were higher over the INS gene than over the GCG gene. The presence of both repressive and activatory marks over genes involved in development with higher repressive than activatory marks has been found in embryonic stem cells and may keep these genes in a silenced state but poised for activation [51]. As we suggested previously [25], a similar phenomenon may occur in hIPCs.
Histone modifications as described above appear to mediate in part changes in accessibility of nonhistone proteins to underlying genes [29]. At the INS gene, Francis et al. [6] have shown by resistance to micrococcal nuclease digestion that the proximal INS promoter region in mouse islets and a mouse insulinoma cell line (βTC3) is more accessible than in mouse pancreatic ductal cells (mPACs). Furthermore, the INS promoter is occupied by endogenous Pdx1 in both mouse islets and βTC3 cells but not in mPACs overexpressing Pdx1. These authors concluded that chromatin accessibility plays an important role in regulation of INS gene transcription. To our knowledge, there are no reports of chromatin accessibility studies involving the GCG gene. We found that the GCG promoter in hIPCs is more accessible to micrococcal nuclease digestion than the INS promoter (Fig. 5) and that in cells overexpressing Pdx1, Mafa, and Neurod1 that the GCG promoter, but not the INS promoter, is occupied by Pdx1 and Mafa (Fig. 6). These findings show that lack of accessibility to the INS promoter, at least in part, mediates the lack of TF activation in hIPCs.
Conclusion
We conclude that loss of basal expression and of activation by exogenous Pdx1, Mafa, and Neurod1 of the INS gene in hIPCs is caused by histone modifications leading to tight packing of chromatin that limits accessibility of nonhistone proteins. In contrast, the GCG gene does not undergo similar modifications and can be readily activated. The silencing of the INS gene by epigenetic mechanism(s) is likely a major mechanism to restrict INS expression to mature β cells in the adult. It will be necessary to overcome these epigenetic changes to use hIPCs as precursor cells to produce large number of insulin-expressing cells.
Acknowledgments
We thank Dr. Vesco Mutskov, National Institute of Diabetes and Digestive and Kidney Diseases (NIDDK), for critical reading of the manuscript and for helpful suggestions concerning ChIP methodology. This research was supported by the Intramural Research Program of the NIDDK, Project numbers Z01DK047046CEB and Z01DK047047CEB, NIH. L.M.W. and S.H.K.W. contributed equally to this work.
Footnotes
Author contributions: L.M.W., S.H.K.W., N.Y., and E.G.-R.: collection and assembly of data, data analysis and interpretation; B.M.R.: data analysis and interpretation, manuscript writing; M.C.G.: conception and design, data analysis and interpretation, manuscript writing.
Disclosure of Potential Conflicts of Interest: The authors indicate no potential conflicts of interest.
References
- 1.Shapiro AMJ, Lakey JRT, Ryan EA, et al. Islet transplantation in seven patients with type 1 diabetes mellitus using a glucocorticoid-free immunosuppressive regimen. New Engl J Med. 2000;343:230–238. doi: 10.1056/NEJM200007273430401. [DOI] [PubMed] [Google Scholar]
- 2.Ryan EA, Paty BW, Senior PA, et al. Five-year follow-up after clinical islet transplantation. Diabetes. 2005;54:2060–2069. doi: 10.2337/diabetes.54.7.2060. [DOI] [PubMed] [Google Scholar]
- 3.Gershengorn MC, Hardikar AA, Wei C, et al. Epithelial-to-mesenchymal transition generates proliferative human islet precursor cells. Science. 2004;306:2261–2264. doi: 10.1126/science.1101968. [DOI] [PubMed] [Google Scholar]
- 4.Davani B, Ikonomou L, Raaka BM, et al. Human islet-derived precursor cells are mesenchymal stromal cells that differentiate and mature to hormone-expressing cells in vivo. Stem Cells. 2007;25:3215–3222. doi: 10.1634/stemcells.2007-0323. [DOI] [PubMed] [Google Scholar]
- 5.Lande-Diner L, Cedar H. Silence of the genes[em]mechanisms of long-term repression. Nat Rev Genet. 2005;6:648–654. doi: 10.1038/nrg1639. [DOI] [PubMed] [Google Scholar]
- 6.Francis J, Babu DA, Deering TG, et al. Role of chromatin accessibility in the occupancy and transcription of the insulin gene by the pancreatic and duodenal homeobox factor 1. Mol Endocrinol. 2006;20:3133–3145. doi: 10.1210/me.2006-0126. [DOI] [PMC free article] [PubMed] [Google Scholar]
- 7.Martin C, Zhang Y. The diverse functions of histone lysine methylation. Nat Rev Mol Cell Biol. 2005;6:838–849. doi: 10.1038/nrm1761. [DOI] [PubMed] [Google Scholar]
- 8.Gopalakrishnan S, Van Emburgh BO, Robertson KD. DNA methylation in development and human disease. Mutat Res. 2008;647:30–38. doi: 10.1016/j.mrfmmm.2008.08.006. [DOI] [PMC free article] [PubMed] [Google Scholar]
- 9.Edlund T, Walker MD, Barr PJ, et al. Cell-specific expression of the rat insulin gene: Evidence for role of two distinct 5′ flanking elements. Science. 1985;230:912–916. doi: 10.1126/science.3904002. [DOI] [PubMed] [Google Scholar]
- 10.Philippe J, Drucker DJ, Knepel W, et al. Alpha-cell-specific expression of the glucagon gene is conferred to the glucagon promoter element by the interactions of DNA-binding proteins. Mol Cell Biol. 1988;8:4877–4888. doi: 10.1128/mcb.8.11.4877. [DOI] [PMC free article] [PubMed] [Google Scholar]
- 11.Hay CW, Docherty K. Comparative analysis of insulin gene promoters: Implications for diabetes research. Diabetes. 2006;55:3201–3213. doi: 10.2337/db06-0788. [DOI] [PubMed] [Google Scholar]
- 12.Melloul D, Marshak S, Cerasi E. Regulation of insulin gene transcription. Diabetologia. 2002;45:309–326. doi: 10.1007/s00125-001-0728-y. [DOI] [PubMed] [Google Scholar]
- 13.Guz Y, Montminy MR, Stein R, et al. Expression of murine STF-1, a putative insulin gene transcription factor, in β cells of pancreas, duodenal epithelium and pancreatic exocrine and endocrine progenitors during ontogeny. Development. 1995;121:11–18. doi: 10.1242/dev.121.1.11. [DOI] [PubMed] [Google Scholar]
- 14.Jonsson J, Ahlgren U, Edlund T, et al. IPF1, a homeodomain protein with a dual function in pancreas development. Int J Dev Biol. 1995;39:789–798. [PubMed] [Google Scholar]
- 15.Stoffers DA, Zinkin NT, Stanojevic V, et al. Pancreatic agenesis attributable to a single nucleotide deletion in the human IPF1 gene coding sequence. Nat Genet. 1997;15:106–110. doi: 10.1038/ng0197-106. [DOI] [PubMed] [Google Scholar]
- 16.Ahlgren U, Jonsson J, Jonsson L, et al. beta-cell-specific inactivation of the mouse Ipf1/Pdx1 gene results in loss of the beta-cell phenotype and maturity onset diabetes. Genes Dev. 1998;12:1763–1768. doi: 10.1101/gad.12.12.1763. [DOI] [PMC free article] [PubMed] [Google Scholar]
- 17.Naya FJ, Stellrecht CMM, Tsai MJ. Tissue-specific regulation of the insulin gene by a novel basic helix-loop-helix transcription factor. Genes Dev. 1995;9:1009–1019. doi: 10.1101/gad.9.8.1009. [DOI] [PubMed] [Google Scholar]
- 18.Naya FJ, Huang HP, Qiu Y, et al. Diabetes, defective pancreatic morphogenesis, and abnormal enteroendocrine differentiation in BETA2/NeuroD-deficient mice. Genes Dev. 1997;11:2323–2334. doi: 10.1101/gad.11.18.2323. [DOI] [PMC free article] [PubMed] [Google Scholar]
- 19.Sharma A, Fusco-DeMane D, Henderson E, et al. The role of the insulin control element and RIPE3b1 activators in glucose-stimulated transcription of the insulin gene. Mol Endocrinol. 1995;9:1468–1476. doi: 10.1210/mend.9.11.8584024. [DOI] [PubMed] [Google Scholar]
- 20.Kataoka K, Han SI, Shioda S, et al. MafA is a glucose-regulated and pancreatic β-cell-specific transcriptional activator for the insulin gene. J Biol Chem. 2002;277:49903–49910. doi: 10.1074/jbc.M206796200. [DOI] [PubMed] [Google Scholar]
- 21.Olbrot M, Rud J, Moss LG, et al. Identification of beta-cell-specific insulin gene transcription factor RIPE3b1 as mammalian MafA. Proc Natl Acad Sci U S A. 2002;99:6737–6742. doi: 10.1073/pnas.102168499. [DOI] [PMC free article] [PubMed] [Google Scholar]
- 22.Zhang C, Moriguchi T, Kajihara M, et al. MafA is a key regulator of glucose-stimulated insulin secretion. Mol Cell Biol. 2005;25:4969–4976. doi: 10.1128/MCB.25.12.4969-4976.2005. [DOI] [PMC free article] [PubMed] [Google Scholar]
- 23.de la Tour D, Halvorsen T, Demeterco C, et al. Beta-cell differentiation from a human pancreatic cell line in vitro and in vivo. Mol Endocrinol. 2001;15:476–483. doi: 10.1210/mend.15.3.0604. [DOI] [PubMed] [Google Scholar]
- 24.Ferber S, Halkin A, Cohen H, et al. Pancreatic and duodenal homeobox gene 1 induces expression of insulin genes in liver and ameliorates streptozotocin-induced hyperglycemia. Nat Med. 2000;6:568–572. doi: 10.1038/75050. [DOI] [PubMed] [Google Scholar]
- 25.Mutskov V, Raaka BM, Felsenfeld G, et al. The human insulin gene displays transcriptionally active epigenetic marks in islet-derived mesenchymal precursor cells in the absence of insulin expression. Stem Cells. 2007;25:3223–3233. doi: 10.1634/stemcells.2007-0325. [DOI] [PubMed] [Google Scholar]
- 26.Heremans Y, Van De Casteele M, In't Veld P, et al. Recapitulation of embryonic neuroendocrine differentiation in adult human pancreatic duct cells expressing neurogenin 3. J Cell Biol. 2002;159:303–311. doi: 10.1083/jcb.200203074. [DOI] [PMC free article] [PubMed] [Google Scholar]
- 27.Meyer K, Irminger JC, Moss LG, et al. Sorting human beta-cells consequent to targeted expression of green fluorescent protein. Diabetes. 1998;47:1974–1977. doi: 10.2337/diabetes.47.12.1974. [DOI] [PubMed] [Google Scholar]
- 28.Rao S, Procko E, Shannon MF. Chromatin remodeling, measured by a novel real-time polymerase chain reaction assay, across the proximal promoter region of the IL-2 gene. J Immunol. 2001;167:4494–4503. doi: 10.4049/jimmunol.167.8.4494. [DOI] [PubMed] [Google Scholar]
- 29.Kouzarides T. Chromatin modifications and their function. Cell. 2007;128:693–705. doi: 10.1016/j.cell.2007.02.005. [DOI] [PubMed] [Google Scholar]
- 30.Miyatsuka T, Matsuoka TA, Kaneto H. Transcription factors as therapeutic targets for diabetes. Expert Opin Ther Targets. 2008;12:1431–1442. doi: 10.1517/14728222.12.11.1431. [DOI] [PubMed] [Google Scholar]
- 31.Moriscot C, de Fraipont F, Richard MJ, et al. Human bone marrow mesenchymal stem cells can express insulin and key transcription factors of the endocrine pancreas developmental pathway upon genetic and/or microenvironmental manipulation in vitro. Stem Cells. 2005;23:594–603. doi: 10.1634/stemcells.2004-0123. [DOI] [PubMed] [Google Scholar]
- 32.Li Y, Zhang R, Qiao H, et al. Generation of insulin-producing cells from PDX-1 gene-modified human mesenchymal stem cells. J Cell Physiol. 2007;211:36–44. doi: 10.1002/jcp.20897. [DOI] [PubMed] [Google Scholar]
- 33.Karnieli O, Izhar-Prato Y, Bulvik S, et al. Generation of insulin-producing cells from human bone marrow mesenchymal stem cells by genetic manipulation. Stem Cells. 2007;25:2837–2844. doi: 10.1634/stemcells.2007-0164. [DOI] [PubMed] [Google Scholar]
- 34.Kawasaki H, Mizuguchi T, Oshima H, et al. Efficient transformation of small hepatocytes into insulin-expressing cells by forced expression of Pdx1. J Hepatobiliary Pancreat Surg. 2008;15:403–409. doi: 10.1007/s00534-007-1318-2. [DOI] [PubMed] [Google Scholar]
- 35.Ritz-Laser B, Gauthier BR, Estreicher A, et al. Ectopic expression of the beta-cell specific transcription factor Pdx1 inhibits glucagon gene transcription. Diabetologia. 2003;46:810–821. doi: 10.1007/s00125-003-1115-7. [DOI] [PubMed] [Google Scholar]
- 36.Wang H, Maechler P, Ritz-Laser B, et al. Pdx1 level defines pancreatic gene expression pattern and cell lineage differentiation. J Biol Chem. 2001;276:25279–25286. doi: 10.1074/jbc.M101233200. [DOI] [PubMed] [Google Scholar]
- 37.Wang H, Brun T, Kataoka K, et al. MAFA controls genes implicated in insulin biosynthesis and secretion. Diabetologia. 2007;50:348–358. doi: 10.1007/s00125-006-0490-2. [DOI] [PMC free article] [PubMed] [Google Scholar]
- 38.Matsuoka TA, Kaneto H, Stein R, et al. MafA regulates expression of genes important to islet β-cell function. Mol Endocrinol. 2007;21:2764–2774. doi: 10.1210/me.2007-0028. [DOI] [PubMed] [Google Scholar]
- 39.Artner I, Le Lay J, Hang Y, et al. An activator of the glucagon gene expressed in developing islet α- and β-cells. Diabetes. 2006;55:297–304. doi: 10.2337/diabetes.55.02.06.db05-0946. [DOI] [PubMed] [Google Scholar]
- 40.Matsuoka TA, Zhao L, Artner I, et al. Members of the large Maf transcription family regulate insulin gene transcription in islet beta cells. Mol Cell Biol. 2003;23:6049–6062. doi: 10.1128/MCB.23.17.6049-6062.2003. [DOI] [PMC free article] [PubMed] [Google Scholar]
- 41.Song YD, Lee EJ, Yashar P, et al. Islet cell differentiation in liver by combinatorial expression of transcription factors neurogenin-3, BETA2, and RIPE3b1. Biochem Biophys Res Commun. 2007;354:334–339. doi: 10.1016/j.bbrc.2006.12.216. [DOI] [PubMed] [Google Scholar]
- 42.Baksh D, Song L, Tuan RS. Adult mesenchymal stem cells: characterization, differentiation, and application in cell and gene therapy. J Cell Mol Med. 2004;8:301–316. doi: 10.1111/j.1582-4934.2004.tb00320.x. [DOI] [PMC free article] [PubMed] [Google Scholar]
- 43.Mutskov V, Felsenfeld G. Silencing of transgene transcription precedes methylation of promoter DNA and histone H3 lysine 9. EMBO J. 2004;23:138–149. doi: 10.1038/sj.emboj.7600013. [DOI] [PMC free article] [PubMed] [Google Scholar]
- 44.Chakrabarti SK, Francis J, Ziesmann SM, et al. Covalent histone modifications underlie the developmental regulation of insulin gene transcription in pancreatic beta cells. J Biol Chem. 2003;278:23617–23623. doi: 10.1074/jbc.M303423200. [DOI] [PubMed] [Google Scholar]
- 45.Mosley AL, Corbett JA, Ozcan S. Glucose regulation of insulin gene expression requires the recruitment of p300 by the beta-cell-specific transcription factor Pdx-1. Mol Endocrinol. 2004;18:2279–2290. doi: 10.1210/me.2003-0463. [DOI] [PubMed] [Google Scholar]
- 46.Mosley AL, Ozcan S. Glucose regulates insulin gene transcription by hyperacetylation of histone h4. J Biol Chem. 2003;278:19660–19666. doi: 10.1074/jbc.M212375200. [DOI] [PubMed] [Google Scholar]
- 47.Francis J, Chakrabarti SK, Garmey JC, et al. Pdx-1 links histone H3-Lys-4 methylation to RNA polymerase II elongation during activation of insulin transcription. J Biol Chem. 2005;280:36244–36253. doi: 10.1074/jbc.M505741200. [DOI] [PMC free article] [PubMed] [Google Scholar]
- 48.Wang HW, Breslin MB, Lan MS. Pdx-1 modulates histone H4 acetylation and insulin gene expression in terminally differentiated alpha-TC-1 cells. Pancreas. 2007;34:248–253. doi: 10.1097/01.mpa.0000250136.72273.d7. [DOI] [PubMed] [Google Scholar]
- 49.Kim SJ, Nian C, McIntosh CH. Glucose-dependent insulinotropic polypeptide and glucagon-like peptide-1 modulate beta-cell chromatin structure. J Biol Chem. 2009;284:12896–12904. doi: 10.1074/jbc.M809046200. [DOI] [PMC free article] [PubMed] [Google Scholar]
- 50.Tayaramma T, Ma B, Rohde M, et al. Chromatin-remodeling factors allow differentiation of bone marrow cells into insulin-producing cells. Stem Cells. 2006;24:2858–2867. doi: 10.1634/stemcells.2006-0109. [DOI] [PubMed] [Google Scholar]
- 51.Bernstein BE, Mikkelsen TS, Xie X, et al. A bivalent chromatin structure marks key developmental genes in embryonic stem cells. Cell. 2006;125:315–326. doi: 10.1016/j.cell.2006.02.041. [DOI] [PubMed] [Google Scholar]