

Abstract
Histological and molecular analysis of fracture healing in normal and diabetic animals showed significantly enhanced removal of cartilage in diabetic animals. Increased cartilage turnover was associated with elevated osteoclast numbers, a higher expression of genes that promote osteoclastogenesis, and diminished primary bone formation.
Introduction
Diminished bone formation, an increased incidence of nonunions, and delayed fracture healing have been observed in animal models and in patients with diabetes. Fracture healing is characterized by the formation of a stabilizing callus in which cartilage is formed and then resorbed and replaced by bone. To gain insight into how diabetes affects fracture healing, studies were carried out focusing on the impact of diabetes on the transition from cartilage to bone.
Materials and Methods
A low-dose treatment protocol of streptozotocin in CD-1 mice was used to induce a type 1 diabetic condition. After mice were hyperglycemic for 3 weeks, controlled closed simple transverse fractures of the tibia were induced and fixed by intramedullary pins. Histomorphometric analysis of the tibias obtained 12, 16, and 22 days after fracture was performed across the fracture callus at 0.5 mm proximal and distal increments using computer-assisted image analysis. Another group of 16-day samples were examined by μCT. RNA was isolated from a separate set of animals, and the expression of genes that reflect the formation and removal of cartilage and bone was measured by real-time PCR.
Results
Molecular analysis of collagen types II and X mRNA expression showed that cartilage formation was the same during the initial period of callus formation. Histomorphometric analysis of day 12 fracture calluses showed that callus size and cartilage area were also similar in normoglycemic and diabetic mice. In contrast, on day 16, callus size, cartilage tissue, and new bone area were 2.0-, 4.4-, and 1.5-fold larger, respectively, in the normoglycemic compared with the diabetic group (p < 0.05). Analysis of μCT images indicated that the bone volume in the normoglycemic animals was 38% larger than in diabetic animals. There were 78% more osteoclasts in the diabetic group compared with the normoglycemic group (p < 0.05) on day 16, consistent with the reduction in cartilage. Real-time PCR showed significantly elevated levels of mRNA expression for TNF-α, macrophage-colony stimulating factor, RANKL, and vascular endothelial growth factor-A in the diabetic group. Similarly, the mRNA encoding ADAMTS 4 and 5, major aggrecanases that degrade cartilage, was also elevated in diabetic animals.
Conclusions
These results suggest that impaired fracture healing in diabetes is characterized by increased rates of cartilage resorption. This premature loss of cartilage leads to a reduction in callus size and contributes to decreased bone formation and mechanical strength frequently reported in diabetic fracture healing.
Keywords: cartilage, diabetes, endochondral bone, fracture, hyperglycemia, osteoclast
Introduction
Type 1 Diabetes has as one of its complications a decrease in BMD and inadequate bone formation, resulting in osteopenia.(1,2) Serum alkaline phosphatase and osteocalcin levels are significantly lower in type 1 diabetic patients, indicative of reduced bone formation.(2,3) Diabetes has also been reported to increase bone resorption indicated by enhanced serum levels of type I collagen cross-linked carboxy-terminal telopeptide (ICTP) and urinary levels of deoxypyridinium cross-links.(2,4) The effect of os-teopenia is thought to contribute significantly to the increased risk of both hip and long bone fractures.(5–7) Furthermore, diabetes has been shown to significantly impair fracture healing. Case reports and clinical studies have reported delayed union or increased healing time in diabetic subjects compared with matched controls.(8,9)
One of the best-characterized animal models to study the impact of diabetes on bone in rats and mice is the induction of type 1 diabetes by streptozotocin. Treatment with streptozotocin stimulates a host response that leads to destruction of the pancreatic β cells, hypoinsulinemia, and hyperglycemia, with many features similar to type 1 diabetes.(10–12) Studies using this animal model show that there is a significant decrease in BMD, BMC, and serum osteocalcin levels in streptozotocin-induced diabetic animals.(13,14) Moreover, there is a 20% decrease in biomechanical strength in both femurs and tibias.(14,15) BB rats, which are spontaneously diabetic, show similar reductions in BMD, serum osteocalcin levels, and mechanical properties.(16,17) Long bone fractures of spontaneously diabetic or streptozotocin-induced diabetic animals exhibit smaller calluses with decreased bone formation, decreased proliferation, and differentiation of osteoblastic cells and a 2-fold reduction in the mechanical strength compared with matched controls.(18–21)
Although most studies have focused on bone, there also is evidence that diabetes impairs cartilage formation during fracture healing through decreased chondrocyte differentiation and proliferation.(19,20,22) Endochondral bone formation during fracture healing involves a complex process of coordinated spatiotemporal events. The formation of the supporting callus involves cartilage formation, which is a critical prerequisite to normal repair of long bones. Therefore, it is conceivable that diabetes negatively impacts fracture healing by affecting cartilage formation or resorption. To study further the impact of diabetes on fracture repair, we undertook a detailed histological and molecular analysis focusing specifically on the transition from cartilage to bone.
Materials and Methods
Induction of type 1 diabetes
The research was conducted in conformity with all Federal and USDA guidelines, as well as an Institutional Animal Care & Use Committee (IACUC)–approved protocol. Eight-week-old, male CD-1 mice purchased from Charles River Laboratories (Wilmington, MA, USA) were rendered diabetic by intraperitoneal injection of streptozotocin (40 mg/kg; Sigma, St Louis, MO, USA) in 10 mM citrate buffer daily for 5 days.(23) Control mice were treated identically with vehicle alone, 10 mM citrate buffer. Blood obtained from the tail was assessed daily for glucose levels (Accu-Chek; Roche Diagnostics, Indianapolis, IN, USA) for 1 week after the last injection and were considered to be diabetic when blood glucose levels exceeded 250 mg/dl in two consecutive measurements. In addition, glycosylated hemoglobin levels were measured at the time of death by Glyco-tek affinity chromatography (Helena Laboratories, Beaumont, TX, USA). Blood glucose levels of diabetic animals generally ranged from 300 to 550 mg/dl, with a mean of 411 mg/dl, and normoglycemic mice from 110 to 160 mg/dl, with a mean of 142 mg/dl. Glycosylated hemoglobin in diabetic animals ranged from 9.3% to 15.3% with a mean of 13.2%, whereas the values in normoglycemic mice ranged from 5.1% to 6.7%, with a mean of 6%.
Tibial fractures
All studies were performed on male mice that were diabetic for 3 weeks. A simple transverse closed fracture of the left tibia was performed as previously described.(24,25) Briefly, an incision was made on the medial aspect of the knee, and the articular surface of the tibia was exposed. Access to the medullary canal was gained with a 25-gauge needle, and a 27-gauge spinal needle was inserted for fixation. After closure of the incision, a fracture was created by blunt trauma. Any fractures not consistent with standardized placement criteria (mid-diaphyseal) or grossly comminuted were excluded. Animals were subsequently killed at 12, 16, and 22 days after fracture. Tibias were harvested, and most of the associated muscle and soft connective tissue was gently removed.
Histology and histomorphometric analysis
The tibias with a small amount of surrounding muscle and soft tissues were fixed for 72 h in cold 4% paraformaldehyde and decalcified for 2 weeks by incubation in cold Immunocal (Decal Corp., Congers, NY, USA). After decalcification, the internal fixation pin was removed, and tibias were embedded in paraffin, sectioned at 5 μm and prepared for staining. Sectioning and histomorphometric measurements were performed according to methodologies developed and validated in our laboratory.(26) Briefly cross-sectional transverse sections were sampled at five sites along the long axis of the bone including the fracture site itself, and 0.5 and 1.0 mm proximal and distal to the fracture site. The callus area, new bone, and cartilage area were measured in sections stained with H&E, Van Gieson/safranin-O, and safranin-O/fast green, respectively. The area of each tissue was assessed by computer-assisted image analysis using Image ProPlus software (Media Cybernetics, Silver Spring, MD, USA) as previously described.(27) Osteoclast formation was determined by counting the number of multinucleated, TRACP+ cells lining bone or cartilage as previously described.(27) For each data point, there were six to eight specimens. Measurements were made by one examiner under blinded conditions, with the results confirmed by a second examiner.
μCT and image analysis
Tibias from 11 diabetic and 9 normoglycemic mice at day 16 of healing were scanned individually using a desktop microcomputed tomography system (Scanco μCT40; Scanco Medical, Basserdorf, Switzerland). Scans were performed at 70 kVp and 114 mA, with a 200-ms integration time and an isotropic voxel size of 12 μm. The scan axis coincided nominally with the diaphyseal axis. The image data were analyzed using software provided by the system manufacturer to quantify the bone volume of the fracture callus. The first step in this analysis consisted of defining the outer boundary of the callus. This was done on every 12-μm-thick slice along the length of the callus. Noise reduction in the image data were achieved by applying a constrained, 3D Gaussian filter (sigma = 0.8, support = 1). A fixed, global threshold was chosen that represented the transition in X-ray attenuation between unmineralized and mineralized tissue.
Molecular markers of tissue degradation and synthesis
After death, fracture calluses from diabetic and control animals were carefully dissected from the tibia removing all muscle and noncallus tissue and immediately frozen in liquid nitrogen. Total RNA was extracted with Trizol (Life Technologies, Rockville, MD, USA) from pulverized frozen tissue and further purified by an RNAeasy MinElute cleanup kit (Qiagen, Valencia, CA, USA). The concentration and integrity of the extracted RNA was verified by 260 nm/280 nm spectrophotometry and denaturing agarose gel electrophoresis with ethidium bromide staining. The mRNA levels of mediators, ADAMTS-type metalloproteinases, MMP-13, and extracellular matrix molecules were assessed by real-time PCR using primers and probe sets purchased from Applied Biosystems (Foster City, CA, USA) as previously described.(28) For a given experiment RNA from nine tibias were combined, and TaqMan reagents were used for first-strand cDNA synthesis and amplification. Results were normalized with an 18S ribosomal primer and probe set. Each experiment was performed three times, and the results from the three separate experiments were combined to derive mean values. For a given gene, the expression for each group was set relative to the value obtained for the normoglycemic control animals on day 12.
Statistical analysis
Data were presented as means and the statistical analysis between diabetic and nondiabetic groups for a given parameter was established by Student's t-test, with p < 0.05 considered statistically significant. ANOVA with Scheffe's posthoc test was used to analyze changes within a group over time.
Results
Histomorphometric analysis of fracture callus cross-sectional area indicated that there was no significant difference between the diabetic and normoglycemic groups on day 12. However, on day 16, the fracture callus in the diabetic group was 2-fold smaller than the normoglycemic (p < 0.05; Fig. 1A). When the change in callus size was examined within a group no statistically significant differences were noted over time.
FIG. 1.
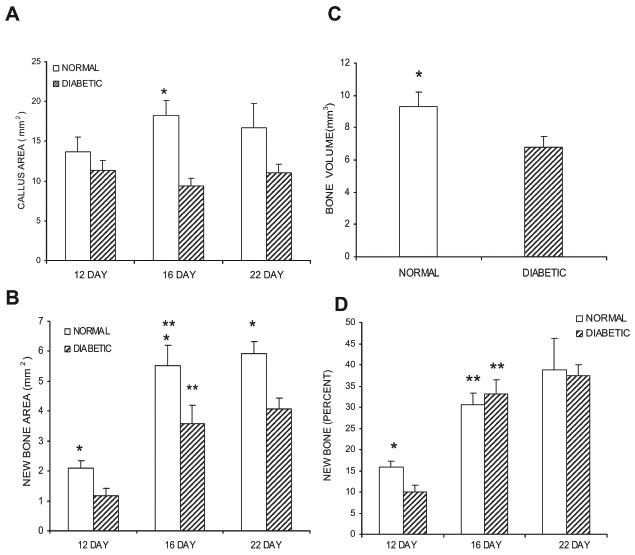
Comparison of callus size and new bone formation in diabetic and normoglycemic mice. (A) The callus was defined as the area within the peripheral fibrous capsule, excluding the original cortical bone. Callus area was measured in H&E-stained cross-sections obtained from five points sampled at 0.5-mm increments along a 2-mm length of the callus. The individual measurements were summed to establish a value of total callus area per animal for each of the three time-points examined. (B) The area of new bone within each callus was measured in the same manner in van Gieson/safranin-O–stained sections. The individual measurements were summed to establish a value for total new bone area per animal for each of the three time-points examined. (C) The total volume of bone on day 16 as measured from the μCT images. (D) Percentage of the callus consisting of newly formed bone. Data are expressed as mean ± SE. *Significant difference between normal and diabetic groups (p < 0.05). **Significant difference compared with the previous time-point within a group (p < 0.05).
To understand how diabetes affected the composition of the fracture callus bone and cartilage was assessed. Normoglycemic and diabetic mice showed a 2.6- to 3-fold increase in new bone accumulation in the calluses between days 12 and 16 (p < 0.05) after which new bone accumulation remained constant (Fig. 1B). The level of new bone accumulation in the diabetic group was significantly lower at each time-point ranging from 1.5 to 1.8 times less in the diabetic compared with normal control animals (Fig. 1B; p < 0.05). The difference in bone formation in the calluses of diabetic and normoglycemic groups on day 16 was confirmed by the μCT reconstructions. Bone volume calculated from the μCT images was 38% higher in the normoglycemic group compared with the diabetic group (p < 0.05; Fig. 1C). An assessment of the quantity of bone as a percentage of the total callus in histological sections showed that it was less in the diabetic group on day 12 (p < 0.05) but that at the two later time-points, the overall percentage of bone within the callus was similar in diabetics and normoglycemics (Fig. 1D).
During the initial phases of fracture healing endochondral bone formation provides rapid stabilization of the fracture site. The areas that are first formed as cartilage establish the spatial geometry of the callus and serve as templates on which new bone is formed. Cartilage area was measured in safranin-O/fast green–stained sections from diabetic and normal mice (Fig. 2A). Twelve days after fracture, there was a similar amount in both groups (p > 0.05), but on day 16, the diabetic group was significantly lower than the control group (p < 0.05). On day 22, the amount of total cartilage in both groups was small and similar (p > 0.05). When assessed over time, there was a large and significant reduction in cartilage area in the diabetic mice between days 12 and 16 (p < 0.05), whereas no significant reduction occurred over this time period in the normoglycemic animals. Cartilage area did decrease significantly in the control animals between days 16 and 22 (p < 0.05).
FIG. 2.
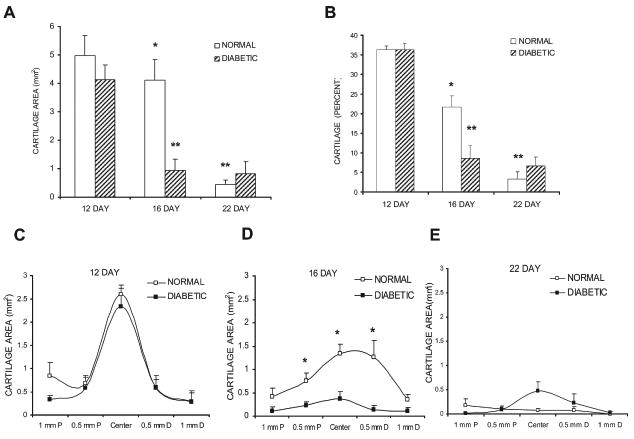
Comparison of cartilage area in diabetic and normoglycemic mice. (A) The area of cartilage within each callus was measured in safranin-O/fast green–stained sections in the same manner as described in Fig. 1. (B) Percentage of the callus consisting of cartilage. (C–E) Cartilage area was measured at five points sampled at 0.5-mm increments along a 2-mm length of the callus on days 12, 16, and 22, respectively. Data are expressed as mean ± SE. *Significant difference between normal and diabetic groups (p < 0.05). **Significant difference compared with the previous time-point within a group (p < 0.05).
To further examine the effect of diabetes on cartilage development, the percent area occupied by cartilage within a callus was calculated (Fig. 2B). The highest percentage of cartilage was found on day 12 and was equivalent in diabetic and normoglycemic groups (p > 0.05). This parameter showed a steady reduction over time in the normoglycemic animals but a sharp reduction in the diabetic mice from day 12 to 16. On day 16, the percent callus represented by cartilage was 2.5 times less in the diabetic group than the normoglycemic group (Fig. 2B; p < 0.05).
Changes in cartilage were examined at 0.5-mm intervals along the 2-mm length of the callus (Figs. 2C–2E). On day 12, the area of cartilage was maximal at the center of the callus and was equivalent in the diabetic and control groups at each site examined (Fig. 2C). At day 16, the diabetic animals had significantly less cartilage (p < 0.05), particularly in the central region of the callus (Fig. 3D). On day 22, there was a minimal amount of cartilage, and there was no difference between the normoglycemic and the diabetic calluses (Fig. 2E).
FIG. 3.
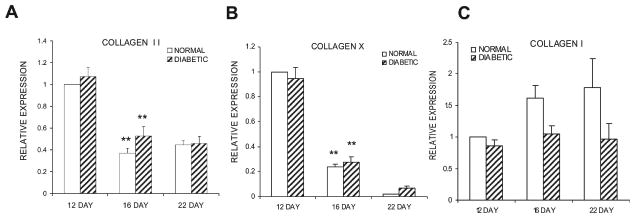
mRNA levels of cartilage and bone collagens. Total RNA from diabetic and normoglycemic mice was extracted, purified, and evaluated by real-time PCR. Data are expressed relative to the level of the normoglycemic group at day 12, which was set at 1. (A–C) mRNA expression levels of collagen II, collagen X, and collagen I, respectively. Each collagen was evaluated in three separate experiments using three mice each (n = 9), and the results are expressed as mean ± SE. *Significant difference between normal and diabetic groups (p < 0.05). **Significant difference compared with the previous time-point within a group (p < 0.05).
To study the anabolic activities of the bone and cartilage cells at the molecular level, real-time RT-PCR was carried out assessing the mRNA levels of collagen I, II, and X (Fig. 3). The expression of collagen type II showed a significant reduction from day 12 to day 16 in both normoglycemic and diabetic groups (p < 0.05), with no significant difference between the two groups at any of the time-points (Fig. 3A; p > 0.05). We next examined the expression of collagen X mRNA, a marker of hypertrophic chondrocytes that assesses terminal differentiation of these cells and found it followed the same pattern of expression as collagen type II with a significant decline from days 12 to 16 (Fig. 3B; p < 0.05). This indicates that both groups are undergoing development at similar rates. Collagen type I mRNA levels, a marker of osteogenic anabolic activity, also did not show statistical differences between groups at any of the time-points (Fig. 3C; p > 0.05).
To further study cartilage resorption the number of TRACP+ cells was quantified. In the diabetic group there was a 1.9-fold increase in osteoclasts from days 12 to 16 (p < 0.05), whereas there were no statistical difference between these time-points in the normoglycemic animals (Fig. 4A). The diabetic group had almost twice the number of osteoclasts found in the normoglycemic group on day 16 (p < 0.05; Fig. 4A). Previous studies in our laboratory had shown that, as the mineralized cartilage phase of the callus is resorbed, the distribution of osteoclasts changes from the edge of the callus toward the center where cartilage remains the longest.(26) Both diabetic and normoglycemic groups followed this trend over time (Figs. 4B–4D). The biggest difference occurred between the diabetic and normoglycemic mice on day 16, where there were 2.1- to 2.5-fold more osteoclasts in the central regions of the callus (at the fracture site and 0.5 mm proximal and distal) in the diabetic group (p < 0.05; Fig. 4C). On day 22, the normoglycemic group and the diabetic group showed a similar pattern of distribution and a similar number of osteoclasts (Fig. 4D).
FIG. 4.
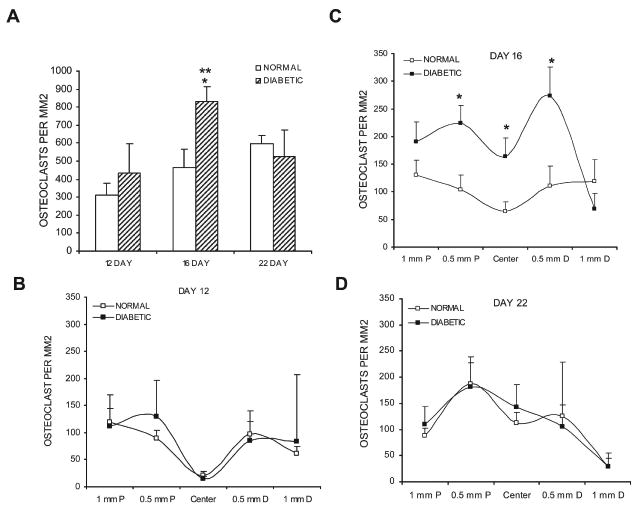
Comparison of osteoclast numbers in diabetic and normoglycemic mice. (A) The number of osteoclasts within each callus was measured in TRACP-stained sections. For a given animal, five points along a 2-mm length of the callus were sampled; the individual counts were summed to establish a value of total osteoclast number per animal for each of the three time-points. (B–D) Data for the individual counts obtained at the indicated intervals across the callus at days 12, 16, and 22, respectively. Data are expressed as mean ± SE. *Significant difference between normal and diabetic groups (p < 0.05). **Significant difference compared with the previous time-point within a group (p < 0.05).
Real-time PCR was used to quantify the mRNA levels of several of the major known mediators that regulate osteoclastogenesis. The expression of TNF-α in the diabetic group increased 2.6-fold from day 12 to day 16 (p < 0.05), whereas in the normoglycemic group, it did not (Fig. 5A). In contrast, the TNF-α mRNA levels increased in the normoglycemic mice from day 16 to day 22 (p < 0.05). At every time-point, the values were significantly higher in the diabetic group, 3.6-, 3.7-, and 1.5-fold compared with normoglycemic animals (p < 0.05). When macrophage-colony stimulating factor (M-CSF) was assessed, the mRNA levels were 2.2- and 2.3-fold higher in the diabetic than the normoglycemic animals on days 12 and 16 (p < 0.05; Fig. 5B). The RANKL was 2-fold higher in the diabetic compared with normoglycemic group on days 12 and 16 (p < 0.05; Fig. 5C). The mRNA levels of both M-CSF and RANKL did not show significant differences over time in the normoglycemic or the diabetic groups. In contrast, the level of RANK increased from days 12 to 16 but exhibited no difference between diabetics and normoglycemics (Fig. 5D). The expression of TRAIL, a related TNF family member, was significantly enhanced in the diabetic group between days 12 and 16 and was higher than normal control mice for both of these time-points (p < 0.05; Fig. 5E). The normoglycemic group showed a significant increase from days 16 to 22 (p < 0.05), making it equal to the diabetic group at day 22. No difference in osteoprotegerin (OPG) was detected between diabetic and normoglycemic groups on days 12 and 16, whereas it was significantly reduced in the normal group from days 16 to 22, making the diabetic group higher than the control group at the later time-point (p < 0.05; Fig. 5F). Because vascular endothelial growth factors (VEGFs) are known to stimulate osteoclastogenesis,(29,30) we assessed mRNA levels of VEGF-A and -C. VEGF-A was found at highest levels on day 12, whereas VEGF-C was highest on day 22, suggesting that VEGF-A may be important for osteoclastogenesis associated with early cartilage removal (Fig. 5G). Moreover, VEGF-A was elevated 1.5-fold in the diabetic animals (p < 0.05) at this time-point. VEGF-C showed the highest levels on day 22, suggesting that it might participate in osseous remodeling (Fig. 5H). It was slightly higher than the diabetic group on day 12 (p < 0.05).
FIG. 5.
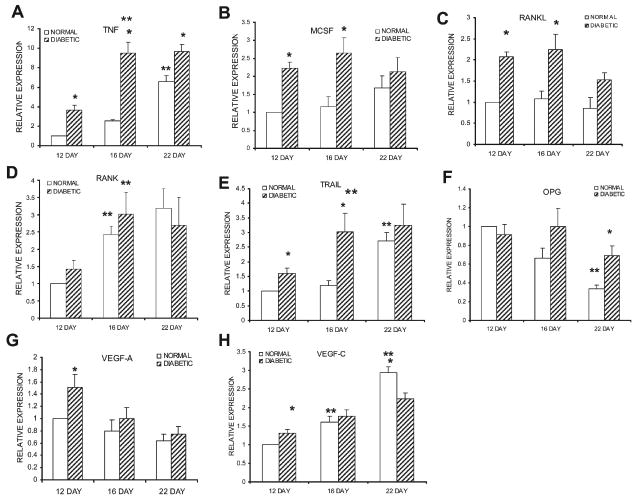
mRNA levels of cytokines that regulate osteoclastogenesis. mRNA levels were measured and normalized in the same manner as described in Fig. 3. (A–H) mRNA expression levels of TNF, M-CSF, RANKL, RANK, TRAIL, OPG, VEGF-A, and VEGF-C, respectively. Each cytokine was evaluated in three separate experiments using three mice each (n = 9), and the results are expressed as mean ± SE. *Significant difference between normal and diabetic groups (p < 0.05). **Significant difference compared with the previous time-point within a group (p < 0.05).
Another group of mRNA that was examined provides both a molecular confirmation of the histological data that reflects the formation of osteoclastic cells and an examination of mRNA that is expressed during the degradation of cartilage proteoglycans. The mRNA levels of TRACP were significantly higher in the diabetic calluses compared with normoglycemic animals on days 16 and 22 (p < 0.05; Fig. 6A). ADAMTS are a large family of lytic enzymes (disintegrin-like and metallopeptidase [reprolysin type] with thrombospondin-type 1 motifs) that degrade extracellular matrix proteins, including the aggrecan proteoglycan found in cartilage.(31,32) The levels of both aggrecanase 2 (ADAMTS 5) and aggrecanase 1 (ADAMTS 4) were also significantly elevated in the diabetic group at day 16 (p < 0.05; Figs. 6B and 6C). Matrix metaloproteinase-13 (MMP13) did not show a significant difference between diabetic and normoglycemic mice on days 12 and 16 but was 1.5-fold higher in the diabetic group on day 22 (p < 0.05; Fig. 6B).
FIG. 6.
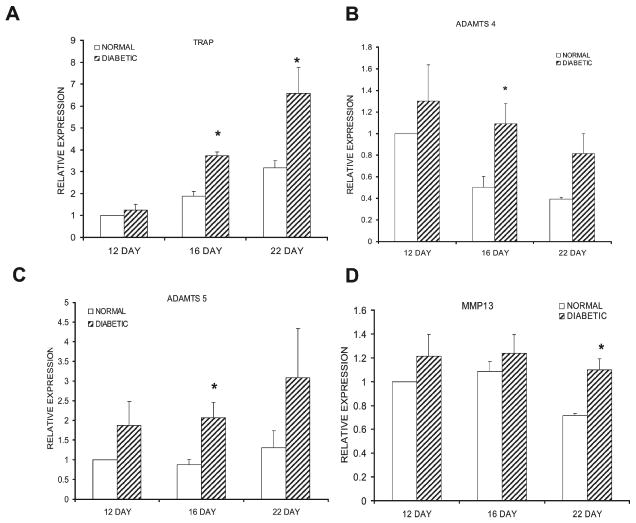
mRNA levels of enzymes that regulate tissue degradation. mRNA levels were measured and normalized in the same manner as described in Fig. 3. (A–D) mRNA expression levels of TRACP, ADAMTS-5, ADAMTS-4, and MMP13, respectively. Each enzyme was evaluated in three separate experiments using three mice each (n = 9), and the results are expressed as mean ± SE. *Significant difference between normal and diabetic groups (p < 0.05).
Discussion
Tibial fracture repair in the mouse follows a well-defined process of an initial inflammatory response that is followed by the formation of cartilage, its mineralization, subsequent resorption, and replacement with bone followed by bone remodeling.(25) Relatively little is known about the impact of diabetes on the cartilage phase, which plays an important role in the repair process because cartilage serves as a template for later bone formation.(33)
Previous studies have shown that diabetic animals exhibit fracture calluses that are smaller in size than those in normal animals,(18–22,34,35) consistent with our observations at the 16-day time-point. However, it has also been reported that at an early time-point, 1 week, there is no difference in callus size,(18) equivalent to our finding that normal and diabetic animals had similar callus sizes at 12 days. This may be significant because it suggests that diabetes affects the removal of cartilage, which may impact the transition from cartilage to bone.
In this study, we found that the amount of new bone was significantly less in diabetic mice at all time-points, which confirms previous observations.(18,19,21,34) However, the percentage of the callus consisting of bone was similar between normal and diabetic mice on days 16 and 22. There also was no difference between diabetics and normals in the expression of collagen I, II, or X, suggesting that the overall anabolic rate of chondrocytes or osteoblasts is similar at that stage. The difference in the amount of bone is caused by a smaller cartilage tissue anlage onto which the new bone is laid down. The diminished bone volume caused by a smaller callus in the diabetic group is consistent with a decrease in mechanical strength of the healing fracture callus caused by diabetes.(18–21)
Two discrete types of resorption take place during fracture repair. The first occurs when mineralized cartilage is removed, which we observed between days 12 and 16, and the second involves secondary bone formation and remodeling, which occurs later.(25) Maes et al.(36) showed that when osteoclast number is decreased during endochondral ossification, cartilage is not efficiently removed. The diabetic condition is considerably different. Diabetic calluses had double the number of osteoclasts and significantly less cartilage than controls during the transition from cartilage to bone. This may be explained mechanistically by significantly higher mRNA levels of TNF-α, M-CSF, RANKL, and to a lesser extent, VEGF-A in the diabetic animals. These cytokines have been shown to induce differentiation of bone marrow hematopoietic precursor cells into bone-resorbing osteoclasts(37) and are associated with the resorption of mineralized cartilage.(38,39) In addition, we showed that deficient TNF-α signaling causes an increased retention of cartilage.(40) It is striking that in the diabetic animals the opposite is observed: increased TNF-α expression and the rapid and efficient removal of cartilage. The TNF-related protein, TRAIL, which is also elevated in diabetic mice, both induces chondrocyte apoptosis and binds to the RANKL antagonist, OPG, and blocks its inhibitory effect on osteoclastogenesis and may thus promote cartilage resorption.(41) VEGF is another mediator that plays an important role in the transition from cartilage to bone in endochondral bone formation,(30,42) in part through enhanced osteoclastogenesis.(29) In addition, VEGF is thought to play an important role in the formation of new blood vessels, which follow osteoclast resorption of cartilage.(30) We found that VEGF-A mRNA levels were high at the 12-day time-point and elevated in the diabetic group on day 12, which could potentially contribute to the removal of cartilage.
Until recently, there has been relatively little understanding of the mechanisms involved in the turnover of cartilage proteoglycan (aggrecan) in endochondral bone. Several studies have shown that ADAMTS proteases are present in cartilage, particularly ADAMTS 4 and 5.(31,32,43,44) Our finding that ADAMTS 4 and 5 are higher in the diabetic group at day 16 would explain the greater removal of proteoglycan in the diabetic group. We found no difference between normoglycemic and diabetic in mRNA levels of MMP13, which is highly expressed during fracture healing and plays a major role in cartilage remodeling.(32,45) However, this does not rule out the possibility that MMP13 activity is higher in diabetic animals.
In conclusion, fracture repair occurs through a highly coordinated series of biological processes that involve complex interplay among multiple cell types. These processes can be altered as a consequence of diseases that affect bone. We report here that the primary effect of diabetes on cartilage is enhanced removal of cartilage. This may lead to a diminished scaffold for new bone formation, and hence, a smaller callus size.
Acknowledgments
This work was supported by NIH Grant P01AR049920.
Footnotes
The authors state that they have no conflicts of interest.
References
- 1.Tuominen JT, Impivaara O, Puukka P, Ronnemaa T. Bone mineral density in patients with type 1 and type 2 diabetes. Diabetes Care. 1999;22:1196–1200. doi: 10.2337/diacare.22.7.1196. [DOI] [PubMed] [Google Scholar]
- 2.Jehle PM, Jehle DR, Mohan S, Bohm BO. Serum levels of insulin-like growth factor system components and relationship to bone metabolism in Type 1 and Type 2 diabetes mellitus patients. J Endocrinol. 1998;159:297–306. doi: 10.1677/joe.0.1590297. [DOI] [PubMed] [Google Scholar]
- 3.Pietschmann P, Schernthaner G, Woloszczuk W. Serum osteocalcin levels in diabetes mellitus: Analysis o f the type of diabetes and microvascular complications. Diabetologia. 1988;31:892–895. doi: 10.1007/BF00265373. [DOI] [PubMed] [Google Scholar]
- 4.Bjorgaas M, Haug E, Johnsen H. The urinary excretion of deoxypyridinium cross-links is higher in diabetic than in nondiabetic adolescents. Calcif Tissue Int. 1999;65:121–124. doi: 10.1007/s002239900668. [DOI] [PubMed] [Google Scholar]
- 5.Forsen L, Meyer H, Midthjell K, Edna T. Diabetes mellitus and the incidence of hip fracture: Results from the Nord-Trondelag Health Survey. Diabetologia. 1999;42:920–925. doi: 10.1007/s001250051248. [DOI] [PubMed] [Google Scholar]
- 6.Ivers RQ, Cumming RG, Mitchell P, Peduto AJ. Diabetes and risk of fracture: The Blue Mountains Eye Study. Diabetes Care. 2001;24:1198–1203. doi: 10.2337/diacare.24.7.1198. [DOI] [PubMed] [Google Scholar]
- 7.Nicodemus KK, Folsom AR. Type 1 and type 2 diabetes and incident hip fractures in postmenopausal women. Diabetes Care. 2001;24:1192–1197. doi: 10.2337/diacare.24.7.1192. [DOI] [PubMed] [Google Scholar]
- 8.Cozen L. Does diabetes delay fracture healing? Does diabetes delay fracture healing? Clin Orthop. 1972;82:134–140. [PubMed] [Google Scholar]
- 9.Loder R. The influence of diabetes mellitus on the healing of closed fractures. Clin Orthop. 1988;232:210–216. [PubMed] [Google Scholar]
- 10.Herold K, Vezys V, Sun Q, Viktora D, Seung E, Reiner S, Brown D. Regulation of cytokine production during development of autoimmune diabetes induced with multiple low doses of streptozotocin. J Immunol. 1996;156:3521–3527. [PubMed] [Google Scholar]
- 11.Sandberg J, Andersson A, Eizirik DA, Sandler S. Interleukin-1 Receptor antagonist prevents low dose Streptozotocin induced diabetes in mice. Biochem Biophys Res Commun. 1994;202:543–548. doi: 10.1006/bbrc.1994.1962. [DOI] [PubMed] [Google Scholar]
- 12.Wang Z, Gleichmann H. GLUT2 in pancreatic islets: Crucial target molecul in diabetes induced with multiple low doses of streptozotocin in mice. Diabetes. 1998;47:50–56. doi: 10.2337/diab.47.1.50. [DOI] [PubMed] [Google Scholar]
- 13.Botolin S, Faugere MC, Malluche H, Orth M, Meyer R, McCabe LR. Increased bone adiposity and peroxisomal proliferator-activated receptor-gamma2 expression in type I diabetic mice. Endocrinology. 2005;146:3622–3631. doi: 10.1210/en.2004-1677. [DOI] [PMC free article] [PubMed] [Google Scholar]
- 14.Hou J, Zernicke RF, Barnard R. Experimental diabetes, insuling treatment, and femoral neck morphology and biomechanics in rats. Clin Orthop. 1991;264:278–285. [PubMed] [Google Scholar]
- 15.Reddy G, Stehno-Bittel L, Hamade S, Enwemeka C. The biomechanical integrity of bone in experimental diabetes. Diabetes Res Clin Pract. 2001;54:1–8. doi: 10.1016/s0168-8227(01)00273-x. [DOI] [PubMed] [Google Scholar]
- 16.Verhaeghe J, Suiker A, Nyomba B, Visser W, Einhorn T, Dequeker J, Bouillon R. Bone mineral hoeostasis in spontaneously diabetic BB rats. II. Impaired bone turnover and decreased osteocalcin synthesis. Endocrinology. 1989;124:573–582. doi: 10.1210/endo-124-2-573. [DOI] [PubMed] [Google Scholar]
- 17.Verhaeghe J, van Herck E, Visser WJ, Suiker AM, Thomasset M, Einhorn TA, Faierman E, Bouillon R. Bone and mineral metabolism in BB rats with long-term diabetes. Decreased bone turnover and osteoporosis. Diabetes. 1990;39:477–482. doi: 10.2337/diab.39.4.477. [DOI] [PubMed] [Google Scholar]
- 18.Beam H, Parsons J, Lin S. The effects of blood glucose control upon fracture healing in the BB Wistar rat with diabetes mellitus. J Orthop Res. 2002;20:1210–1216. doi: 10.1016/S0736-0266(02)00066-9. [DOI] [PubMed] [Google Scholar]
- 19.Gandhi A, Beam HA, O'Connor JP, Parsons JR, Lin SS. The effects of local insulin delivery on diabetic fracture healing. Bone. 2005;37:482–490. doi: 10.1016/j.bone.2005.04.039. [DOI] [PubMed] [Google Scholar]
- 20.Gooch HL, Hale JE, Fujioka H, Balian G, Hurwitz SR. Alterations of cartilage and collagen expression during fracture healing in experimental diabetes. Connect Tissue Res. 2000;41:81–91. doi: 10.3109/03008200009067660. [DOI] [PubMed] [Google Scholar]
- 21.Herbsman H, Powers J, Hirschman A, Shaftan G. Retardation of fracture healing in experimental diabetes. J Surg Res. 1968;8:424–431. doi: 10.1016/0022-4804(68)90058-9. [DOI] [PubMed] [Google Scholar]
- 22.Topping R, Bolander M, Balian G. Type X collagen in fracture callus and the effects of experimental diabetes. Clin Orthop. 1994;308:220–228. [PubMed] [Google Scholar]
- 23.Graves DT, Naguib G, Lu H, Leone C, Hsue H, Krall E. Inflammation is more persistent in Type 1 diabetic mice. J Dent Res. 2005;84:324–328. doi: 10.1177/154405910508400406. [DOI] [PubMed] [Google Scholar]
- 24.Bonnarens F, Einhorn T. Production of a standard closed fracture in laboratory animal bone. J Orthop Res. 1984;2:97–101. doi: 10.1002/jor.1100020115. [DOI] [PubMed] [Google Scholar]
- 25.Gerstenfeld L, Cullininane D, Barnes G, Graves D, Einhorn T. Fracture healing as a post-natal developmental process: Molecular, spatial, adn temporal aspects of its regulation. J Cell Biochem. 2003;88:873–884. doi: 10.1002/jcb.10435. [DOI] [PubMed] [Google Scholar]
- 26.Gerstenfeld LC, Wronski TJ, Hollinger JO, Einhorn TA. Application of histomorphometric methods to the study of bone repair. J Bone Miner Res. 2005;20:1715–1722. doi: 10.1359/JBMR.050702. [DOI] [PubMed] [Google Scholar]
- 27.He H, Liu R, Desta T, Leone C, Gerstenfeld L, Graves D. Diabetes causes decreased osteoclastogenesis, reduced bone formation, and enhanced apoptosis of osteoblastic cells in bacteria stimulated bone loss. Endocrinology. 2004;145:447–452. doi: 10.1210/en.2003-1239. [DOI] [PubMed] [Google Scholar]
- 28.Alikhani M, Alikhani Z, Graves D. FOXO1 functions as a master switch that regulates gene expression necessary for TNF-induced fibroblast apoptosis. J Biol Chem. 2005;280:12096–12102. doi: 10.1074/jbc.M412171200. [DOI] [PubMed] [Google Scholar]
- 29.Nakagawa M, Kaneda T, Arakawa T, Morita S, Sato T, Yo-mada T, Hanada K, Kumegawa M, Hakeda Y. Vascular endothelial growth factor (VEGF) directly enhances osteoclastic bone resorption and survival of mature osteoclasts. FEBS Lett. 2000;473:161–164. doi: 10.1016/s0014-5793(00)01520-9. [DOI] [PubMed] [Google Scholar]
- 30.Gerber H, Vu T, Ryan A, Kowalski J, Werb Z, Ferrara N. VEGF couples hypertrophic cartilage remodeling, ossification and angiogeneis during endochondral bone formation. Nat Med. 1999;5:623–628. doi: 10.1038/9467. [DOI] [PubMed] [Google Scholar]
- 31.Apte SS. A disintegrin-like and metalloprotease (reprolysin type) with thrombospondin type 1 motifs: The ADAMTS family. Int J Biochem Cell Biol. 2004;36:981–985. doi: 10.1016/j.biocel.2004.01.014. [DOI] [PubMed] [Google Scholar]
- 32.Lee ER. Proteolytic enzymes in skeletal development: Histochemical methods adapted to the study of matrix lysis during the transformation of a “cartilage model” into bone. Front Biosci. 2006;11:2538–2553. doi: 10.2741/1989. [DOI] [PubMed] [Google Scholar]
- 33.Gerstenfeld LC, Thiede M, Seibert K, Mielke C, Phippard D, Svagr B, Cullinane D, Einhorn TA. Differential inhibition of fracture healing by non-selective and cyclooxygenase-2 selective non-steroidal anti-inflammatory drugs. J Orthop Res. 2003;21:670–675. doi: 10.1016/S0736-0266(03)00003-2. [DOI] [PubMed] [Google Scholar]
- 34.Follak N, Kloting L, Wolf E, Merk H. Delayed remodeling in the early period of fracture healing in spontaneously diabetic BB/OK rats depending on the diabetic metabolic state. Histol Histopathol. 2004;19:473–486. doi: 10.14670/HH-19.473. [DOI] [PubMed] [Google Scholar]
- 35.Tyndall WA, Beam HA, Zarro C, O'Connor JP, Lin SS. Decreased platelet derived growth factor expression during fracture healing in diabetic animals. Clin Orthop. 2003;408:319–330. doi: 10.1097/00003086-200303000-00043. [DOI] [PubMed] [Google Scholar]
- 36.Maes C, Coenegrachts L, Stockmans I, Daci E, Luttun A, Petryk A, Gopalakrishnan R, Moermans K, Smets N, Verfaillie CM, Carmeliet P, Bouillon R, Carmeliet G. Placental growth factor mediates mesenchymal cell development, cartilage turnover, and bone remodeling during fracture repair. J Clin Invest. 2006;116:1230–1242. doi: 10.1172/JCI26772. [DOI] [PMC free article] [PubMed] [Google Scholar]
- 37.Cappellen D, Luong-Nguyen NH, Bongiovanni S, Grenet O, Wanke C, Susa M. Transcriptional program of mouse osteoclast differentiation governed by the macrophage colony-stimulating factor and the ligand for the receptor activator of NFkappa B. J Biol Chem. 2002;277:21971–21982. doi: 10.1074/jbc.M200434200. [DOI] [PubMed] [Google Scholar]
- 38.Kon T, Cho TJ, Aizawa T, Yamazaki M, Nooh N, Graves D, Gerstenfeld LC, Einhorn TA. Expression of osteoprotegerin, receptor activator of NF-kappaB ligand (osteoprotegerin ligand) and related proinflammatory cytokines during fracture healing. J Bone Miner Res. 2001;16:1004–1014. doi: 10.1359/jbmr.2001.16.6.1004. [DOI] [PubMed] [Google Scholar]
- 39.Barnes GL, Kostenuik PJ, Gerstenfeld LC, Einhorn TA. Growth factor regulation of fracture repair. J Bone Miner Res. 1999;14:1805–1815. doi: 10.1359/jbmr.1999.14.11.1805. [DOI] [PubMed] [Google Scholar]
- 40.Gerstenfeld LC, Cho TJ, Kon T, Aizawa T, Tsay A, Fitch J, Barnes GL, Graves DT, Einhorn TA. Impaired fracture healing in the absence of TNF-alpha signaling: The role of TNF-alpha in endochondral cartilage resorption. J Bone Miner Res. 2003;18:1584–1592. doi: 10.1359/jbmr.2003.18.9.1584. [DOI] [PubMed] [Google Scholar]
- 41.Emery J, McDonnell P, Burke M, Deen K, Lyn S, Silverman C, Dul E, Applbaum E, Eichman C, DiPrinzio R, Dodds R, James I, Rosenber M, Lee J, Young P. Osteoprotegerin is a receptor for the cytotoxic ligand TRAIL. J Biol Chem. 1998;273:14363–14367. doi: 10.1074/jbc.273.23.14363. [DOI] [PubMed] [Google Scholar]
- 42.Carlevaro M, Cermeilli S, Cancedda R, Desalzi Cancedda F. Vascular endothelial growth factor (VEGF) in cartilage neovasculariztion and chondrocyte diffeentiation: Auto-parcrine role during encochondral bone formation. J Cell Sci. 2000;113:59–69. doi: 10.1242/jcs.113.1.59. [DOI] [PubMed] [Google Scholar]
- 43.Kevorkian L, Young D, Darrah C, Donell S, Shepstone L, Porter S, Brockbank S, Edwards D, Parker A, Clark I. Expression profiling of metalloproteinases and their inhibitors in cartilage. Arthritis Rheum. 2004;50:131–141. doi: 10.1002/art.11433. [DOI] [PubMed] [Google Scholar]
- 44.Tortorella MD, Burn TC, Pratta MA, Abbaszade I, Hollis JM, Liu R, Rosenfeld SA, Copeland RA, Decicco CP, Wynn R, Rockwell A, Yang F, Duke JL, Solomon K, George H, Bruckner R, Nagase H, Itoh Y, Ellis DM, Ross H, Wiswall BH, Murphy K, Hillman MC, Jr, Hollis GF, Newton RC, Magolda RL, Trzaskos JM, Arner EC. Purification and cloning of aggrecanase-1: A member of the ADAMTS family of proteins. Science. 1999;284:1664–1666. doi: 10.1126/science.284.5420.1664. [DOI] [PubMed] [Google Scholar]
- 45.Yamagiwa H, Tokunaga K, Hayami T, Hatano H, Uchida M, Endo N, Takahashi HE. Expression of metalloproteinase-13 (Collagenase-3) is induced during fracture healing in mice. Bone. 1999;25:197–203. doi: 10.1016/s8756-3282(99)00157-x. [DOI] [PubMed] [Google Scholar]