Abstract
Objective. EEG has great potential as a cost-effective screening tool for Alzheimer's disease (AD). However, the specificity of EEG is not yet sufficient to be used in clinical practice. In an earlier study, we presented preliminary results suggesting improved specificity of EEG to early stages of Alzheimer's disease. The key to this improvement is a new method for extracting sparse oscillatory events from EEG signals in the time-frequency domain. Here we provide a more detailed analysis, demonstrating improved EEG specificity for clinical screening of MCI (mild cognitive impairment) patients. Methods. EEG data was recorded of MCI patients and age-matched control subjects, in rest condition with eyes closed. EEG frequency bands of interest were θ (3.5–7.5 Hz), α1 (7.5–9.5 Hz), α2 (9.5–12.5 Hz), and β (12.5–25 Hz). The EEG signals were transformed in the time-frequency domain using complex Morlet wavelets; the resulting time-frequency maps are represented by sparse bump models. Results. Enhanced EEG power in the θ range is more easily detected through sparse bump modeling; this phenomenon explains the improved EEG specificity obtained in our previous studies. Conclusions. Sparse bump modeling yields informative features in EEG signal. These features increase the specificity of EEG for diagnosing AD.
1. Introduction
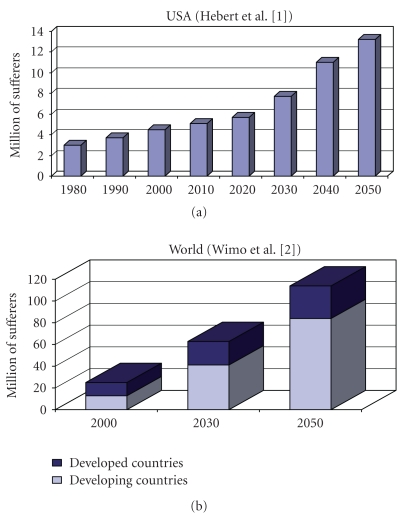
AD is the most common neurodegenerative disorder; one of its earliest signs is progressive memory loss. Since the number of individuals with AD is expected to increase considerably in the near future [1, 2] (see also Figure 1), reliable treatment and diagnosis of AD are critical. Many approaches to treatment are currently being investigated [3, 4]. A clinical diagnosis accuracy of approximately 85% of detection rate is commonly achieved, by a procedure of exclusion after structural or functional imaging tests—including quantitative electroencephalography (QEEG), laboratory, and psychometric tests [5].
Figure 1.
Projection of the prevalence of AD and dementia in the near future. Illustration based on demographic estimates of Hebert et al. [1] (projection of AD prevalence in USA) and Wimo et al. [2] (projection of AD prevalence worldwide).
QEEG recordings of subjects in resting condition and with eyes closed are conventionally used in daily clinical routine as a diagnostic tool for AD [6–8]. The main advantage of QEEG is its low cost and its mobility. Several studies have demonstrated that QEEG is useful for investigating Alzheimer's disease (AD) [7, 9–15]. Topographical EEG power changes are believed to reflect early signs of cortical atrophy and/or compensatory cortical reorganization during the early stages of the disease [16]. More specifically, it is commonly believed that AD induces enhanced mean power of slow rhythms (0.5–8 Hz) and loss of fast (8–30 Hz) rhythms [6, 9, 11, 17, 18]. In the EEG of healthy subjects, recorded in resting condition with closed eyes, alpha rhythms are usually mostly distributed in the occipital area; in AD patients, the alpha rhythms increasingly relocate towards anterior areas as the disease progresses [9, 19, 20].
More precisely, these effects have been shown to correlate with severity of AD expressed by mini mental state evaluation (MMSE, [15]) and, more recently, with clinical dementia rating scale (CDR, [13]).
Early stages of AD have been associated with an increase of theta activity and/or a decrease of alpha activity. In more severe stages of AD, an increase in both theta and delta activities has been observed, together with activity decrease in both alpha and beta frequency bands, in addition to a reduction in peak alpha frequency [5, 13].
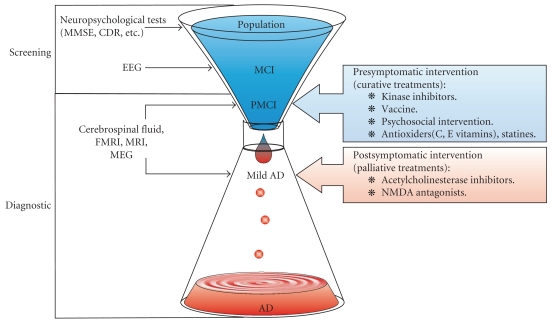
Since EEG could be used as a cost-effective screening tool for early detection and diagnosis of the Mild Cognitive Impairment (MCI) stage (see Figure 2), it may change the objectives of treatment: if AD could be reliably diagnosed in an early stage, medical treatments would, instead of being palliative, become curative: they may be used to delay or, hopefully, even bring the disease progress to a halt. However, EEG is not yet considered as a reliable diagnostic tool, because of its lack of specificity [21].
Figure 2.
EEG may be used as a screening tool for early-stage AD, since EEG recording technology is inexpensive and available in most hospitals. At an early stage of AD, presymptomatic interventions (curative treatments) may be investigated. However, EEG is not yet a reliable diagnostic tool: the specificity of EEG needs to be improved.
Our long-term research objective is to develop signal processing methods that improve EEG specificity for diagnosing AD; we wish to discover EEG signal features that not only significantly differ in AD patients, but also allow us to reliably separate AD patients and control subjects. This approach is valuable for clinical purposes (as diagnostic tool for AD), and it also more fundamentally contributes to a better understanding of brain dynamics of MCI patients. In this paper, we focus on time-frequency representations of EEG signals, which will enable us to extract EEG features that improve the specificity of EEG for diagnosing AD.
2. Methods
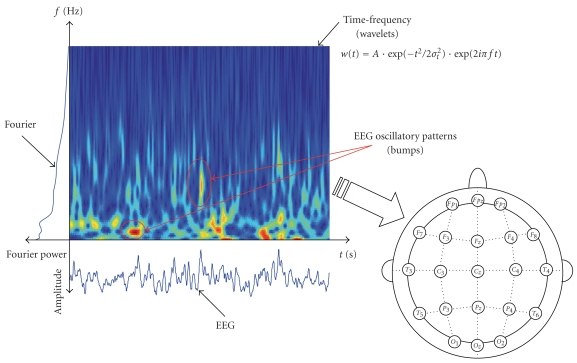
Most often clinical EEG of AD patients is analyzed either in time domain or in the frequency domain (Fourier power analysis). However, those standard approaches entirely ignore the fact that EEG is mainly a nonstationary signal, that is, the statistics of brain rhythms evolve in time. Both signal domains, that is, time domain and frequency domain, may be exploited simultaneously: instead of studying either time or frequency separately, we extract time-frequency information (Figure 3). This is possible through time-frequency representations, such as windowed Fourier transforms, or the more recently proposed wavelet time-frequency representations (WTFRs). However, WTFRs describe signals by means of thousands of coefficients. The information is distributed over those many coefficients and as a result, the coefficients cannot be used directly as signal features; therefore, additional processing is required before discriminative analysis can be carried out. In our previous work [22], we extracted signal features from time-frequency maps by means of sparse bump models; those models consist of time-frequency patterns (“bumps”) of high magnitude, lasting nearly 4 time periods centered at a specific frequency. Those patterns are likely to be representative of transient local synchronization of neuronal assemblies, conveying key information on higher-order cognitive and sensory processing. The bump modeling approach allows us to capture oscillatory events in EEG on a trial-by-trial basis, which in turn may be considered as reliable characteristic signatures in Local Field Potentials (LFP) and EEG signals [23, 24]. We hypothesize that those signatures contain significant EEG information about brain disorders such as AD.
Figure 3.
Possible approaches to study EEG brain dynamics. From the time-domain EEG signals, spectral information, in frequency or time-frequency domain (including EEG time-frequency patterns), may be extracted. Afterwards, the spatial information is taken into account, through QEEG or synchrony measures.
Computations were performed using Matlab 7.0 (The MathWorks, Inc.). Statistical analysis was performed using Sigmastat 3.5 (Systat software, Inc.). Wavelet analysis and time-frequency sparsification were performed using the ButIf Toolbox [22, 24, 25].
2.1. Subjects
Patients who complained of only memory impairment were recruited from the outpatient memory clinics of the National Center Hospital for Mental, Nervous, and Muscular Disorders, and the National Center of Neurology and Psychiatry between 1998 and 2000. They underwent thorough neuropsychological testing that revealed quantified, objective evidence of memory impairment with no apparent loss in general cognitive, behavioral, or functional status. In the course of the clinical study, EEG was recorded in rest condition with closed eyes (under vigilance control), by 21 Ag/AgCl electrodes (disks of diameter 8 mm), arranged according to the 10–20 international system. The experiment was conducted with the understanding and the consent of the human subject. The responsible Ethical Committee has approved the experiments.
EEG was recorded with Biotop 6R12 (NEC San-ei, Tokyo, Japan) at a sampling rate of 200 Hz with analog bandpass filtering in the frequency range of 0.5–25 Hz; the signals were then digitally filtered with a high pass filter above 4 Hz by a third-order Butterworth filter. The subjects comprised two study groups; the first group consists of 25 subjects who complained of memory problems. At the time of the EEG recordings, these subjects were diagnosed with mild cognitive impairment (MCI). Later on, they all developed mild AD. The average mini mental state exam (MMSE) score in the MCI group was 26 (SD of 1.8).
The other group consists of 56 age-matched healthy subjects who had no memory or other cognitive impairments. The average MMSE of this control group was 28.5 (SD of 1.6). The ages of the two groups were 71.9 ± 10.2 and 71.7 ± 8.3, respectively.
The EEG data was investigated by an EEG expert for artifacts, and sufficiently clean EEG segments of 20 s were selected (on each of the 21 channels). Subject with less than 20 s artifact-clean data were rejected, reducing their number to 22 and 38, respectively. There was no significant difference in age data between the two groups in the subset. We used here this database with 22 patients in the early stage of Alzheimer's disease (mild cognitive impairment or MCI) and 38 control subjects. This EEG data have been analyzed in previous studies [14, 22, 26–28].
2.2. Time-Frequency Spectral Analysis
Wavelet time-frequency maps are computed using complex Morlet wavelets. The (continuous) wavelet transform W of a time series x(l)ψ* is obtained as
| (1) |
where ψ(k) is the (complex) “mother”′ wavelet, s is a scaling factor, and ∗ stands for complex conjugate. In this paper, we use the complex Morlet wavelet:
| (2) |
where σt2 and f0 jointly determine the number of oscillations in the wavelet. The complex Morlet wavelet family defined by 2πf0k = 7 results in the optimal resolution in time and frequency; it has also proven to be well suited for EEG signals [29–34] (see also [35] for review).
As a benchmark for the approach based on sparse time-frequency bump models (see below), we computed statistics directly from the WTFR. In particular, we computed WTFR relative power in four different frequency bands, that is, θ (3.5–7.5 Hz), α1 (7.5–9.5 Hz), α2 (9.5–12.5 Hz), and β (12.5–25 Hz). We controlled the discriminative power of those 4 measures, by computing their classification error using linear discriminant analysis (LDA).
2.3. Sparsification
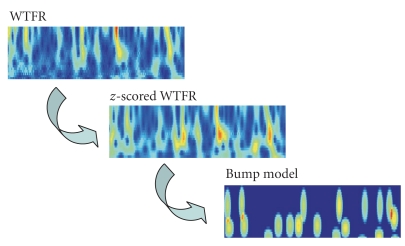
Next we extract oscillatory events (“bumps”) from the time-frequency maps (Figure 4). Those oscillatory events are generally believed to be due to local synchrony of neural populations in the vicinity of the recording electrode [35]. We extract oscillatory bursts (“bumps”) by sparse bump modeling [23–25, 28, 36]. More specifically, we used the ButIf toolbox, developed in earlier work (Figure 4, [25, 36]). We now describe this procedure in more detail.
Figure 4.
from wavelet time-frequency representation (WTFR) to a sparse time-frequency bump model.
Frequency-dependent z-score normalization [37, 38] was applied to each trial:
| (3) |
where μf and σf are the mean and standard deviation, respectively, of the wavelet map W. The resulting z-score maps z(f, t) are approximated by bump models zbump, which are sequences of basis functions b (“bumps”) with parameters θk (for more details about bump modeling, see [23]):
| (4) |
with θ = (θ1, θ2,…, θNb). This decomposition represents the most salient oscillatory events in the z-scored map (f, t). As pointed out earlier, we hypothesize that those events are characteristic for EEG dynamics and are therefore relevant for diagnosing AD. We used half ellipsoid basis functions b, and the parameters θk are vectors of five parameters: position in time and frequency, width in time and frequency, and amplitude. We computed the number of bumps in four different frequency bands, that is, θ (3.5–7.5 Hz), α1 (7.5–9.5 Hz), α2 (9.5–12.5 Hz), and β (12.5–25 Hz). We conducted linear discriminant analysis (LDA), using the number of bumps in those 4 frequency bands as input features for the classification.
3. Results
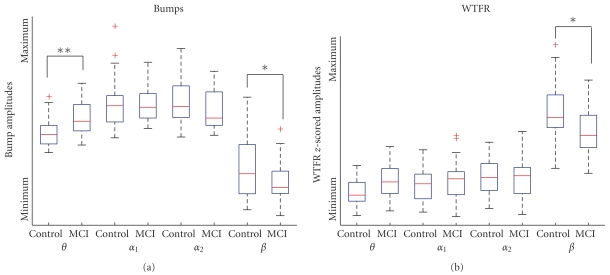
In an earlier preliminary study, we observed that bump modeling leads to improved classification results (80–93% classification using leave-one-out classification, see[22]), compared to approaches based on WTFR directly, without bump modeling (70% classification). We report here results of a more detailed study, which considers 4 separate frequency bands; so far, we had only considered the frequency band 4–25 Hz [22]. We found significant differences in the theta and beta ranges (Mann-Whitney test, P < .01). We compared the WTFR relative power in all four frequency ranges, before and after bump processing (Figure 5). The difference in theta range was enhanced by bump modeling (P = 10−4 instead of .08), while the beta range difference was reduced but remained significant. The improvement of classification observed in [22] is therefore mostly attributed to enhanced separation of EEG activity in the theta range.
Figure 5.
Boxplot comparison of the time-frequency activity between the time-frequency representation and its sparse bump representation. The center line is the median, the box represents the interquartile range, whiskers represent nonoutlier observations, and cross indicates outliers. * and ** indicate significant (P < .01) and very significant (P < .001) differences. (The relative power appears larger than in lower ranges. This is due to the topography of the wavelet maps (because we used steps of 1 Hz instead of using logarithmic scales). If we resize those values taking into account the size of the ranges, we obtain the same P values and classification results, with a lower power in the beta range as compared to low frequency ranges.)
Classification results (Table 1) also improved in the theta (33.3 errors to 21.7%) and beta (48.3 errors to 41.7%) ranges, with a notable increase of specificity in the theta range (76.3 to 81.6%).
Table 1.
LDA results, for WTFR and Bump amplitude. LOO = Leave-one-out validation error (classification error). SEN = sensitivity. SPE = specificity. In both cases, the best discriminating frequency range is in the theta range. Classification, sensitivity, and specificity are improved by bump modeling.
| θ (3.5–7.5 Hz) | α1 (7.5–9.5 Hz) | α2 (9.5–12.5 Hz) | β (12.5–25 Hz) | |
|---|---|---|---|---|
| WTFR | LOO = 33.3% | LOO = 46.7% | LOO = 81.7% | LOO = 48.3% |
| SEN = 50.0% | SEN = 27.3% | SEN = 18.2% | SEN = 59.1% | |
| SPE = 76.3% | SPE = 68.4% | SPE = 18.4% | SPE = 47.4% | |
| Bumps | LOO = 21.7% | LOO = 76.7% | LOO = 51.7% | LOO = 41.7% |
| SEN = 72.3% | SEN = 18.2% | SEN = 40.9% | SEN = 68.2% | |
| SPE = 81.6% | SPE = 26.3% | SPE = 52.6% | SPE = 52.6% | |
4. Discussion
This paper investigates EEG features for diagnosis AD at an early stage. We observed that bump modeling enhances the statistical differences in EEG activity in the theta range between healthy subjects and MCI patients. This observation may explain the improved classification results by bump modeling, reported in [22]. This effect is also consistent with the existing literature on Alzheimer's disease: low frequency activity (0.5–8 Hz) is generally stronger for patients with AD, while the amplitude of higher frequencies (8–30 Hz) is generally decreased in AD patients [6, 9, 11, 17, 18]. An increase of the theta range activity in the early stages of AD has often been demonstrated [5, 13], and this effect was indeed already visible using Fourier spectral analysis or WTFR, without bump modeling. However, bump modeling amplifies this effect, at least for the EEG data set at hand.
Oscillatory neuronal networks, as a model for brain dynamics, provide a unique interdisciplinary platform to study neurocognitive dynamics [39]. The analysis of EEG data, though of high relevance in cognitive research, poses a number of technical challenges as EEG signals are clearly stochastic and highly nonstationary [40]. The structural organization and associated functional role of EEG oscillations are still far from being completely understood. In this paper, we investigated the specificity of EEG oscillatory bursts as neural correlates of early-stage Alzheimer's disease. When one computes the average of WTFR power, the structure of the time-frequency map is not accounted for. Whereas most studies focus such averaged EEG responses in time or frequency, this study considers oscillatory events in the time-frequency domain, without relying on EEG averages. The bumps are modelled on single trials, and once this structural information is extracted, we computed averages over electrodes (therefore not losing the burst/background separation). If this grand average is performed on the time frequency maps (without extracting the bump), we actually loose information (classification error increases; P values increase). We observed using our single trial models that EEG organized oscillatory events contain stronger discriminative signatures of the early stage of Alzheimer's disease than averaged spectral EEG statistics, which also explains our previously obtained classification results [22]. Our results suggest that the effect of enhanced low-frequency activity in AD patients may be primarily due to changes in time-frequency burst properties.
We speculate that those slow-wave oscillatory events may be caused by subcortical damage, induced in the early stage of Alzheimer's disease [41, 42]. Background activity in EEG is mostly attributed to cortical neural events; on the other hand, the oscillatory bursts, generated by locally synchronous neural populations, could be related to inter-area connections, including subcortical areas. Indeed, low-frequency synchrony is probably representative of subcortical connectivity [43]. Our results would then attribute the increase of slow wave activity as a probable correlate of subcortical damage induced in the early stage of Alzheimer's disease.
As we have shown recently [24], organized oscillatory bursts in EEG time-frequency activity seem to play a specific functional role in steady state visual evoked potentials, distinct from the more stationary ongoing EEG activity (activity not organized in bursts, representing 70–80% of the signal). We here provide additional evidence that EEG events carry significant information, as they can be used to distinguish normal subjects from MCI patients. This observation is consistent with the interpretation of time-frequency oscillatory events as signatures of locally synchronous neural populations. As a consequence, both background EEG and oscillatory EEG bursts may be highly relevant for understanding and diagnosing brain disorders, including Alzheimer's disease. We could not study the delta band with portions of 20 seconds only: bump modeling has limits in the lower frequency ranges [36]; we would have needed larger windows (≈1 m 20 s duration). The gamma band could not be studied, the data being low-passed filtered below the gamma range. Furthermore, to study reliably gamma range power, special care should be taken to prevent electromyographic artifacts from polluting EEG signals (such as recording EMG sensors), which could not be done at the recording site. However, we insist here that studies of EEG spectrum in the gamma range are seldom led for brain disorders and may provide valuable information. Finally, one should keep in mind that the parameters of bump modeling should be chosen appropriately; otherwise one would model background activity instead of oscillatory bursts (the results presented here are robust to reasonable variations of these parameters).
5. Conclusion
This paper investigates EEG features for diagnosis AD at an early stage. We observed that bump modeling enhances the statistical differences in EEG activity in the theta range between healthy subjects and MCI patients, with a maximal specificity reached in the theta range (passing from 76.3% with WTFR to 81.6% using bumps). This observation may explain the improved classification results by bump modeling, reported in [22]. Our results suggest that the effect of enhanced low-frequency activity in AD patients may be primarily due to changes in time-frequency burst properties.
References
- 1.Hebert LE, Scherr PA, Bienias JL, Bennett DA, Evans DA. State-specific projections through 2025 of Alzheimer disease prevalence. Neurology. 2004;62(9):p. 1645. doi: 10.1212/01.wnl.0000123018.01306.10. [DOI] [PubMed] [Google Scholar]
- 2.Wimo A, Winblad B, Aguero-Torres H, Von Strauss E. The magnitude of dementia occurrence in the world. Alzheimer Disease and Associated Disorders. 2003;17(2):63–67. doi: 10.1097/00002093-200304000-00002. [DOI] [PubMed] [Google Scholar]
- 3.Roberson ED, Mucke L. 100 years and counting: prospects for defeating Alzheimer’s disease. Science. 2006;314(5800):781–784. doi: 10.1126/science.1132813. [DOI] [PMC free article] [PubMed] [Google Scholar]
- 4.Goedert M, Spillantini MG. A century of Alzheimer’s disease. Science. 2006;314(5800):777–781. doi: 10.1126/science.1132814. [DOI] [PubMed] [Google Scholar]
- 5.Knott V, Mohr E, Mahoney C, Ilivitsky V. Quantitative electroencephalography in Alzheimer’s disease: comparison with a control group, population norms and mental status. Journal of Psychiatry and Neuroscience. 2001;26(2):106–116. [PMC free article] [PubMed] [Google Scholar]
- 6.Besthorn C, Zerfass R, Geiger-Kabisch C, et al. Discrimination of Alzheimer’s disease and normal aging by EEG data. Electroencephalography and Clinical Neurophysiology. 1997;103(2):241–248. doi: 10.1016/s0013-4694(97)96562-7. [DOI] [PubMed] [Google Scholar]
- 7.Leuchter AF, Cook IA, Newton TF, et al. Regional differences in brain electrical activity in dementia: use of spectral power and spectral ratio measures. Electroencephalography and Clinical Neurophysiology. 1993;87(6):385–393. doi: 10.1016/0013-4694(93)90152-l. [DOI] [PubMed] [Google Scholar]
- 8.van der Hiele K, Vein AA, Kramer CGS, et al. Memory activation enhances EEG abnormality in mild cognitive impairment. Neurobiology of Aging. 2007;28(1):85–90. doi: 10.1016/j.neurobiolaging.2005.11.006. [DOI] [PubMed] [Google Scholar]
- 9.Babiloni C, Binetti G, Cassetta E, et al. Mapping distributed sources of cortical rhythms in mild Alzheimer’s disease. A multicentric EEG study. NeuroImage. 2004;22(1):57–67. doi: 10.1016/j.neuroimage.2003.09.028. [DOI] [PubMed] [Google Scholar]
- 10.Brinkmeyer J, Grass-Kapanke B, Ihl R. EEG and the test for the early detection of dementia with discrimination from depression (TE4D): a validation study. International Journal of Geriatric Psychiatry. 2004;19(8):749–753. doi: 10.1002/gps.1162. [DOI] [PubMed] [Google Scholar]
- 11.Jelic V, Shigeta M, Jnlin P, Almkvist O, Winblad B, Wahhmd LO. Quantitative electroencephalography power and coherence in Alzheimer’s disease and mild cognitive impairment. Dementia. 1996;7(6):314–323. doi: 10.1159/000106897. [DOI] [PubMed] [Google Scholar]
- 12.Kowalski JW, Gawel M, Pfeffer A, Barcikowska M. The diagnostic value of EEG in Alzheimer disease: correlation with the severity of mental impairment. Journal of Clinical Neurophysiology. 2001;18(6):570–575. doi: 10.1097/00004691-200111000-00008. [DOI] [PubMed] [Google Scholar]
- 13.Kwak YT. Quantitative EEG findings in different stages of Alzheimer’s disease. Journal of Clinical Neurophysiology. 2006;23(5):456–461. doi: 10.1097/01.wnp.0000223453.47663.63. [DOI] [PubMed] [Google Scholar]
- 14.Nobili F, Copello F, Vitali P, et al. Timing of disease progression by quantitative EEG in Alzheimer’s patients. Journal of Clinical Neurophysiology. 1999;16(6):566–573. doi: 10.1097/00004691-199911000-00008. [DOI] [PubMed] [Google Scholar]
- 15.Rodriguez G, Nobili F, Rocca G, De Carli F, Gianelli MV, Rosadini G. Quantitative electroencephalography and regional cerebral blood flow: discriminant analysis between Alzheimer's patients and healthy controls. Dementia and Geriatric Cognitive Disorders. 1998;9(5):274–283. doi: 10.1159/000017072. [DOI] [PubMed] [Google Scholar]
- 16.Hogan MJ, Swanwick GRJ, Kaiser J, Rowan M, Lawlor B. Memory-related EEG power and coherence reductions in mild Alzheimer’s disease. International Journal of Psychophysiology. 2003;49(2):147–163. doi: 10.1016/s0167-8760(03)00118-1. [DOI] [PubMed] [Google Scholar]
- 17.Jeong J. EEG dynamics in patients with Alzheimer’s disease. Clinical Neurophysiology. 2004;115(7):1490–1505. doi: 10.1016/j.clinph.2004.01.001. [DOI] [PubMed] [Google Scholar]
- 18.Dierks T, Ihl R, Frolich L, Maurer K. Dementia of the Alzheimer type: effects on the spontaneous EEG described by dipole sources. Psychiatry Research—Neuroimaging. 1993;50(3):151–162. doi: 10.1016/0925-4927(93)90027-f. [DOI] [PubMed] [Google Scholar]
- 19.Claus JJ, Kwa VIH, Teunisse S, et al. Slowing on quantitative spectral EEG is a marker for rate of subsequent cognitive and functional decline in early Alzheimer disease. Alzheimer Disease and Associated Disorders. 1998;12(3):167–174. doi: 10.1097/00002093-199809000-00008. [DOI] [PubMed] [Google Scholar]
- 20.Ihl R, Dierks T, Martin EM, Frölich L, Maurer K. Topography of the maximum of the amplitude of EEG frequency bands in dementia of the Alzheimer type. Biological Psychiatry. 1996;39(5):319–325. doi: 10.1016/0006-3223(95)00174-3. [DOI] [PubMed] [Google Scholar]
- 21.Scinto LFM, Daffner KR. Early Diagnosis of Alzheimer’s Disease. Totowa, NJ, USA: Humana Press; 2000. [Google Scholar]
- 22.Vialatte FB, Cichocki A, Dreyfus G, Musha T, Shishkin SL, Gervais R. Early detection of Alzheimer's disease by blind source separation, time frequency representation, and bump modeling of EEG signals. In: Proceedings of the 15th International Conference on Artificial Neural Networks, vol. 3696; September 2005; Warsaw, Poland. pp. 683–692. Lecture Notes in Computer Science. [Google Scholar]
- 23.Vialatte FB, Martin C, Dubois R, et al. A machine learning approach to the analysis of time-frequency maps, and its application to neural dynamics. Neural Networks. 2007;20(2):194–209. doi: 10.1016/j.neunet.2006.09.013. [DOI] [PubMed] [Google Scholar]
- 24.Vialatte FB, Dauwels J, Maurice M, Yamaguchi Y, Cichocki A. On the synchrony of steady state visual evoked potentials and oscillatory burst events. Cognitive Neurodynamics. 2009;3(3):251–261. doi: 10.1007/s11571-009-9082-4. [DOI] [PMC free article] [PubMed] [Google Scholar]
- 25.Vialatte F, Sole-Casals J, Dauwels J, Maurice M, Cichocki A. Bump time frequency toolbox software. version 1.0, 2008, http://www.bsp.brain.riken.jp/~fvialatte/bumptoolbox/download.html. [DOI] [PMC free article] [PubMed]
- 26.Cichocki A, Shishkin SL, Musha T, Leonowicz Z, Asada T, Kurachi T. EEG filtering based on blind source separation (BSS) for early detection of Alzheimer's disease. Clinical Neurophysiology. 2005;116(3):729–737. doi: 10.1016/j.clinph.2004.09.017. [DOI] [PubMed] [Google Scholar]
- 27.Woon WL, Cichocki A, Vialatte FB, Musha T. Techniques for early detection of Alzheimer's disease using spontaneous EEG recordings. Physiological Measurement. 2007;28(4):335–347. doi: 10.1088/0967-3334/28/4/001. [DOI] [PubMed] [Google Scholar]
- 28.Dauwels J, Vialatte F, Weber T, Cichocki A. Quantifying statistical interdependence by message passing on graphs—part II: multidimensional point processes. Neural computation. 2009;21(8):2203–2268. doi: 10.1162/neco.2009.11-08-899. [DOI] [PubMed] [Google Scholar]
- 29.Vialatte FB, Solé-Casals J, Cichocki A. EEG windowed statistical wavelet scoring for evaluation and discrimination of muscular artifacts. Physiological Measurement. 2008;29(12):1435–1452. doi: 10.1088/0967-3334/29/12/007. [DOI] [PubMed] [Google Scholar]
- 30.Tallon-Baudry C, Bertrand O, Delpuech C, Pernier J. Stimulus specificity of phase-locked and non-phase-locked 40 Hz visual responses in human. Journal of Neuroscience. 1996;16(13):4240–4249. doi: 10.1523/JNEUROSCI.16-13-04240.1996. [DOI] [PMC free article] [PubMed] [Google Scholar]
- 31.Ohara S, Crone NE, Weiss N, Lenz FA. Attention to a painful cutaneous laser stimulus modulates electrocorticographic event-related desynchronization in humans. Clinical Neurophysiology. 2004;115(7):1641–1652. doi: 10.1016/j.clinph.2004.02.023. [DOI] [PubMed] [Google Scholar]
- 32.Herrmann CS, Grigutsch M, Busch NA. EEG oscillations and wavelet analysis. In: Handy T, editor. Event-Related Potentials: A Methods Handbook. Cambridge, Mass, USA: MIT Press; 2005. pp. 229–259. [Google Scholar]
- 33.Chen Z, Ohara S, Cao J, Vialatte FB, Lenz FA, Cichocki A. Statistical modeling and analysis of laser-evoked potentials of electrocorticogram recordings from awake humans. Computational Intelligence and Neuroscience. 2007;2007:24 pages. doi: 10.1155/2007/10479. Article ID 10479. [DOI] [PMC free article] [PubMed] [Google Scholar]
- 34.Vialatte FB, Bakardjian H, Prasad R, Cichocki A. EEG paroxysmal gamma waves during Bhramari Pranayama: a yoga breathing technique. Consciousness and Cognition. 2009;18(4):977–988. doi: 10.1016/j.concog.2008.01.004. [DOI] [PubMed] [Google Scholar]
- 35.Le Van Quyen M, Bragin A. Analysis of dynamic brain oscillations: methodological advances. Trends in Neurosciences. 2007;30(7):365–373. doi: 10.1016/j.tins.2007.05.006. [DOI] [PubMed] [Google Scholar]
- 36.Vialatte FB, Solé-Casals J, Dauwels J, Maurice M, Cichocki A. Bump time-frequency toolbox: a toolbox for time-frequency oscillatory bursts extraction in electrophysiological signals. BioMedCentral Neuroscience. 2009;10, article ID 46 doi: 10.1186/1471-2202-10-46. [DOI] [PMC free article] [PubMed] [Google Scholar]
- 37.Browne M, Cutmore TRH. Low-probability event-detection and separation via statistical wavelet thresholding: an application to psychophysiological denoising. Clinical Neurophysiology. 2002;113(9):1403–1411. doi: 10.1016/s1388-2457(02)00194-3. [DOI] [PubMed] [Google Scholar]
- 38.Vialatte FB, Cichocki A. Split-test bonferroni correction for QEEG statistical maps. Biological Cybernetics. 2008;98(4):295–303. doi: 10.1007/s00422-008-0210-8. [DOI] [PubMed] [Google Scholar]
- 39.Rojas-Líbano D, Kay LM. Olfactory system gamma oscillations: the physiological dissection of a cognitive neural system. Cognitive Neurodynamics. 2008;2(3):179–194. doi: 10.1007/s11571-008-9053-1. [DOI] [PMC free article] [PubMed] [Google Scholar]
- 40.Schinkel S, Marwan N, Kurths J. Order patterns recurrence plots in the analysis of ERP data. Cognitive Neurodynamics. 2007;1(4):317–325. doi: 10.1007/s11571-007-9023-z. [DOI] [PMC free article] [PubMed] [Google Scholar]
- 41.Helkala EL, Hänninen T, Hallikainen M, et al. Slow-wave activity in the spectral analysis of the electroencephalogram and volumes of hippocampus in subgroups of Alzheimer’s disease patients. Behavioral Neuroscience. 1996;110(6):1235–1243. doi: 10.1037//0735-7044.110.6.1235. [DOI] [PubMed] [Google Scholar]
- 42.Fernández A, Arrazola J, Maestú F, et al. Correlations of hippocampal atrophy and focal low-frequency magnetic activity in Alzheimer disease: volumetric MR imaging-magnetoencephalographic study. American Journal of Neuroradiology. 2003;24(3):481–487. [PMC free article] [PubMed] [Google Scholar]
- 43.Uhlhaas PJ, Singer W. Neural synchrony in brain disorders: relevance for cognitive dysfunctions and pathophysiology. Neuron. 2006;52(1):155–168. doi: 10.1016/j.neuron.2006.09.020. [DOI] [PubMed] [Google Scholar]


