Abstract
The basic premise of neuroprotection in acute stroke is the presence of salvageable tissue, but the spatiotemporal volume profiles of the penumbra and infarction remain poorly defined in preclinical animal models of acute stroke used to evaluate therapies for clinical application. Our aim was to define these profiles using magnetic resonance imaging (MRI) quantitative cerebral blood flow (CBF) and apparent diffusion coefficient (ADC) for dual-parameter voxel analysis in the rat suture permanent middle cerebral artery occlusion (pMCAO) model. Eleven male Sprague Dawley rats were subjected to pMCAO with MRI measurements of quantitative CBF and ADC at baseline, over the first 4 h (n=9) and at 7, 14, and 21 days (n=4). Voxel analysis of CBF and ADC was used to characterize brain tissue ischemic transitions. Penumbra, core, and hyperemic infarction volumes were significantly elevated (P<0.05) and unchanged over the first 4 h of pMCAO while the total lesion volume progressively rose. At 7, 14, and 21 days, tissue compartment transitions reflected infarction, tissue cavitation, and selective ischemic neuronal necrosis. Anatomical distribution of penumbra and core revealed marked heterogeneity with penumbra scattered within core and penumbra persisting even after 4 h of permanent MCAO.
Keywords: Acute stroke, Apparent diffusion coefficient, Cerebral blood flow, Diagnosis, Magnetic resonance imaging
A basic concept in neuroprotection for acute stroke is the presence of salvageable tissue at intervention. Thus, in animal models of acute stroke used to evaluate neuroprotective strategies, information on the spatio-temporal profiles of penumbra and infarction during focal ischemia and after reperfusion is essential to select the optimal time and duration of therapeutic intervention for maximal therapeutic effect while avoiding the potentially devastating effect of hemorrhagic transformation with recanalization. The volume of penumbra represents the potential for therapeutic salvage and the volume of infarction, the potential for hemorrhagic transformation [1–4].
Although the importance of identifying the ischemic penumbra has been clearly demonstrated in terms of neurologic improvement with successful recanalization in clinical acute stroke [1–4], accurate and detailed temporal profiles of penumbra and infarction in animal models of acute stroke during ischemia and after reperfusion are lacking despite extensive investigation [5–12].
The importance of temporal profiles of the penumbra and infarction in acute stroke animalmodels is especially important with the trend at the NIH toward combination therapy [13] aimed at specific pathophysiological processes from hours to days and weeks in acute stroke [14–16]. The importance of the timing of therapeutic intervention is also exemplified by the disappearance after several weeks of recovery, of the early beneficial effects of short duration hypothermia [14, 15], and anesthetic protection applied early post-insult [17, 18].
Two aspects of the ischemic penumbra and core have confounded their identification and quantitation. First, the classical pattern of core surrounded by penumbra, i.e., fried egg pattern [19–21], occurs in 30% of acute stroke patients whereas in 70%, the penumbra is heterogeneously scattered within the core tissue, i.e., archipelago pattern, thus precluding quantitation by volumetric analysis.
The heterogeneity of penumbra and core creates the second problem in that clinically, the penumbra is defined by the difference between visually drawn volumes of interest (VOI) for diffusion (DWI) and perfusion (PWI) weighted magnetic resonance imaging (MRI) images to obtain the mismatch volume. The heterogeneity of the penumbra and core distribution within these volumes could lead to confusion regarding the reliability of apparent diffusion coefficient (ADC) in identifying the infarction volume [22].
The solution to the quantitation of the penumbra and infarction despite their heterogeneity was provided in a seminal study by Shen et al. [5], who used voxel analysis by quantitative cerebral blood flow (CBF) and ADC, two relevant physiological variables characterizing the severity of ischemia to track tissue ischemic transitions and the spatio-temporal profiles of the penumbra and core in time. They revealed the heterogeneity of penumbra and core in anatomical distribution by voxel analysis, but by adjusting the CBF and ADC thresholds in a rat after 3 h of permanent middle cerebral artery occlusion (MCAO) to match the 2,3,5-triphenyltetrazolium chloride (TTC)-defined infarct at 24 h, they converted the voxel to volumetric analysis which was then used in subsequent studies [6, 7, 9].
Voxel analysis using multiparametric MR parameters of diffusion-, T2-, and T1-weighted imaging (DWI, T2WI, and T1WI, respectively) in the iterative self-organizing data analysis (ISODATA) method, as developed by Chopp and colleagues [10–12], differentiates normal from abnormal tissue. In a modification of the method, Shen et al. [8] used quantitative CBF and ADC voxel analysis by ISODATA cluster analysis and tracked penumbra and core for up to 3 h of permanent MCAO which failed to reveal the heterogeneity previously observed using threshold voxel analysis of CBF and ADC. This difference raises a question as to whether the ISODATA cluster analysis altered the fidelity of the CBF–ADC relationship [5]. Thus, we believe that the spatio-temporal profile of the penumbra and infarction in the rat MCAO model remains to be accurately defined for use in the rational development and optimization of neuroprotective therapies for acute stroke.
In this study, we examined the spatio-temporal and volume profiles of the ischemic penumbra and infarction in the rat suture model of pMCAO by quantitative CBF and ADC voxel analysis as described by Shen et al. [5]. Quantitative CBF and ADC thresholds were defined by the mean ± 2SD of the pre-ischemic voxel distribution, which was used to determine the evolution of ischemic tissue compartments for up to 3-week recovery. Serial MRI scans were performed at baseline through the first 4 h and at 7, 14, and 21 days of recovery.
Materials and Methods
Animal Preparation
The protocol was approved by the Animal Care and Use Committee of Carnegie Mellon University and the University of Pittsburgh. Thirteen male Sprague Dawley rats (300–350 g, Charles Rivers Laboratories, Wilmington, MA, USA) were studied. Rats were incubated and mechanically ventilated on 2:1 oxygen/nitrous oxide and 2% isoflurane. Femoral artery and venous catheters (PE-50) were inserted for blood pressure and heart rate monitoring, arterial blood sampling, and fluid replacement.
Permanent MCAO (pMCAO) was induced by 2.5-cm 4-0 nylon suture inserted into the internal via the external carotid artery as previously described [23]. Rectal temperature was maintained at 37.0±0.5°C, using a warm air system (SA Instruments, New York, NY, USA). Physiological parameters were monitored continuously and blood gasses measured at baseline, midpoint, and the end of the MRI scans. MRI scans were performed before pMCAO and at 1, 2, 3, and 4 h post pMCAO (4H group, n=9). A second group with pMCAO was recovered after an MRI scan at 1 h with repeat scans at 7, 14, and 21 days (n=4). Only two animals survived to 21 days, one to 7, and one to 14 days. Recovered animals were monitored and provided with water and liquid food as needed.
Magnetic Resonance Imaging
Animals were placed prone and imaged using a 4.7-Tesla, 40-cm bore Bruker AVANCE system (Billerica, MA, USA), equipped with a 12-cm shielded gradient insert. A 72-mm volume coil with 2.5-cm actively decoupled brain surface coil was used for imaging.
Average ADC was obtained using established parameters [5–7]. Briefly, three ADC maps with diffusion-sensitive gradients applied separately along the x, y, or z direction, were averaged. A single shot spin-echo, echo planar image (SE-EPI) sequence was acquired with matrix=64×64, TR= 2 s, FOV=2.3 cm, 90° flip angle, b=10, 500, 1,500 s/mm2, Δ= 15 ms, δ=5 ms, and 16 averages.
Continuous arterial spin labeling (ASL) was used to quantify CBF [24, 25]. A single shot, SE-EPI sequence with a TR=2 s, 64×64 matrix, FOV=2.3 cm, 2-s labeling pulse, with the labeling pulse for the inversion plane positioned ±2 cm from the perfusion detection plane. The use of SE-EPI for ASL minimizes pixel misalignment.
Maps of the spin lattice relaxation time of tissue water (T1obs) were generated from a series of spin-echo images with variable TR (FOV=2.3 cm, four averages, 64×64 matrix) [26].
Image Analysis
CBF and ADC data were analyzed with in-house code in Matlab (MathWorks Inc., Natick, MA, USA) for the left (ipsilateral) and right (contralateral) hemisphere. Representative CBF and ADC maps were created using Image J software [27].
Voxel maps of (MC − ML) · MC−1 were generated from the perfusion data, where MC=magnetization intensity from the control image and ML=magnetization intensity from the labeled image. The average of the two maps was computed and negative pixels retained for quantification. T1obs maps were generated from the series of variable TR images by a non-linear fit to
| (1) |
where M(t)=signal intensity at TR time t and M0=signal intensity at equilibrium. Regional CBF was then calculated from [28]
| (2) |
where λ=blood–brain partition coefficient of water, with an assumed spatially constant value of 0.9 mL/g [29] and α= spin-labeling efficiency of 0.7 [30].
ADC maps were calculated by [31]
| (3) |
where Si=signal intensity with bi and So=signal intensity obtained with bo.
| (4) |
Voxel Analysis
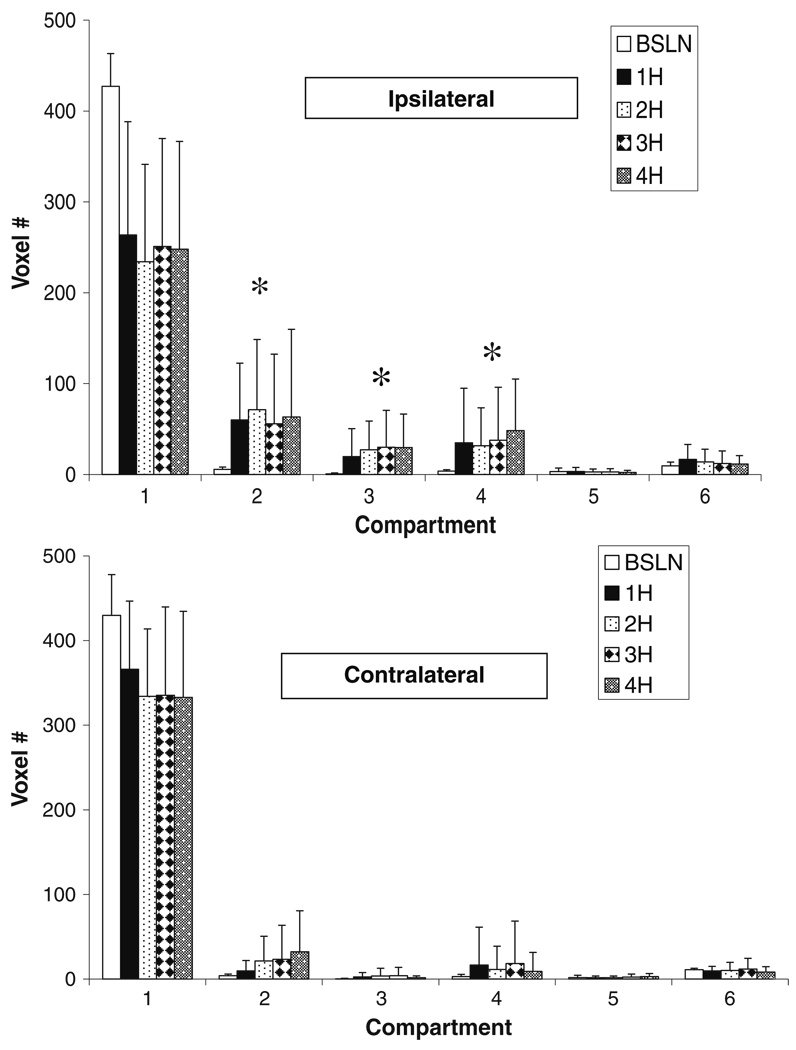
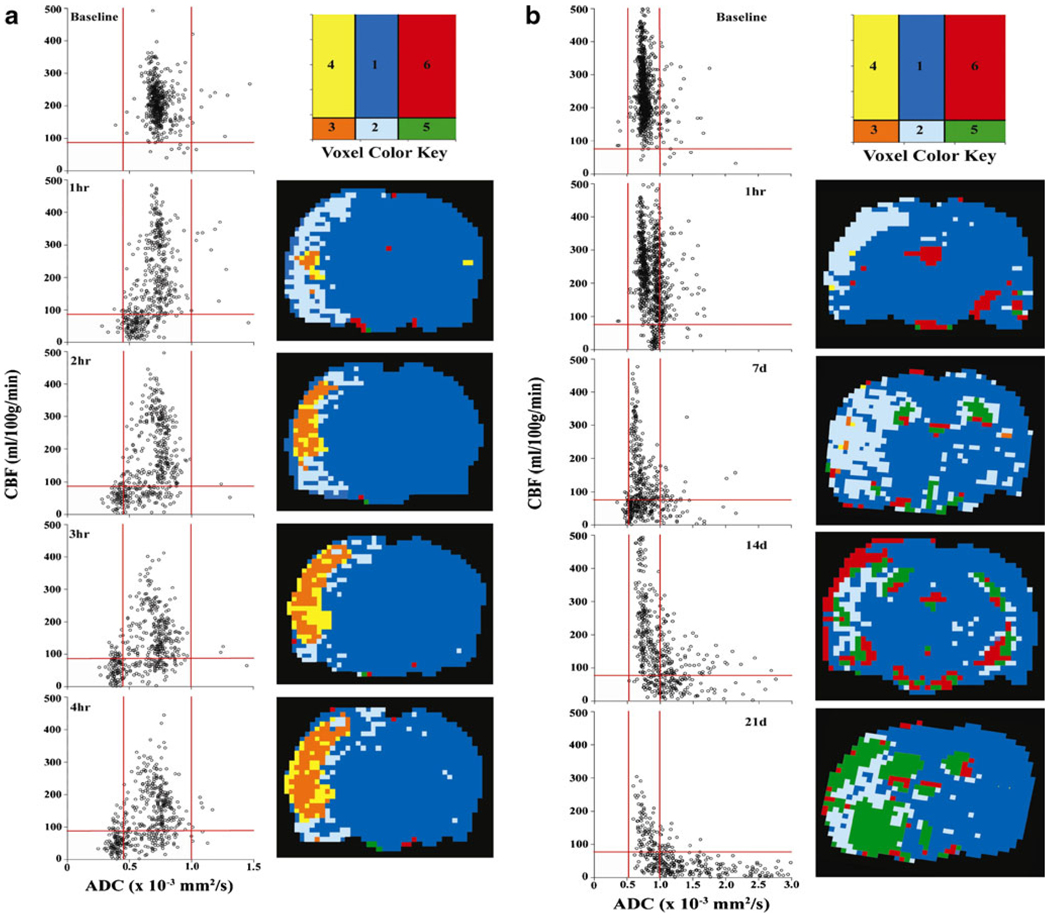
Compartment thresholds ADC and CBF were defined as the mean ± 2SD values of pre-ischemic CBF and ADC in the ipsilateral hemisphere. On this basis, the lower CBF threshold represented a 72%±14% reduction in CBF (n=11) and upper and lower limits of 33%±7% above and 33%±7% below (n=11) mean ADC. Using these thresholds as determined for individual animals, the following compartments were created as follows (see Fig. 3): compartment 1 = normal, normal ADC and CBF; 2 = ischemic penumbra, ADC normal, CBF below normal; 3=ischemic core, low ADC and CBF; 4=high-flow infarction area, low ADC normal CBF; 5= ischemic necrosis/tissue dissolution, high ADC low CBF; and 6 is undefined. Each voxel represents a volume of 2.57 µl.
Fig. 3.
Tissue compartmental volumes (voxel #, voxel = 2.57 µl) as illustrated in Fig. 2a for the ipsilateral (top) and contralateral (bottom) hemispheres up to 4H post pMCAO (n=9). Significant (P<0.05) differences were observed between baseline and 1- through 4-h volumes in compartments 2 through 4 in the left hemisphere. In the right hemisphere, significant differences between baseline and hours one through 4 were observed in compartments 2, 3, and 4. *P<0.005 compared to baseline
Histology
The brains of pentobarbital anesthetized rats, 50 mg/kg, i.p., were transcardially perfused with 100 ml of normal saline followed by 100 ml of 2% paraformaldehyde and immersed in 10% buffered formalin. The brains were cut, paraffin embedded, sectioned, and stained with hematoxylin–eosin and read by Dr. Rao.
Statistical Analysis
The data were analyzed using repeated measures ANOVA with Bonferroni correction (P<0.01) for significant differences to compare the six groups at each time point to determine the differences within each group over time. Data were expressed as mean ± SD.
Results
Physiological Variables (Table 1)
Table 1.
Physiological data in two groups of rats studied by MRI pre-stroke and for up to 4 h (4H) and 21 days (21D) post-stroke (data are mean ± SD)
| Pre-stroke 4H (n=8) | Post-stroke 4H (n=8) | Pre-stroke 21D (n=2) | Post-stroke 21D (n=2) | |
|---|---|---|---|---|
| MABP (mmHg) | 90±15 | 85±6 | 89±8 | 90±7 |
| PaCO2 (mmHg) | 40.5±6.3 | 38.1±10.4 | 41.6±10.7 | 30.6±2.8 |
| PaO2 (mmHg) | 236.2±79.2 | 239.8±81.7 | 235.5±47.4 | 314.5±17.7 |
| pH | 7.43±0.06 | 7.41±0.07 | 7.42±0.06 | 7.50±0.04 |
| Hematocrit (%) | 35±5 | 33±3 | 34±1 | 34±3 |
| Heart rate (bpm) | 334±52 | 389±35 | 380±13 | 358±18 |
| Weight (g) | 370±30 | 370±30 | 372±31 | 372±31 |
Rectal temperature was maintained at 37.0°C±0.5°C. Mean PaCO2 and PaO2 values were not significantly different pre- and post-stroke. MABP was similar between the 4H and 21D groups at 90±15, 85±6, 89±8, and 90±7, respectively. Hematocrit, body weight, and arterial pH were also not different.
MRI
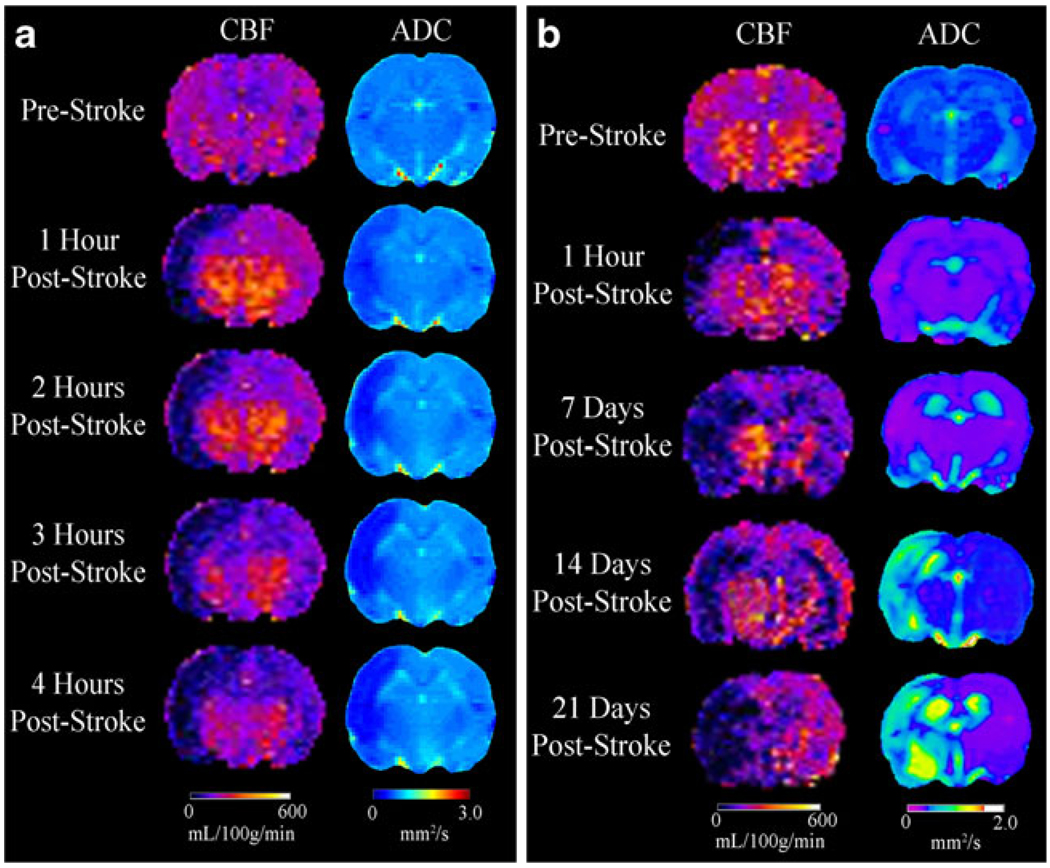
Representative CBF and ADC maps for 4H and 21D rats are shown in Fig. 1a, b, respectively. Baseline CBF ranged from 220 to 300 mL/100 g/min, consistent with previously reported values [32]. One hour after pMCAO (Fig. 1a), a large region of reduced CBF was observed in the ipsilateral hemisphere that progressively increased in size between 2 and 4 h. It expanded from cortical to subcortical regions, hippocampus and striatum, and extended into the contralateral hemisphere.
Fig. 1.
Representative examples of changes in CBF and ADC in rats before and up to 4 h (a) and 21 days (b) following pMCAO showing increasing severity and spread of ischemia and edema in the ipsilateral hemisphere including changes in the contralateral hemisphere
Baseline mean ADC was 0.74±0.06×10⁻³ mm2/s comparable to that previously reported [32]. One hour after pMCAO, ADC fell significantly from 0.68±0.06×10⁻³ mm2/s to 0.51±0.08×10⁻³ mm2/s at 4 h (Fig. 1a). At 21 days (Fig. 1b), ADC increased to 1.56±0.09×10⁻³ mm2/s. In 4H rats, ipsilateral ADC changes paralleled CBF which continued to increase in size for up to 4 h. CBF changes were also seen in the contralateral hemisphere without apparent changes in ADC.
In a rat studied for up to 21 days after pMCAO (Fig. 1b), CBF fell sharply at 1 h restricted to the cerebral cortex but expanded to the hemisphere at 7, 14, and 21 days. Contralateral CBF decreased between 1 h and 7 days and recovered slightly at 14 and 21 days. ADC decreased after 1 h and continued through 7 days but increased at 14 and 21 days.
Voxel Analysis
Quantitative CBF and ADC voxel analysis for the ipsilateral hemisphere shows the tissue ischemic transitions after pMCAO in 4H (Fig. 2a) and 21D (Fig. 2b) rats. CBF/ADC voxel plots with compartments 1 through 6 from 1 to 4 h after pMCAO show the ischemic tissue transitions while transfer to the anatomical localization reveals the heterogeneity of the penumbra, core, and hyperemic core with the tissues interspersed within each other. After 4 h of MCAO, core volume increased but with penumbra and hyperemic tissue within and around the core.
Fig. 2.
Representative quantitative CBF versus ADC voxel plots in a rat before and during pMCAO for up to 4H (a) and 21D (b). The ischemic transition compartments are 1 = normal ADC, CBF; 2 = penumbra, low CBF, normal ADC; 3=core, low CBF, low ADC; 4=high-flow infarction, low ADC, normal–high CBF; 5=ischemic necrosis and dissolution, high ADC, low CBF; and 6 = unidentified. Red lines represent upper and lower bounds (mean ± 2SD) of ADC and the lower threshold of CBF (−2SD)
Voxel analysis of CBF and ADC for a rat recovered to 21 days shows the transition of voxels fromnormal to ischemic penumbra at 1 h post-insult (Fig. 2b). At 7 days, a large number of penumbra voxels fell into the subcortical and striatal regions. The number of voxels in the penumbra persisted at days 14 and 21. It is unlikely that these voxels represent penumbral tissue but rather tissue suffering selective neuronal necrosis with low CBF and normal ADC as discussed later.
Quantitation of the number of voxels in each compartment for both hemispheres in the 4H group showed increased penumbral volume at 1 h which remained unchanged after 4 h (Fig. 3 top). Compartments 3 and 4 represent irreversibly injured core, which is hypo and hyperperfused, respectively, which was unchanged over 4 h. Changes were also observed in the contralateral hemisphere with significant increases in penumbra and hyperemic core.
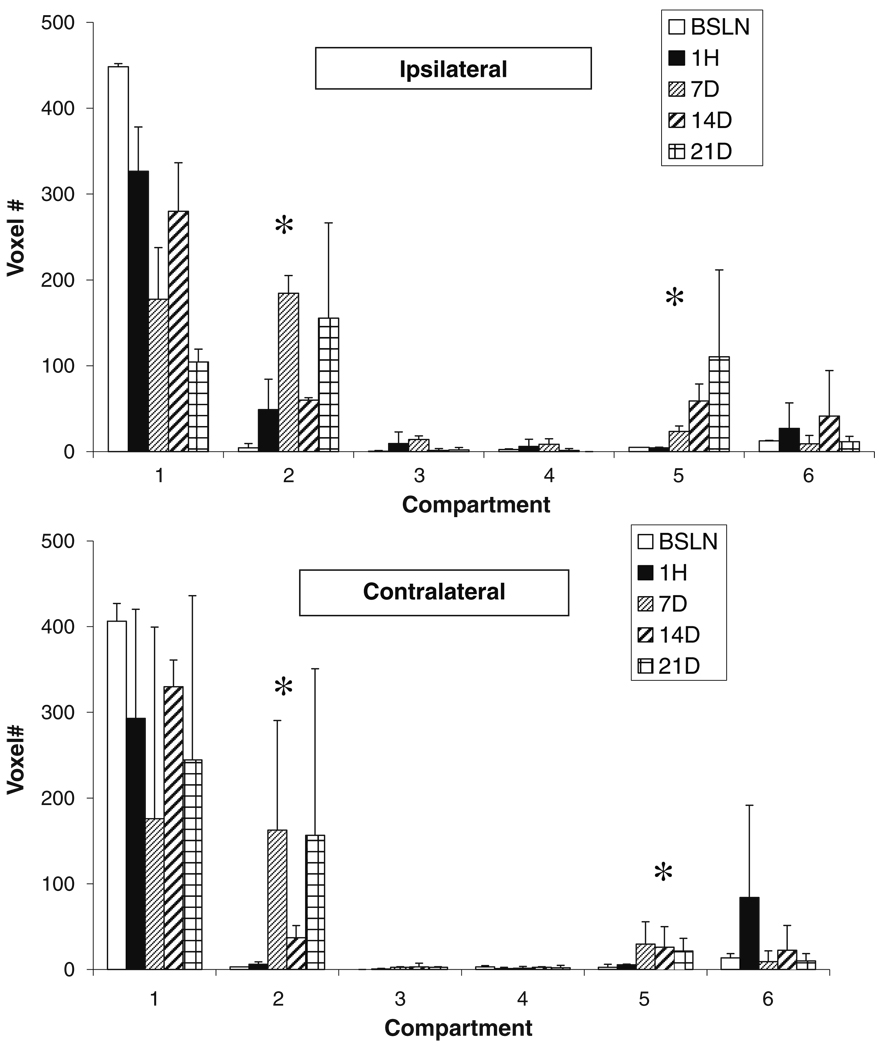
Changes in voxel number in compartments at 1 h and 7, 14, and 21 days show that penumbral volume increased at 1 h and then markedly at 7 days, declined at 14 days then increased again at 21 days (Fig. 4, top). A significant and progressive increase in compartment 5 indicated cavitation with ADC values similar to that for cerebrospinal fluid.
Fig. 4.
Tissue compartmental volumes (voxel #, voxel = 2.57 µl) as illustrated in Fig. 2b for the ipsilateral (top) and contralateral (bottom) hemispheres for up to 21 days post pMCAO. Statistical analyses were not done because n=2. However, compared to baseline, at 7 days, compartment 2 (penumbra) and, at 21 days, compartment 5 (cavitation) were markedly elevated. *P<0.05 compared to baseline
A significant increase in penumbra voxels in the contralateral hemisphere paralleled that in the ipsilateral hemisphere (Fig. 4, lower panel). Changes in compartment 5 were also observed in the contralateral hemisphere.
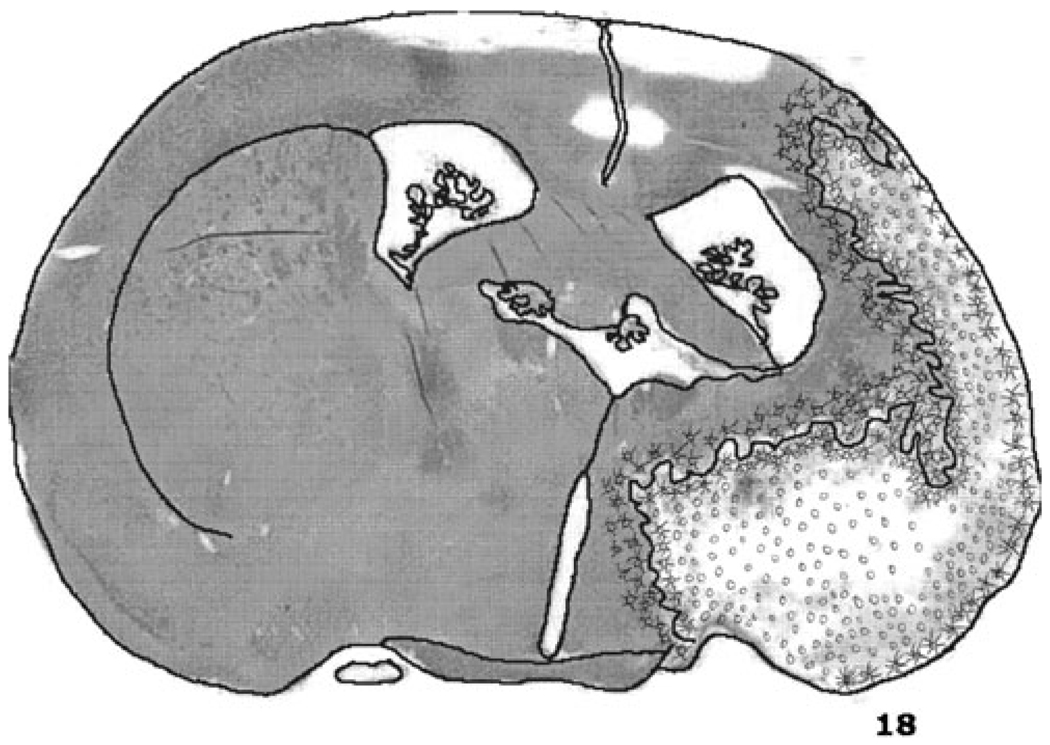
Histology of a brain of one of the rats studied at 21 days with a drawing of the brain section illustrates the microscopic examination of the tissue by one of us (GR Rao; Fig. 5). The drawing illustrates the region suffering ischemic neuronal necrosis on the borders of the infraction.
Fig. 5.
Free hand drawing of a section of the brain depicting the regions of tissue dissolution or cavitation (o) and ischemic neuronal necrosis with neuronal fallout (x) drawn by GRR
Discussion
Our studies show that quantitative CBF and ADC voxel compartmental analysis reveals the heterogeneity in the spatio-temporal profile of the ischemic penumbra and infarction precluding the use of volumetric analysis for accurate measurement of these tissue volumes. It also showed that despite voxel migration between compartments, penumbra, core, and hyperemic core volumes remained relatively unchanged in the first 4 h after permanent MCAO. Tissue dissolution after 1 through 3 weeks after pMCAO was reflected by voxel migration into compartment 5 with low CBF and high ADC while the persistence of voxels in penumbra compartment 2 for up to 3 weeks after pMCAO was likely indicative of tissue suffering selective ischemic neuronal necrosis without infarction. These results could shed light on the methods used to evaluate the spatio-temporal profile of penumbra and core in the rat MCAO model which we believe has not been adequately or accurately characterized based on the methods used. Information on the spatio-temporal profile of penumbra and infarction is not being used for the rational development of neuroprotective strategies for optimal efficacy.
The classical notion of the ischemic penumbra is that of a core surrounded by a penumbra [19, 20]. However, our study and that of Shen et al. [5–7] have shown that the penumbra is frequently embedded within the core. Olivet et al. [21] found that 70% of the DEFUSE patients had what they described as an archipelago pattern of penumbra distributed within the core as opposed to the classical “fried egg pattern.” This heterogeneous distribution of penumbra and core eliminates volumetric evaluation of penumbra and core as the heterogeneity within these tissue volumes in the perfusion and diffusion MRI images may contain voxels associated with penumbra or benign oligemia [22]. The only method of analysis of CT and MRI images on clinical scanners are volumetric-based, and until voxel-based analysis becomes available, volumetric analysis and perfusion–diffusion mismatch may be clinically “good enough” [1–4] for clinical trials.
The use of the mean ± 2SD of the baseline voxels of the ipsilateral hemisphere resulted in thresholds associated with a 72% reduction in CBF, i.e., to 30% of control and upper and lower thresholds of 33% above and below the mean ADC are similar to the thresholds reported by Hoehn-Berlage et al. [33] and Kohno et al. [34] based on mean ± 2SD. They reported a decrease in CBF to 70% of control associated with acidosis and a decrease to 30% of control associated with a decrease in ATP. In a comprehensive review, Hossmann [35] set the CBF threshold for acidosis, i.e., penumbra at 70% of control and for infarction at a CBF of 40% of control. Shen et al. [5] obtained CBF and ADC thresholds of 42% and 72% of control after 180 min of permanent MCAO as defined by TTC-defined infarct volume at 24 h. Our ADC thresholds of a 33% decrease in ADC, i.e., 70% of control, for core approximated ADC values of 77% of control for core [33, 34].
Shen et al. [5, 6] used quantitative CBF and ADC with voxel and compartmental analysis to objectively define ischemic tissue transitions. However, they adjusted the MRI CBF and ADC thresholds after 180 min of pMCAO to match the infarct volume of the TTC-stained rat brain at 24 h. This was problematic because it may create bias in the results. First, adjusting the CBF and ADC thresholds after 180 min of pMCAO to equal the TTC stained 24 h infarction volume, we believe, predestined their observation that after 3 h of pMCAO the penumbra was zero, i.e., CBF volume−ADC volume=0. Second, Reith et al. [36] was cited as the basis for their use of 24 h as the final infarct volume, but their study only went up to 24 h and not beyond. Third, the use of TTC staining for final infarction volume does not accurately reflect the final infarction volume especially without reperfusion [37, 38]. In a report by this same group, after 95 min of pMCAO with reperfusion, the post reperfusion ADC volume exceeded CBF volume suggesting that the preset ADC threshold was exceeded [6]. Our data do not support their finding that penumbral volume disappears after 3 h of pMCAO.
Our data show that after pMCAO in the rat, the penumbra volume increases after 1 h and remains about the same for up to 4 h, which differs from the results of Shen et al. [7]. In acute stroke patients, the penumbra persists for up to 8 h based on xenon/CT CBF measurements [39] and up to 24 h by 18F-fluoromisonidazole [40]. In baboons with acute stroke, infarct enlargement continues for up to 2 days after transient MCAO and even after 23 days with pMCAO [41]. While providing snapshots of penumbra at different times of ischemia, these studies do not provide a temporal profile of the penumbra in acute stroke.
Despite promising results in identifying penumbra in acute stroke and positive results in the response of patients identified with penumbra to recanalization [1–4], concern about the accuracy of these methods in estimating the penumbra is indicated by the requirement for a 2.6 DWI/PWI mismatch ratio to achieve 90% sensitivity and 83% specificity [42]. It has also been suggested that ADC identifies not only tissue destined for infarction but also penumbra and benign oligemia which we believe is a result of the overlap in ADC values within the “core” by visually defined VOI [22].
In the two rats surviving 21 days of pMCAO, tissue cavitation was documented by the migration of voxels into compartment 5 with high ADC and low CBF and a large number of voxels in compartment 2 or penumbra [43]. These “penumbra” voxels at 21 days likely represent selective neuronal necrosis with reduced CBF and metabolic rate with normal ADC [44]. Migration of the voxels into compartment 5 at 21 days consistent with cavitation as documented by histopathology supports the validity of the ischemic tissue transitions by quantitative CBF and ADC voxel analysis.
In summary, our study shows that the heterogeneity of the spatio-temporal distribution of the penumbra and infracted brain tissue after acute stroke in the rat MCAO model precludes the use of volumetric analysis of the penumbra and infarction. Second, the thresholds for CBF and ADC as defined by the mean ± 2SD compares favorably with thresholds obtained by others [9]. Finally, we have shown that in the rat MCAO model of permanent MCAO, penumbra and core volumes remain relatively unchanged rather than disappearing as previously reported, but whether this would be observed beyond 4 h of permanent MCAO remains to be seen.
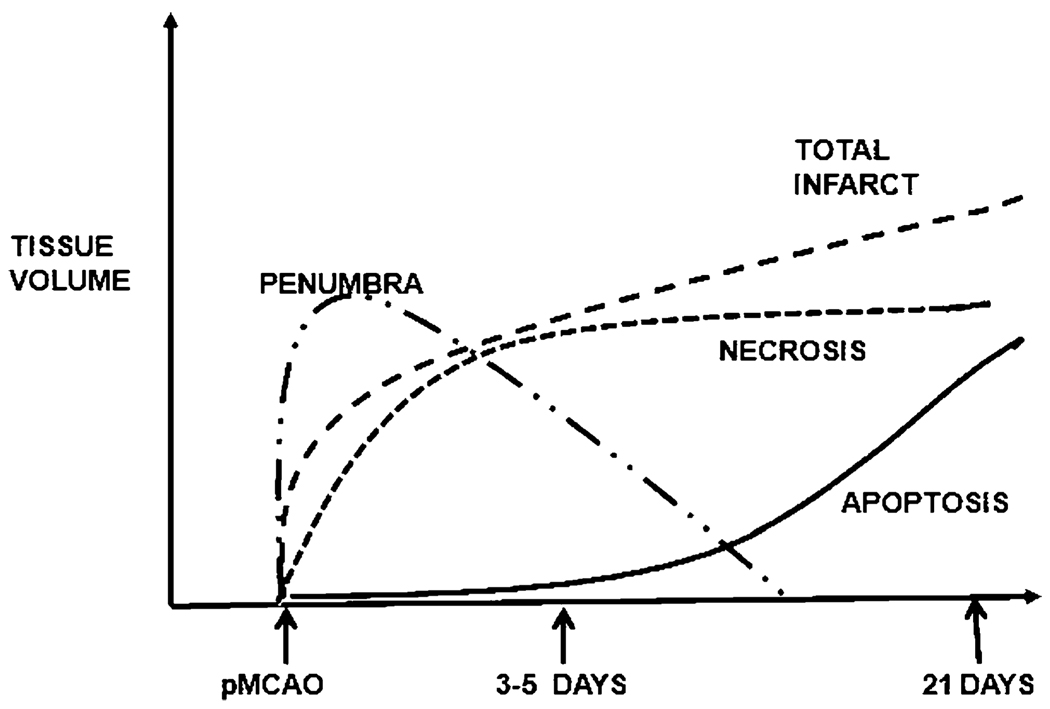
Our ultimate objective is to be able to define the spatiotemporal and volume profiles of the ischemic penumbra and infarction and necrosis and apoptosis (Fig. 6), and the basis of which targeted, combination therapies can be tested for optimal efficacy. The use of the quantitative CBF and ADC voxel analysis combined with histopathology with immunostaining would enable definition of these profiles in this widely used rat MCAO model. With knowledge of the time course of penumbra, infarction, necrosis, and apoptosis after permanent or transient MCAO in this rat model, it will then be possible to evaluate the efficacy of multimodal and targeted therapies designed to counter specific pathophysiologic and metabolic processes after stroke.
Fig. 6.
Hypothetical illustration of the temporal profile of the ischemic penumbra and infarction and necrosis and apoptosis after MCAO in the rat
Acknowledgments
This work was supported by NIH grants # NS051639, NS061216, and NIH grant P41EB-001977 to the Pittsburgh NMR Center for Biomedical Research
Contributor Information
Lesley M. Foley, Email: lmfoley@andrew.cmu.edu, Pittsburgh NMR Center for Biomedical Research, Carnegie Mellon University, Pittsburgh, PA 15213, USA.
T. Kevin Hitchens, Pittsburgh NMR Center for Biomedical Research, Carnegie Mellon University, Pittsburgh, PA 15213, USA; Department of Biological Sciences, Carnegie Mellon University, Pittsburgh, PA 15213, USA.
Brent Barbe, Email: bbarbe@andrew.cmu.edu, Pittsburgh NMR Center for Biomedical Research, Carnegie Mellon University, Pittsburgh, PA 15213, USA.
Feng Zhang, Department of Neurology, University of Pittsburgh, Pittsburgh, PA 15213, USA, ZhanFx2@upmc.edu.
Chien Ho, Email: chienho@andrew.cmu.edu, Pittsburgh NMR Center for Biomedical Research, Carnegie Mellon University, Pittsburgh, PA 15213, USA; Department of Biological Sciences, Carnegie Mellon University, Pittsburgh, PA 15213, USA.
Gutti R. Rao, Department of Pathology, University of Pittsburgh, Pittsburgh, PA 15213, USA, raogutti@pitt.edu
Edwin M. Nemoto, Department of Neurosurgery, University of New Mexico, Albuquerque, NM 87131, USA Department of Neurosurgery, University of New Mexico School of Medicine, Domenici Hall/BRaIN Center, Room 1131B, 1101 Yale Blvd, Albuquerque, NM 87131, USA, enemoto@salud.unm.edu.
References
- 1.Albers GW, Thijs VN, Wechsler L, Kemp S, Schlaug G, Skalabrin E, et al. Magnetic resonance imaging profiles predict clinical response to early reperfusion: the diffusion and perfusion imaging evaluation for understanding stroke evolution (DEFUSE) study. Ann Neurol. 2006;60:508–517. doi: 10.1002/ana.20976. [DOI] [PubMed] [Google Scholar]
- 2.Hacke W, Albers G, Al-Rawi Y, Bogousslavsky J, Davalos A, Eliasziw M, et al. The Desmoteplase in Acute Ischemic Stroke Trial (DIAS): a phase II MRI-based 9-hour window acute stroke thrombolysis trial with intravenous desmoteplase. Stroke. 2005;36:66–73. doi: 10.1161/01.STR.0000149938.08731.2c. [DOI] [PubMed] [Google Scholar]
- 3.Furlan AJ, Eyding D, Albers GW, Al-Rawi Y, Lees K, et al. Dose Escalation of Desmoteplase for Acute Ischemic Stroke (DEDAS): evidence of safety and efficacy 3 to 9 hours after stroke onset. Stroke. 2006;37:1227–1231. doi: 10.1161/01.STR.0000217403.66996.6d. [DOI] [PubMed] [Google Scholar]
- 4.Toth G, Albers GW. Use of MRI to estimate the therapeutic window in acute stroke: is perfusion-weighted imaging/diffusion-weighted imaging mismatch an EPITHET for salvageable ischemic brain tissue? Stroke. 2009;40:333–335. doi: 10.1161/STROKEAHA.108.525683. [DOI] [PubMed] [Google Scholar]
- 5.Shen Q, Meng X, Fisher M, Sotak CH, Duong TQ. Pixel-by-pixel spatiotemporal progression of focal ischemia derived using quantitative perfusion and diffusion imaging. J Cereb Blood Flow Metab. 2003;23:1479–1488. doi: 10.1097/01.WCB.0000100064.36077.03. [DOI] [PMC free article] [PubMed] [Google Scholar]
- 6.Bardutzky J, Shen Q, Henninger N, Schwab S, Duong TQ, Fisher M. Characterizing tissue fate after transient cerebral ischemia of varying duration using quantitative diffusion and perfusion imaging. Stroke. 2007;38:1336–1344. doi: 10.1161/01.STR.0000259636.26950.3b. [DOI] [PMC free article] [PubMed] [Google Scholar]
- 7.Shen Q, Fisher M, Sotak CH, Duong TQ. Effects of reperfusion on ADC and CBF pixel-by-pixel dynamics in stroke: characterizing tissue fates using quantitative diffusion and perfusion imaging. J Cereb Blood Flow Metab. 2004;24:280–290. doi: 10.1097/01.WCB.0000110048.43905.E5. [DOI] [PMC free article] [PubMed] [Google Scholar]
- 8.Shen Q, Ren H, Fisher M, Bouley J, Duong TQ. Dynamic tracking of acute ischemic tissue fates using improved unsupervised ISODATA analysis of high-resolution quantitative perfusion and diffusion data. J Cereb Blood Flow Metab. 2004;24:887–897. doi: 10.1097/01.WCB.0000124321.60992.87. [DOI] [PMC free article] [PubMed] [Google Scholar]
- 9.Shen Q, Ren H, Fisher M, Duong TQ. Statistical prediction of tissue fate in acute ischemic brain injury. J Cereb Blood Flow Metab. 2005;25:1336–1345. doi: 10.1038/sj.jcbfm.9600126. [DOI] [PMC free article] [PubMed] [Google Scholar]
- 10.Jacobs MA, Zhang ZG, Knight RA, Soltanian-Zadeh H, Goussev AV, Peck DJ, et al. A model for multiparametric MRI tissue characterization in experimental cerebral ischemia with histological validation in rat. Part 1. Stroke. 2001;32:943–949. doi: 10.1161/01.str.32.4.943. [DOI] [PubMed] [Google Scholar]
- 11.Jacobs MA, Mitsias P, Soltaniaan-Zadeh H, Santhakumar S, Ghanei A, Hammound R, et al. Multiparametric MRI tissue characterization in clinical stroke with correlation to clinical outcome: part 2. Stroke. 2001;32:950–957. doi: 10.1161/01.str.32.4.950. [DOI] [PubMed] [Google Scholar]
- 12.Mitsias PD, Jacobs MA, Hammound R, Pasnoor M, Santhakumar S, Papamitsakis NIH, et al. Multiparametric MRI ISODATA ischemic lesion analysis correlation with the clinical neurological deficit and single parameter MRI techniques. Stroke. 2002;33:2839–2844. doi: 10.1161/01.str.0000043072.76353.7c. [DOI] [PubMed] [Google Scholar]
- 13.National Institute of Neurological Disorders. National Institutes of Health: Acute stroke treatment. http://www.ninds.nih.gov/find_people/groups/stroke_prg/09_2006_stroke_prg_report.htm#ACUTE.
- 14.Coimbra C, Drake M, Boris-Möller F, Wieloch T. Long-lasting neuroprotective effect of postischemic hypothermia and treatment with an anti-inflammatory/antipyretic drug. Evidence for chronic encephalopathic processes following ischemia. Stroke. 1996;27:1578–1585. doi: 10.1161/01.str.27.9.1578. [DOI] [PubMed] [Google Scholar]
- 15.Dietrich WD, Busto R, Alonso O, Globus MY-T, Ginsburg MD. Intraischemic but not postischemic hypothermia protects chronically following global forebrain ischemia in rats. J Cereb Blood Flow Metab. 1993;13:541–549. doi: 10.1038/jcbfm.1993.71. [DOI] [PubMed] [Google Scholar]
- 16.Satoh S, Toshima Y, Ikegaki I, Iwasaki M, Asano T. Wide therapeutic time window for fasudil neuroprotection against ischemia-induced delayed neuronal death in gerbils. Brain Res. 2007;1128:175–180. doi: 10.1016/j.brainres.2006.10.027. [DOI] [PubMed] [Google Scholar]
- 17.Kawaguchi M, Drummond J, Cole D, Kelly PJ, Spurlock MP, Patel PM. Effect of isoflurane on neuronal apoptosis in rats subjected to focal ischemia. Anesth Analg. 2004;98:798–805. doi: 10.1213/01.ane.0000105872.76747.f6. [DOI] [PubMed] [Google Scholar]
- 18.Inoue S, Davis DP, Drummond J, Cole DJ, Patel PM. The combination of isoflurane and caspase 8 inhibition results in sustained neuroprotection in rats subject to focal cerebral ischemia. Anesth Analg. 2006;102:1548–1555. doi: 10.1213/01.ane.0000202381.40516.8d. [DOI] [PubMed] [Google Scholar]
- 19.Kidwell CS, Alger JS, Saver JL. Beyond mismatch: evolving paradigms in imaging the ischemic penumbra with multimodality magnetic resonance imaging. Stroke. 2003;34:2729–2735. doi: 10.1161/01.STR.0000097608.38779.CC. [DOI] [PubMed] [Google Scholar]
- 20.Dirnagl U, Iadecola C, Moskowitz M. Pathobiology of ischemic stroke: an integrated view. Trends Neurosci. 1999;22:391–397. doi: 10.1016/s0166-2236(99)01401-0. [DOI] [PubMed] [Google Scholar]
- 21.Olivot J, Mlynash M, Thijs VN, Purushotham A, Kemp S, Lansberg MG. Geography, structure and evolution of diffusion and perfusion lesions in diffusion and perfusion imaging evaluation for understanding stroke evolution (DEFUSE) Stroke. 2009;40 doi: 10.1161/STROKEAHA.109.558635. 3245-2351. [DOI] [PMC free article] [PubMed] [Google Scholar]
- 22.Guadagno JV, Warburton EA, Aigbirhio FI, Smielewski P, Fryer TD, Harding S, et al. Does the acute diffusion-weighted imaging lesion represent penumbra as well as core? A combined quantitative PET/MRI voxel-based study. J Cereb Blood Flow Metab. 2004;24:1249–1254. doi: 10.1097/01.WCB.0000141557.32867.6B. [DOI] [PubMed] [Google Scholar]
- 23.Longa EZ, Weinstein PR, Carlson S, Cummins R. Reversible middle cerebral artery occlusion without craniotomy in the rat. Stroke. 1989;20:84–91. doi: 10.1161/01.str.20.1.84. [DOI] [PubMed] [Google Scholar]
- 24.Detre JA, Leigh JS, Williams DS, Koretsky AP. Perfusion imaging. Magn Reson Med. 1992;23:37–45. doi: 10.1002/mrm.1910230106. [DOI] [PubMed] [Google Scholar]
- 25.Williams DS, Detre JA, Leigh JS, Koretsky AP. Magnetic resonance imaging of perfusion using spin inversion of arterial water. Proc Natl Acad Sci USA. 1992;89:212–216. doi: 10.1073/pnas.89.1.212. [DOI] [PMC free article] [PubMed] [Google Scholar]
- 26.Hendrich KS, Kochanek PM, Williams DS, Schiding JK, Marion DW, Ho C. Early perfusion after controlled cortical impact in rats: quantification by arterial spin-labeled MRI and the influence of spin-lattice relaxation time heterogeneity. Magn Reson Med. 1999;42:673–681. doi: 10.1002/(sici)1522-2594(199910)42:4<673::aid-mrm8>3.0.co;2-b. [DOI] [PubMed] [Google Scholar]
- 27.Abramoff MD, Magelhaes PJ, Ram SJ. Image processing with Image. J. Biophotonics Int. 2005;11:36–42. [Google Scholar]
- 28.Zhang W, Williams SAC, DS KAP. NMR measurement of perfusion using arterial spin labeling without saturation of macromolecular spins. Magn Reson Med. 1995;33:370–376. doi: 10.1002/mrm.1910330310. [DOI] [PubMed] [Google Scholar]
- 29.Herscovitch P, Raichle ME. What is the correct value for the brain-blood partition coefficient for water? J Cereb Blood Flow Metab. 1985;5:65–69. doi: 10.1038/jcbfm.1985.9. [DOI] [PubMed] [Google Scholar]
- 30.Zhang W, Williams DS, Koretsky AP. Measurement of rat brain perfusion by NMR using spin labeling of arterial water: in vivo determination of the degree of spin labeling. Magn Reson Med. 1993;29:416–421. doi: 10.1002/mrm.1910290323. [DOI] [PubMed] [Google Scholar]
- 31.Stejskal EO, Tanner JE. Spin diffusion measurements: spin echoes in the presence of a time-dependent field gradient. J Chem Phys. 1965;42:288–292. [Google Scholar]
- 32.Hendrich KS, Kochanek PM, Melick JA, Schiding JK, Statler KD, Williams DS, et al. Cerebral perfusion during anesthesia with fentanyl, isoflurane, or pentobarbital in normal rats studied by arterial spin-labeled MRI. Magn Reson Med. 2001;46:202–206. doi: 10.1002/mrm.1178. [DOI] [PubMed] [Google Scholar]
- 33.Hoehn-Berlage M, Norris DG, Kohno K, Mies G, Leibfritz D, Hossmann K-A. Evolution of regional changes in apparent diffusion coefficient during focal ischemia of rat brain: the relationship of quantitative diffusion NMR Imaging to reduction in cerebral blood flow and metabolic disturbances. J Cereb Blood Flow Metab. 1995;15:1002–1011. doi: 10.1038/jcbfm.1995.126. [DOI] [PubMed] [Google Scholar]
- 34.Kohno K, Hoehn-Berlage M, Mies G, Back T, Hossmann K-A. Relationship between diffusion-weighted MR images, cerebral blood flow, and energy state in experimental brain infarction. Mag Res Imag. 1995;13:73–80. doi: 10.1016/0730-725x(94)00080-m. [DOI] [PubMed] [Google Scholar]
- 35.Hossmann K-A. Viability thresholds and the penumbra of focal ischemia. Ann Neurol. 1994;36:557–565. doi: 10.1002/ana.410360404. [DOI] [PubMed] [Google Scholar]
- 36.Reith W, Hasegawa Y, Latour LL, Dardzinski BJ, Sotak CH, Fisher M. Multislice diffusion mapping for 3-D evolution of cerebral ischemia in a rat stroke model. Neurology. 1995;45:172–177. doi: 10.1212/wnl.45.1.172. [DOI] [PubMed] [Google Scholar]
- 37.Liszczak TM, Hedley-Whyte ET, Adams JF, Han DH, Kolluri VS, Vacanti FX, et al. Limitations of tetrazolium salts in delineating infarcted brain. Acta Neuropathol. 1984;65(2):150–157. doi: 10.1007/BF00690469. [DOI] [PubMed] [Google Scholar]
- 38.Cole DJ, Drummond JC, Ghazal EA, Shapiro HM. A reversible component of cerebral injury as identified by the histochemical stain 2,3,5-triphenyltetrazolium chloride (TTC) Acta Neuropathol. 1990;80(2):152–155. doi: 10.1007/BF00308918. [DOI] [PubMed] [Google Scholar]
- 39.Jovin TG, Yonas H, Gebel JM, Kanal E, Chang YF, Grahovac SZ, et al. The cortical ischemic core and not the consistently present penumbra is a determinant of clinical outcome in acute middle cerebral artery occlusion. Stroke. 2003;34:2426–2433. doi: 10.1161/01.STR.0000091232.81947.C9. [DOI] [PubMed] [Google Scholar]
- 40.Markus R, Reutens DC, Kazui S, Read S, Wright P, Pearce DC, et al. Hypoxic tissue in ischaemic stroke: persistence and clinical consequences of spontaneous survival. Brain. 2004;127:1427–1436. doi: 10.1093/brain/awh162. [DOI] [PubMed] [Google Scholar]
- 41.Touzani O, Young AR, Derlon JR, Baron JC, MacKenzie ET. Progressive impairment of brain oxidative metabolism reversed by reperfusion following middle cerebral artery occlusion in anesthetized baboons. Brain Res. 1997;767:17–25. doi: 10.1016/s0006-8993(97)00515-5. [DOI] [PubMed] [Google Scholar]
- 42.Kakuda W, Lansberg MG, Thijs VN, Kemp SM, Bammer R, Wechsler LR, et al. Optimal definition for PWI/DWI mismatch in acute ischemic stroke patients. J Cereb Blood Flow Metab. 2008;28(5):s887–s891. doi: 10.1038/sj.jcbfm.9600604. [DOI] [PMC free article] [PubMed] [Google Scholar]
- 43.Lesley M, Foley T, Hitchens K, Barbe B, Horner J, Ho C, Nemoto E. Brain tissue ischemic transitions during permanent middle cerebral artery occlusion (pMCAO) in rats. ISMRM 16th Conference; 5–9 May, 2008; Toronto, Canada. [Abstract #3297] [Google Scholar]
- 44.Garcia JH, Liu K-F, Ye Z-R, Gutierrez JA. Incomplete infarct and delayed neuronal death after transient middle cerebral artery occlusion in animals. Stroke. 1997;28:2303–2310. doi: 10.1161/01.str.28.11.2303. [DOI] [PubMed] [Google Scholar]


