

Abstract
We have made a high-resolution HAPPY map of chromosome 6 of Dictyostelium discoideum consisting of 300 sequence-tagged sites with an average spacing of 14 kb along the ∼4-Mb chromosome. The majority of the marker sequences were derived from randomly chosen clones from four different chromosome 6–enriched plasmid libraries or from subclones of YACs previously mapped to chromosome 6. The map appears to span the entire chromosome, although marker density is greater in some regions than in others and is lowest within the telomeric region. Our map largely supports previous gene-based maps of this chromosome but reveals a number of errors in the physical map. In addition, we find that a high proportion of the plasmid sequences derived from gel-enriched chromosome 6 (and that form the basis of a chromosome-specific sequencing project) originates from other chromosomes.
[The sequence data described in this paper have been submitted to the GenBank data library under accession nos. G64996–G65046.]
The social amoeba Dictyostelium discoideum normally exists as free-living cells in the soil but under certain conditions forms multicellular aggregates culminating in the formation of a spore-bearing fruiting body with differentiated cells. This behavior, coupled with its ease of culture and manipulation in vitro, make it a favored organism for the study of cellular motility, differentiation, and intercellular signaling (Maeda et al. 1997; Kay and Williams 1999); its status as a model organism has recently been acknowledged by the NIH (www.nih.gov/science/models/).
The genome of D. discoideum comprises six chromosomes, with a total size of ∼34 Mbp (Cox et al 1990; Loomis and Kuspa 1997). Because of inefficient sexual reproduction in this organism there are no high-resolution genetic maps based on meiotic recombination. However, it is possible to select for heterozygous diploid strains that can be induced to generate haploid progeny in which chromosomes assort randomly (Loomis 1969; Katz and Sussman 1972; Kessin et al. 1974). This has been exploited to chromosomally assign loci (Welker and Williams 1982; Loomis 1987). In addition, maps based on restriction enzyme–mediated integration (REMI–RFLP) assigned >200 genes to specific Dictyostelium chromosomes (Loomis et al. 1995) and facilitated the ordering of YAC contigs covering >98% of the genome (Kuspa and Loomis 1996).
Efforts are under way in several laboratories to determine the complete DNA sequence of the genome of the well-characterized strain AX4, including both genome-wide shotgun sequencing and, for most of the chromosomes, chromosome-specific shotgun approaches (e.g., see http://genome.imb-jena.de/dictyostelium, http://www.sanger.ac.uk/Projects/D_discoideum, and http://dictygenome.bcm.tmc.edu). The latter largely rely on plasmid libraries made from chromosomes partially purified by pulsed-field gel electrophoresis. The YAC contigs of the genome are expected to serve both as a guide to sequence assembly and as a potential source of region-specific DNA to aid gap closure.
The high A-T content of the Dictyostelium genome (∼77% overall; Firtel and Bonner 1972), coupled with the presence of numerous highly conserved repetitive elements (Loomis and Kuspa 1997), is expected to pose challenges for sequence assembly. In addition, it is unclear whether the YAC contigs will be of sufficient accuracy to resolve these problems. Therefore, we set out to make a high-density map of sequence-tagged sites (STSs) covering chromosome 6, the smallest of the chromosomes at ∼4 Mb and that for which sequencing was first initiated.
The technique we used is HAPPY mapping (Dear and Cook 1993; Dear 1997; Dear et al. 1998; Piper et al. 1998). Briefly, this in vitro method relies on examining the STS content of a panel of samples of randomly broken DNA. The samples are prepared by limiting dilution such that markers segregate and that a given marker is only present in about half of the samples. The more closely linked any two STSs are, the more often they will remain linked after random DNA breakage, and hence, the more often they cosegregate among the panel of samples. In this respect, HAPPY mapping is analogous to radiation-hybrid mapping (Stewart and Cox 1997) but, being an entirely in vitro process, is simpler and is not prone to the artifacts associated with radiation hybrid formation, growth, and analysis.
RESULTS
We used two mapping panels to complete the map. The panels differ in the sizes of the genomic fragments they contain, which in turn determines both the resolution of the map and the maximum distance over which linkage between consecutive markers can be detected. The first, short-range panel contained DNA fragments with a mean size of <100 kb produced by shearing, allowing us to detect linkage between markers up to ∼50 kb apart and affording high resolution. The second, long-range panel contained fragments of ∼150 kb produced by irradiation and size-selection using pulsed-field electrophoresis; it allowed us to detect linkage over distances up to ∼100 kb but with poorer resolution. All markers were initially typed on the short-range panel to obtain maximum resolution; a subset of markers were then retyped on the long-range panel to close the remaining gaps between widely spaced markers.
Short-Range Mapping
Despite prescreening of marker sequences against known repeat elements in the Dictyostelium genome, a proportion of markers were found to be multicopy, either during initial testing of the markers (see Methods) or by virtue of giving anomalously high numbers of positives when typed on the short-range panel. These markers were rejected from analysis, as were those that failed to type successfully for other reasons.
A total of 564 non-multicopy markers were typed successfully on the short-range panel, which was found to have a DNA content of 0.87 genomes per aliquot. Two-point lod scores were calculated between all markers, and the markers were sorted into linkage groups at a lod threshold of 5.3 (Dear 1997).
On the basis of the short-range data, markers fell into 65 linkage groups of two or more, with a further 89 markers being unlinked to any other (singletons). The largest of these groups contained 90 markers covering ∼1 Mb. For all groups of three or more markers, best order and distance were determined using DGmap (Newell et al. 1995). A further 66 markers typed poorly (e.g., weak PCR products); these second-rate markers were set aside and excluded from initial map construction.
Long-Range Mapping
A subset of 294 markers were typed on the long-range panel, which was found to have a DNA content of 0.71 genomes per aliquot. These markers included the majority of the singletons as well as markers lying at or close to each end of each of the short-range linkage groups. In addition, some markers lying at intervals along the larger short-range groups were included.
Two-point lod scores between these markers were determined, the markers sorted into linkage groups at a lod threshold of 4.9, and the best order and distance determined for each of these long-range linkage groups of >2 markers. These long-range groups were used to bridge the gaps between many of the larger short-range linkage groups. However, many of the smaller short-range groups and most of the singleton markers remained unconnected by the long-range data. We suspected that most of these unconnected markers (orphans) originated from chromosomes other than chromosome 6.
Confirmation of Chromosomal Origin by Southern Blotting
For many of the orphan short-range groups that remained unconnected after long-range mapping, as well as for some of those that were connected, we used Southern blotting to the electrophoretic karyotype of Dictyostelium to determine the chromosomal origin of one or more markers in each group (results not shown). One of the orphan groups was shown in this way to lie on chromosome 6; it was connected to the main body of the map by a long-range lod score of 3.2. All of the other orphans that were tested proved to be non–chromosome 6, had negligible lod scores to the main map, and were discarded from further analysis. Several of these orphan groups consisted entirely or predominantly of markers derived from subclones of particular YACs. All tested markers from groups in the main map hybridized to chromosome 6. The pulsed-field gels from which the karyotype was taken were run under conditions chosen to optimally resolve chromosome 6; the larger chromosomes are poorly resolved. Hence, most of the orphan groups cannot be assigned to specific chromosomes.
Map Assembly and Scaling: Addition of Second-Rate Markers
A contiguous map was assembled, consisting of eight short-range linkage groups connected and ordered by long-range lods of >4.9 (or, for the one orphan group confirmed by Southern blotting to be on chromosome 6, at a slightly lower long-range lod). In some cases where markers were linked by both short- and long-range data (e.g., where several markers from one short-range group had been retyped on the long-range panel), there were local discrepancies in the marker order as determined by the two panels. These discrepancies were generally over very small distances (below the resolution of the long-range panel), and hence, the order determined by the short-range data was used.
Distances on the map are initially defined in arbitrary units that differ between the long- and short-range panels. To unify the distance scales between short-range groups with those within them, two approaches were used. Where the short-range lod score between adjacent groups was between 2 and 5.3, the distance was based solely on the short-range data (i.e., the long-range data were used only to confirm the linkage). Where the short-range lod score was <2, the distance was based on the long-range data rescaled to be consistent with the short-range distance estimates. Finally, all distances were rescaled linearly to bring the total map length to 4 Mb, the estimated size of chromosome 6 (Fig. 1).
Figure 1.
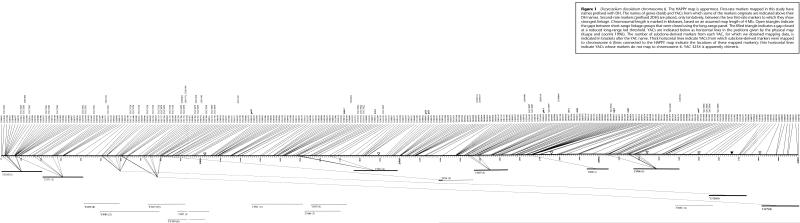
Dictyostelium discoideum chromosome 6. The HAPPY map is uppermost. First-rate markers mapped in this study have names prefixed with DH. The names of genes (bold) and YACs from which some of the markers originate are indicated above their DH names. Second-rate markers (prefixed 2DH) are placed, only tentatively, between the two first-rate markers to which they show strongest linkage. Chromosomal length is marked in kilobases, based on an assumed map length of 4 Mb. Open triangles indicate the gaps between short-range linkage groups that were closed using the long-range panel. The filled triangle indicates a gap closed at a reduced long-range lod threshold. YACs are indicated below as horizontal lines in the positions given by the physical map (Kuspa and Loomis 1996). The number of subclone-derived markers from each YAC, for which we obtained mapping data, is indicated in brackets after the YAC name. Thick horizontal lines indicate YACs from which subclone-derived markers were mapped to chromosome 6 (lines connected to the HAPPY map indicate the locations of these mapped markers); thin horizontal lines indicate YACs whose markers do not map to chromosome 6. YAC 3234 is apparently chimeric.
Second-rate markers (excluded from initial analysis because of poor short-range typing) were tentatively assigned to intervals on the map, in each case being placed between the two first-rate markers to which they showed highest linkage.
Analysis of Marker Origins
With the map complete, we were able to determine the chromosome 6 enrichment of the various libraries from which the markers originated. In so doing, we assume that all markers that typed successfully, but that failed to link to the map of chromosome 6, are from other chromosomes. This had been verified by Southern blotting for many of the markers in orphan groups but not for the majority of the singleton markers. Nevertheless, absence of any significant linkage between a marker and any of the others on the dense map is a good indication that it does not lie on chromosome 6. These results, as well as the number of markers that failed to type successfully, are summarized in Table 1.
Table 1.
Success Rate and Chromosomal Specificity of Markers
| Source | Markers | Failed | 1st rate | 2nd rate | Chr6 | Spec(%) |
|---|---|---|---|---|---|---|
| MRC-L0 (RsaI) | 93 | 57 | 31 | 5 | 29 | 93.55 |
| MRC-L1 (SspI) | 36 | 11 | 23 | 2 | 19 | 82.61 |
| SB1 | 472 | 240 | 208 | 24 | 97 | 46.63 |
| SB 1+2 | 385 | 206 | 162 | 17 | 88 | 54.32 |
| YAC | 323 | 183 | 122 | 18 | 41 | 33.61 |
| Gene | 26 | 8 | 18 | 0 | 11 | 61.11 |
| Totals | 1335 | 705 | 564 | 66 | 285 | 50.53 |
Source refers to the source of sequences from which markers were designed (MRC-L0 and MRC-L1, chromosome 6-enriched plasmid libraries made and sequenced in this study; SB1, early chromosome 6-enriched plasmid library prepared at the Sanger Centre using purified chromosome 6 DNA supplied by Princeton University; SB1 +2, a mixture of sequences from SB1 and from a later library, again prepared at the Sanger Centre; sequences from SB1 and SB1 +2 were produced by the Sanger Centre and by Baylor. YAC, sub-clones of YACs from the chromosome 6 physical map, sub-cloned and sequenced at the Sanger Centre; Gene, gene sequences). Markers gives the number of markers for which PCR primers were made; Failed markers include those rejected after initial testing, or which failed to give useable mapping data; in most cases, this was because the marker sequence proved to be multicopy. 1st rate and 2nd rate are those which typed either well or poorly on the mapping panels. Chr6 and Spec(%) give the number and percentage, respectively, of 1st-rate markers which mapped to chromosome 6.
DISCUSSION
In this paper we describe a high-density HAPPY map of D. discoideum chromosome 6. The average density of one marker per 14 kb both will allow this map to be used in further mapping studies including contig assembly and, we hope, will help to guide the long-range assembly of sequence data for this chromosome. However, the marker density varies considerably along the chromosome, and the utility of the map will therefore be higher in some regions than in others. The widest gap between markers is ∼90 kb.
On the basis of our previous experience (Dear and Cook 1993; Walter et al. 1993; Piper et al. 1998), the short-range panel from which most of the map was constructed should have a resolution of ∼10–15 kb; local errors in the order of more closely spaced markers should, therefore, be expected. In addition, the errors in any linkage-based method (including genetic and radiation-hybrid mapping) are greatest at the ends of linkage groups. Therefore, markers lying close to the ends of the short-range linkage groups (Fig. 1) should be regarded as more error prone than others. This is particularly true of the telomeric end of the chromosome, which is composed of several small short-range groups, including the gap that was closed only by the long-range panel at reduced lod thresholds (the relevant groups having been confirmed by Southern blotting to lie on chromosome 6). The 15 second-rate markers are included for completeness, but the accuracy of their placement cannot be guaranteed.
We have assumed that our map covers the entire chromosome and have scaled the distances accordingly. This cannot be rigorously proven, but it is based on the assumption that markers are scattered approximately at random (in which case the terminal ones should be no more than a few tens of kilobases from the ends). In addition, such scaling appears compatible with the previously established locations of genes on the chromosome and gives the best overall fit with the physical map.
In the course of this project, several disagreements with the already existing maps of the chromosome arose. Although many of our markers were derived from previously mapped genes and ordered YAC clones, the prior information about their positions was not taken into consideration in the map assembly, the entire map being built using HAPPY mapping data only. This approach prevents automatic incorporation of possible errors passed over from other maps.
Our markers included subclone sequences from 18 of the YACs that make up the physical map of this chromosome (Kuspa and Loomis 1996). Markers from over half of the selected YAC clones did not map to chromosome 6 in our hands, and their placement on other chromosomes was confirmed by Southern blotting. Other YACs map to positions different from those predicted by the physical map. It is conceivable that some of these misplaced YACs are chimeric and that they also contain sequences (unmapped by us) that do lie in the positions predicted from the physical map. Indeed, at least one YAC (Y3234) was shown to be chimeric, with only one of several markers derived from it mapping to chromosome 6. By the same token, of course, some of the YACs that we map in concordance with the physical map may also be chimeric, containing additional sequences originating from elsewhere in the genome.
With regard to gene-derived markers, our map largely agrees with others regarding the chromosomal assignment, order, and approximate spacing of nine genes that had been physically mapped (Loomis et al. 1995; Kuspa and Loomis 1996). Exceptions are the close pair of genes helA (DH0016) and trxA (DH0017), which we find in the reverse order. However, six markers derived from genes previously assigned to chromosome 6 do not fall on our map. tubA (DH0013) and cinC (DH0096) fall into an orphan linkage group with markers derived from YAC 3961, which Southern blotting confirmed to be non–chromosome 6. We map vsgB (DH0019), suggested to lie on chromosome 6 by Kuspa and Loomis (1996), to an orphan group with tipA (DH0020) and DH0745. It is conceivable that this orphan group lies beyond the telomeric end of our map, where we achieved poor coverage, but it is also likely that neither of these genes lies on chromosome 6. Indeed, other chromosome locations have been suggested for each of these genes (Loomis et al. 1995; Kuspa and Loomis 1996). dhkA (DH0006) falls in an orphan group with markers from YACs 3470 and 3081, which Southern blotting confirmed to be non–chromosome 6. cdcE (DH0009) is in an orphan group of two markers whose chromosomal location was not verified by Southern blotting. It is, therefore, possible that its failure to map is due to mistyping or to its lying beyond the ends of our map. The iplA gene had not been mapped previously.
Many of the markers derived from chromosome-enriched plasmid libraries failed to map to chromosome 6 (Table 1). As not all of these were tested by Southern blotting, it is possible that some of them may be mistyped or lie beyond the supposed ends of our map. The majority, however, almost certainly lie on other chromosomes. When isolating chromosome 6 for the preparation of libraries MRC-L0 and MRC-L1, we optimized conditions to resolve this chromosome preferentially, whereas larger chromosomes were poorly resolved. This may account for the greater specificity of our libraries as compared with the Sanger/Baylor libraries: The pulsed-field gels used in these latter cases were run under conditions chosen to resolve a wider range of Dictyostelium chromosomes and, hence, may have resolved chromosome 6 less well. Of the 279 non–chromosome 6 first-rate markers (from all sources), 197 fall into linkage groups of two or more, covering an estimated 2.6 Mb of the genome. There are several highly repetitive elements in the Dictyostelium genome (Loomis and Kuspa 1997) that have already been sequenced and documented. We screened each candidate marker sequence against these and also, in most cases, against chromosome 6 sequences accumulating in the database (genome.imb-jena.de/dictyostelium), discarding all of those that found more than two significant homologies (and were hence more likely to represent repeated sequences). This database expanded during the course of the mapping project, and our screening procedures improved such that a higher proportion of likely multicopy sequences were filtered out as the work progressed. Nevertheless, many of our markers proved to be multicopy either in the initial testing or when they were typed on the mapping panels; this accounted for the majority of the markers listed in Table 1 as failed. Some of these may represent families of hitherto unidentified elements. With the advance of the sequencing projects and the resulting abundance of sequencing data, a prescreening procedure should become much more efficient in identifying multicopy sequences so that they can be excluded from mapping. Of the apparently single-copy markers that we mapped, approximately half proved to lie on other chromosomes, representing a considerable wastage (in the context of chromosome-specific mapping) that would be eliminated if genome-wide mapping of this organism were undertaken. The mapping data and details of the markers are available at www.mrc-lmb.cam.ac.uk/happy/DICTY/dictyMap.html.
METHODS
Strains and DNA Preparation
The strain used as a DNA source was AX4 (Knecht et al. 1986), grown axenically and starved overnight. DNA was prepared according to the procedure of Cox et al. (1990), with the modification that agarose strings were used instead of plugs. In brief, cells were suspended at density of 4 × 10⁸ cells/mL in KK2 buffer (16.6 mM KH2PO4, 3.8 mM K2HPO4 at pH 6.2). Equal volumes of the cell suspension and 2% LMP agarose in KK2 buffer were mixed at 39°C, transferred into glass capillary tubes (1 mm internal diameter; Brand), and left to set (4°C, 5min). Agarose strings were expelled from the capillaries into lysis mix (0.5M EDTA pH9.5, 1% Na Sarcosyl, 1 mg/mL Proteinase K) and incubated at 50°C for 24 h, the lysis mix being replaced with fresh solution after the first 6 h. Strings were then transferred into 0.5 M EDTA and stored at 4°C. In addition, strings containing 105 cells/mL were prepared in the same way.
Mapping Panels and Pre-amplification
Two mapping panels were made, differing in the mean size of their DNA fragments and, hence, in their resolution and range (Dear 1997). The short-range panel was made by melting 17 mm of agarose string made with 105 cells/mL in 5 mL of 10 mM TrisHCl (pH 8.3) and 50 mM KCl at 65°C for 10 min, mixing by inversion, and adding 5 mL of TE (10 mM TrisHCl at pH 7.4, 1 mM EDTA). This procedure is known to shear DNA to a size range of ∼50–100 kb (Dear and Cook 1993; Walter et al. 1993). Diluted DNA was then dispensed into 96 wells of a microtitre plate (2 μL/well).
The long-range panel was made from size-selected fragments produced by irradiation (Dear et al. 1998). Agarose strings prepared from 105 cells/mL were γ irradiated with a dose of 320 J/kg to randomly break the DNA. Two such strings were stacked in a single 9-cm-wide well of a pulsed-field gel (1% LMP agarose in 0.5× TBE) and resolved in a CHEF DRIII system (BioRad; 50–90 sec ramped pulse, 12°C, 120° switch angle, 6 V/cm, 26 h). Size standards (S. cerevisiae chromosomal DNA) were included in lanes on the extreme left and right of the gel. The central part of the gel was removed and equilibrated in TE. The parts of the gel containing the size standards were stained with ethidium bromide, visualized by UV light, and used as guides to indicate the part of the unstained gel containing Dictyostelium fragments of ∼150 kb. A glass capillary tube (internal diameter 0.56 mm; Drummond Scientific) was used to punch out cylindrical plugs from the gel in this region, each plug containing ∼0.5–1 genome equivalents (∼2 × 10⁻¹⁴ g) of Dictyostelium fragments. One such plug was transferred to each well of a microtitre plate.
Pre-amplification of both panels was carried out using PEP (primer extension pre-amplification), essentially as described by Zhang et al. (1992). Reagents were added to the liquid DNA samples or to the agarose plugs to give 5 μL reactions containing 10 mM Tris (pH8.3), 50 mM KCl, 2.5 mM MgCl2, 200 μM each dNTP, 10 μM primer, 1 U AmpliTaq DNA polymerase (Perkin Elmer) and 1.5 pg human genomic DNA as a carrier. These reactions were cycled with an initial step of 5 min at 93°C followed by 50 cycles of 94°C for 30 sec, 37°C for 2 min, 37°–55°C ramp over 3 min, and 55°C for 4 min. PEP products were diluted to 200 μL each and stored at −80°C until used as templates for marker typing.
Marker Sequences and Primer Design
Twenty-two sequences, representing known Dictyostelium genes previously assigned to chromosome 6, were retrieved from GenBank. Four further markers were derived from the sequence of iplA, kindly provided by R. Kay and D. Traynor (MRC Laboratory of Molecular Biology). A total of 1082 sequences from chromosome 6–enriched plasmid libraries were retrieved from the Sanger Centre (www.sanger.ac.uk/Projects/D_discoideum) and from Baylor College of Medicine (dictygenome.bcm.tmc.edu). In addition, 524 plasmid subclone sequences from several YAC clones derived from the chromosome 6 YAC contig (Kuspa and Loomis 1996) and sequenced in the Sanger Centre were also used.
We also made two plasmid libraries from our own pulsed-field gel-purified chromosome 6. Briefly, four agarose strings made with 2 × 10⁸ cells/mL (a total of ∼108 cells' worth of DNA) were stacked in a single 9-cm-wide well of a pulsed field gel (0.8% LMP agarose in TAE), and the smaller chromosomes were resolved (3000-sec pulse, 1.8 V/cm, 120° field angle, 12°C, 120 h; the sample well and agarose strings were removed from the gel halfway through the run). The gel was stained with ethidium bromide and examined briefly under UV illumination and the band containing chromosome 6 was excised. DNA was recovered from the gel slice by digestion with β-Agarase 1 (New England Biolabs), phenol extraction, and ethanol precipitation following standard procedures and then digested to completion with either RsaI (library MRC-L0) or SspI (library MRC-L1). Then, using a PCR-Script Amp SK+ cloning kit (Stratagene), 500 ng of digested DNA was cloned. Recombinant colonies were isolated, insert sizes checked by PCR with M13 forward and reverse primers, plasmid DNA purified, and sequences of the inserts obtained using standard procedures. These two libraries yielded a total of 337 sequences.
All candidate marker sequences were checked for known repetitive elements, and in most cases, for homology with >2 sequences in the Dictyostelium database (genome.imb-jena.de/dictyostelium); such repetitive or possibly repetitive sequences were excluded, as were those of <100bp.
We used nested PCR for marker typing; nested primers were designed to operate at uniform PCR conditions with calculated melting temperatures of between 55° and 60°C. An automated primer design program (NOSP; P.H. Dear, unpubl.) was used; those sequences for which suitable primers could not be designed were discarded. It should be noted that this program is less likely to find suitable primers in highly A-T or G-C rich sequences; such sequences may therefore be underrepresented among those for which mapping was attempted.
Marker Typing
Markers were typed in blocks of 50–120 markers in a two-phase nested PCR protocol, multiplexing the external primer pairs in the first phase. First-phase reactions (10 μL) consisted of 5 μL of the preamplified and diluted template, 0.25 μM of each external primer, 1× AmpliTaq Gold reaction buffer, 1 U AmpliTaq Gold polymerase (Perkin Elmer), 4 mM MgCl2 and 200 μM each dNTP. Cycling conditions were 10 min at 93°C followed by 28 cycles of 94°C for 20 sec, 50°C for 45 sec, and 72°C for 45 sec. These complex PCR products were diluted to 1 mL each and 5 μL was used as template for the second-phase amplification, where specific PCR products were obtained by using single internal primer pairs for each marker. Second-phase reactions (10 μl) consisted of 1× AmpliTaq Gold reaction buffer, 0.25 U AmpliTaq Gold polymerase (Perkin Elmer), 200 μM each dNTP, 1.5 mM MgCl2, and 1 μM each internal primer. After an initial hot start step of 10 min at 93°C, the samples were cycled 38 times at 94°C for 20 sec, 50°C for 45 sec, and 72°C for 45 sec. PCR products were supplemented with an equal volume of SyBr loading dyes (15% w/v Ficoll 400, 0.15 mg/mL bromophenol blue, 4× SyBr Green I, 1 × TBE) and run on 6% polyacrylamide/0.5× TBE 96-well MIRAGE gels (GeneScreen Limited).
Before typing, most markers were tested using a simplified version of the typing protocol on a smaller version of the mapping panel. This identified many markers that either failed to amplify or that clearly represented multicopy sequences.
Analysis
Two-point lod scores and θ values were calculated, and markers were sorted into linkage groups at a chosen lod threshold as described previously (Dear 1997; Piper et al. 1998; Dear et al. 1998). The optimal order and spacing of markers for each linkage group was determined using DGmap (Newell et al. 1995).
Southern Hybridization
Electrophoretic karyotypes for blots were prepared by stacking 10 strings prepared with 2 × 10⁸ cells/mL in a single 9-cm well of a 0.8% agarose/1× TAE gel and resolving the smaller chromosomes using a CHEF DRIII gel system (BioRad). A three-block protocol was used: 1200 sec pulse, 12h, 96° field angle; 1500 sec, 12h, 100° field angle; 1800 sec, 96 h, 106° field angle; all blocks 2 V/cm, 10°C. After staining with ethidium and photography, DNA was transferred to nylon membranes following standard protocols.
For each hybridization, the probe consisted of one or more PCR products corresponding to marker(s) in the linkage group to be chromosomally assigned. PCR products were made using essentially the same protocol as for second-phase PCRs (see Marker Typing) but with Dictyostelium genomic DNA as template in place of first-phase PCR products. PCR products were checked by gel electrophoresis and labeled with α-32P dCTP (oligo labeling kit; Pharmacia) then hybridized to the blot in 1 M NaCl, 10% PEG8000, 1% SDS at 65°C for 18–20 h, followed by three 15 min washes at 65°C in 2 × SSC, 1% SDS. Autoradiography followed standard procedures.
Acknowledgments
This project was funded by the United Kingdom Medical Research Council with additional funding from the European Union Dictyostelium Consortium (BIO4–98–0103). We thank R. Kay for providing us with Dictyostelium cells, A. Kuspa and W. Loomis for YAC clones and related data, and the Dictyostelium sequencing group at the Sanger Centre for supplying us with plasmid DNA clones and sequencing data.
The publication costs of this article were defrayed in part by payment of page charges. This article must therefore be hereby marked “advertisement” in accordance with 18 USC section 1734 solely to indicate this fact.
Footnotes
E-MAIL bak@mrc-lmb.cam.ac.uk; FAX 44-1223-412178.
Article and publication are at www.genome.org/cgi/doi/10.1101/gr.141700.
REFERENCES
- Cox EC, Vocke CD, Walter S, Gregg KY, Bain ES. Electrophoretic karyotype for Dictyostelium discoideum. Proc Natl Acad Sci. 1990;87:8247–8251. doi: 10.1073/pnas.87.21.8247. [DOI] [PMC free article] [PubMed] [Google Scholar]
- Dear PH. HAPPY mapping. In: Dear PH, editor. Genome mapping: A practical approach. Oxford: IRL; 1997. pp. 95–124. [Google Scholar]
- Dear PH, Cook PR. HAPPY mapping: Linkage mapping using a physical analogue of meiosis. Nucleic Acids Res. 1993;21:13–20. doi: 10.1093/nar/21.1.13. [DOI] [PMC free article] [PubMed] [Google Scholar]
- Dear PH, Bankier AT, Piper MB. A high-resolution metric HAPPY map of human chromosome 14. Genomics. 1998;48:232–241. doi: 10.1006/geno.1997.5140. [DOI] [PubMed] [Google Scholar]
- Firtel RA, Bonner J. Characterization of the genome of the cellular slime mold Dictyostelium discoideum. J Mol Biol. 1972;66:339–361. doi: 10.1016/0022-2836(72)90419-6. [DOI] [PubMed] [Google Scholar]
- Katz ER, Sussman M. Parasexual recombination in Dictyostelium discoideum: Selection of stable diploid heterozygotes and stable haploid segregants. Proc Natl Acad Sci. 1972;69:495–498. doi: 10.1073/pnas.69.2.495. [DOI] [PMC free article] [PubMed] [Google Scholar]
- Kay RR, Williams JG. The Dictyostelium genome project: An invitation to species hopping. Trends Genet. 1999;15:294–297. doi: 10.1016/s0168-9525(99)01770-9. [DOI] [PubMed] [Google Scholar]
- Kessin RH, Williams KL, Newell PC. Linkage analysis in Dictyostelium discoideum using temperature-sensitive growth mutants selected with bromodeoxyuridine. J Bacteriol. 1974;119:776–783. doi: 10.1128/jb.119.3.776-783.1974. [DOI] [PMC free article] [PubMed] [Google Scholar]
- Knecht DA, Cohen SM, Loomis WF, Lodish HF. Developmental regulation of Dictyostelium discoideum actin gene fusions carried on low-copy and high-copy transformation vectors. Mol Cell Biol. 1986;6:3973–3983. doi: 10.1128/mcb.6.11.3973. [DOI] [PMC free article] [PubMed] [Google Scholar]
- Kuspa A, Loomis WF. Ordered yeast artificial chromosome clones representing the Dictyostelium discoideum genome. Proc Natl Acad Sci. 1996;93:5562–5566. doi: 10.1073/pnas.93.11.5562. [DOI] [PMC free article] [PubMed] [Google Scholar]
- Loomis WF. Temperature-sensitive mutants of Dictyostelium discoideum. J Bacteriol. 1969;99:65–69. doi: 10.1128/jb.99.1.65-69.1969. [DOI] [PMC free article] [PubMed] [Google Scholar]
- Loomis WF. Genetic tools for Dictyostelium discoideum. In: Spudich JA, editor. Methods in cell biology. Orlando, FL: Academic Press; 1987. pp. 31–65. [DOI] [PubMed] [Google Scholar]
- Loomis WF, Kuspa A. The genome of Dictyostelium discoideum. In: Maeda Y, Inouye K, Takeuchi I, editors. Dictyostelium—A model system for cell and developmental biology. Tokyo: Universal Academy Press; 1997. pp. 15–30. [Google Scholar]
- Loomis WF, Welker D, Hughes J, Maghakian D, Kuspa A. Integrated maps of the chromosomes in Dictyostelium discoideum. Genetics. 1995;141:147–157. doi: 10.1093/genetics/141.1.147. [DOI] [PMC free article] [PubMed] [Google Scholar]
- Maeda Y, Inouye K, Takeuchi I, editors. Dictyostelium—A model system for cell and developmental biology. Tokyo: Universal Academic Press; 1997. [Google Scholar]
- Newell WR, Mott R, Beck S, Lehrach H. Construction of genetic maps using distance geometry. Genomics. 1995;30:59–70. doi: 10.1006/geno.1995.0009. [DOI] [PubMed] [Google Scholar]
- Piper MB, Bankier AT, Dear PH. HAPPY map of Cryptosporidium parvum. Genome Res. 1998;8:1299–1307. doi: 10.1101/gr.8.12.1299. [DOI] [PMC free article] [PubMed] [Google Scholar]
- Stewart EA, Cox DR. Radiation hybrid mapping. In: Dear PH, editor. Genome mapping: A practical approach. Oxford: IRL; 1997. pp. 73–93. [Google Scholar]
- Walter G, Tomlinson IM, Cook GP, Winter G, Rabbitts TH, Dear PH. HAPPY mapping of a YAC reveals alternative haplotypes in the human immunoglobulin Vh locus. Nucleic Acids Res. 1993;21:4524–4529. doi: 10.1093/nar/21.19.4524. [DOI] [PMC free article] [PubMed] [Google Scholar]
- Welker DL, Williams KL. A genetic map of Dictyostelium discoideum based on mitotic recombination. Genetics. 1982;102:691–710. doi: 10.1093/genetics/102.4.691. [DOI] [PMC free article] [PubMed] [Google Scholar]
- Zhang L, Cui X, Schmidt K, Hubert R, Navidi W, Arnheim N. Whole genome amplification from a single cell: Implications for genetic analysis. Proc Natl Acad Sci. 1992;89:5487–5851. doi: 10.1073/pnas.89.13.5847. [DOI] [PMC free article] [PubMed] [Google Scholar]