Abstract
Introduction:
Understanding the relationships between performance tests and sport activity is important to the rehabilitation specialist. The purpose of this study was two- fold: 1) To identify if relationships exist between tests of upper body strength and power (Single Arm Seated Shot Put, Timed Push-Up, Timed Modified Pull-Up, and The Davies Closed Kinetic Chain Upper Extremity Stability Test, and the softball throw for distance), 2) To determine which variable or group of variables best predicts the performance of a sport specific task (the softball throw for distance).
Methods:
One hundred eighty subjects (111 females and 69 males, aged 18-45 years) performed the 5 upper extremity tests. The Pearson product moment correlation and a stepwise regression were used to determine whether relationships existed between performance on the tests and which upper extremity test result best explained the performance on the softball throw for distance.
Results:
There were significant correlations (r=.33 to r=.70, p=0.001) between performance on all of the tests. The modified pull-up test was the best predictor of the performance on the softball throw for distance (r2= 48.7), explaining 48.7% of variation in performance. When weight, height, and age were added to the regression equation the r2 values increased to 64.5, 66.2, and 67.5 respectively.
Conclusion:
The results of this study indicate that several upper extremity tests demonstrate significant relationships with one another and with the softball throw for distance. The modified pull up test was the best predictor of performance on the softball throw for distance.
Keywords: functional testing, upper body strength, upper body power
INTRODUCTION
Physical therapists and strength and conditioning professionals attempt to develop optimal training programs for overhead throwing athletes to prevent injury, enhance performance, and safely progress a patient through rehabilitation. Determining specific upper extremity (UE) strength and power activities that best relate to throwing, and furthermore predict throwing performance, would provide clinically relevant information to the health care professional.
Several authors document the extreme biomechanical forces that occur at the shoulder and elbow during a pitching motion.1–4 Werner et al4,5 studied the distraction forces present at the glenohumeral joint during an overhead throwing action. The distraction force ranged from 81% to 108% of a subject's body weight for collegiate and professional baseball pitchers.
Throwing injuries are common to sports like baseball and softball. Powell and Barber-Foss6 reported a 19.7% shoulder/arm injury rate for high school baseball players and 16.3% shoulder/arm injuries in high school female softball players in 100 high schools throughout the country during the 1995-1997 seasons. Dick et al7 reported 23.4% and 16% shoulder injury rates in collegiate baseball games and practice respectively from 1988-2004. In Major League Baseball, Conte8 reported an injury rate of 27.8% for the shoulder and that pitching related shoulder injuries accounted for 56.9% of total disabled-list days. These data suggest that preventative strategies and exercise programs may need to be further developed to possibly prevent these types of UE injuries.
Specific exercises can elicit increased muscular activity of targeted muscles for use in rehab and injury prevention. Several authors have used electromyographic (EMG) studies to examine several exercises and determine which ones optimally activate the rotator cuff and scapulothoracic musculature.9,10 Moseley et al9 and Townsend et al10 have described exercises such as the push up with a plus, press up, scaption, shoulder flexion, rowing, prone external rotation, and horizontal abduction, to be effective in eliciting increased EMG activity in the muscles of the shoulder girdle. EMG studies like these have led to the development of rehabilitation protocols for shoulder girdle injuries. A multi-phase rehabilitation regimen has been described for the conservative treatment of shoulder injuries for throwing athletes.11 Stodden et al12 recommended throwers should strengthen shoulder and elbow muscles that resist distraction as well as improve trunk strength and flexibility to maximize throwing velocity and help prevent injury. A clinical test that can predict throwing distance with an overhead throwing motion could be a valuable addition to a screening, training and rehabilitation program for baseball and softball athletes. Measures of muscle performance may detect impairment before a decline in functional performance exists. When assessing the ability of an athlete to return to overhead throwing, following an injury, several non-specific (non-throwing) strength/power tests may assist in determining the level of activity at which an athlete can perform or to which they could be safely returned. Relationships must exist between the outcomes of muscle performance tests and overhead throwing if they are to predict a safe progression back to this functional activity. The objectives of the present study are to determine if relationships exist between upper body tests of strength and power and the softball throw and to study their predictive ability for a softball throw for distance.
METHODS
Participants
One hundred and eighty healthy, recreationally active adults, 111 females and 69 males, between the ages of 18 and 45 years old volunteered to participate in this study. Subjects were tested at one of 3 sites. The Institutional Review Boards of each of the sites approved the study. Informed consent was obtained from each subject prior to testing, and a health history form was completed. No participants were currently involved in competitive throwing related activities and anyone with a history of upper extremity injury or surgery was excluded from participation.
Procedures
After obtaining consent subjects were brought to a climate controlled indoor testing area for completion of all tests with the exception of the softball throw which was performed outdoors in an open field. Subjects wore loose, comfortable clothing which would not restrict physical movements.
Five activities requiring upper body strength and power were performed by all subjects, in random order, including:
Single Arm Seated Shot Put with a 2.72 kg medicine ball, performed by both the right and left upper extremities.
Timed Push-Up for 3 sets of 15 seconds.
Timed Modified Pull-Up for 3 sets of 15 seconds on a modified Smith Press machine or similar apparatus.
The Davies Closed Kinetic Chain Upper Extremity Stability Test for 3 sets of 15 seconds.
The Underkofler Softball Throw for distance using the one-step-throw approach.
All participants watched a short video demonstrating the technique for each of the 5 tests. After watching the video, participants began a five-minute warm-up of self-selected moderate intensity, on a seated Upper Body Ergometer (Biodex Inc. Shirley, NY). This was followed by three minutes of upper body stretching including; a corner stretch for the anterior shoulder girdle, a shoulder horizontal adduction stretch for the posterior shoulder girdle, and a trunk side-bending overhead reach for the trunk and inferior shoulder girdle. Each subject was given a random ordered data sheet to take to each testing station for recording results of the 3 maximal effort bouts for each test. The single arm seated shot put test involved testing each UE, therefore, the order of testing of the dominant and non-dominant UE's was randomized on each of the data sheets.
The Single Arm Seated Shot Put Test
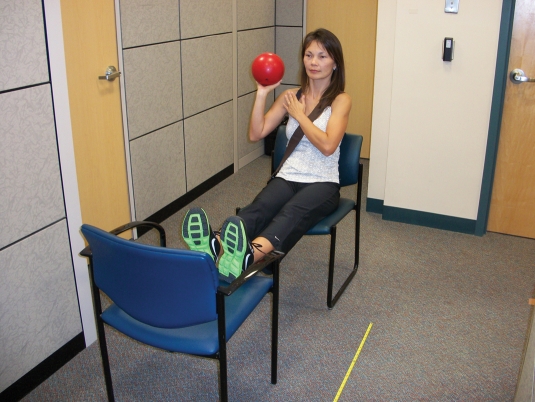
The one arm seated shot put was performed with the subject seated in a standard 45.72 cm chair without armrests, from which the subjects “put” a 2.72 kg medicine ball (Figure 1). The front legs of the chair were placed on a line made by the tester. The subjects were seated in the chair with their feet and lower legs placed on another 45.72 cm chair, positioned just in front of their chair. The non-throwing arm was placed across the chest and a strap placed diagonally around the upper body to secure the subject to the chair. This position minimized the use of the legs and trunk during the seated shot put. Participants were instructed to “put” the medicine ball using an arm motion resembling that used by shot put athletes during this particular track and field event. Specific instruction not to “throw” the medicine ball in an overhead baseball type fashion was given. The initial test arm was selected as documented on the randomized data sheet the participants were given prior to testing. Prior to the recorded puts, four gradient self-selected sub-maximal to maximal warm-ups of 25%, 50%, 75% and 100% effort seated one arm shot puts were performed. The participant then rested for two minutes, followed by 3 maximal effort puts. The recorder measured from the tapeline at the front of the subject's chair to the site where the ball first struck the ground. Two minutes of recovery was given before testing the opposite arm in the same manner described above. The average distance of the 3 maximal effort puts for each arm was used for the data analysis. This test has been previously studied with test-retest reliability of ICC = 0.99 for the dominant arm and ICC = 0.97 for the non-dominant arm.13
Figure 1.
Single Arm Shot Put Test
The Push-up test
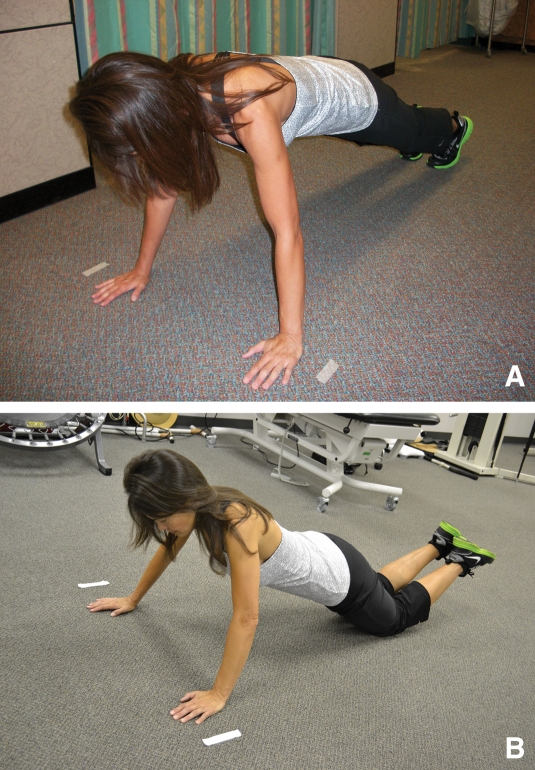
The push-up test was performed in either the standard position for men (on hands and toes) or in the modified position for women in which the subjects assumed the hands and knees position (Figure 2a and 2b). Participants were positioned prone with hands shoulder width apart with the trunk held in a rigid,straight position. Push-ups were performed as quickly as possible. Participants began in the “up” position with their elbows fully extended. When descending the body toward the ground participants flexed their elbows until the upper arm was parallel to the testing surface. The participant was instructed to limit head and trunk motion. A warm-up trial was completed prior to three maximal trials. The maximal effort trials were performed for 15 seconds each followed by 45 seconds of rest. The average number of push-ups completed for the three 15 second bouts was recorded and entered into the data analysis. This test has been previously studied and test-retest reliability of ICC = 0.96 was reported.13
Figure 2.
(A) Standard Push Up (males) and (B) Alternate position for Push Up (females)
The Modified Pull-Up Test
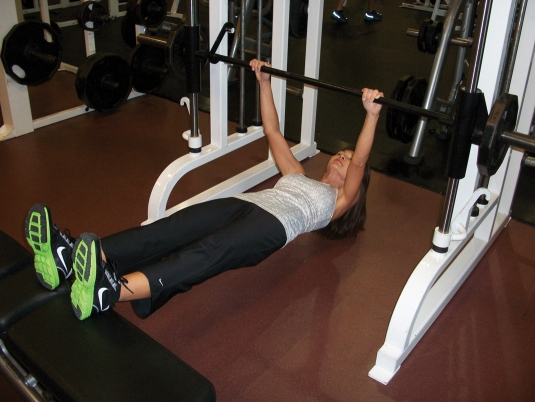
The modified pull-up was performed using a secure adjustable height bar for gripping and pulling, and a bench was used to support the subject's feet or lower legs. Participants assumed a supine position with their heels on a bench, and using an overhand grip to clench the bar. The bar was positioned approximately 7.6 cm out of arms reach when the participant was supine on the floor. Men performed the pull-up with their legs supported at their heels. Women had their lower legs supported just below the knees. When performing the modified pull-up participants started by hanging from the bar with arms fully extended and pulled up high enough so the upper arms were parallel to the floor. The participants then lowered themselves back to the elbows fully extended position (Figure 3). The participants were instructed to continuously keep a straight trunk posture and to limit trunk and head motion. A warm-up trial was completed prior to the 3 maximal effort trials. Each participant completed as many pull-ups as possible in 15 seconds during the 3 maximal trials. A 45 second rest period was given between each maximal test bout. The average number of modified pull-ups completed for the 3 maximal effort 15 second bouts was recorded and used for data analysis. This test has been previously studied and a test-retest reliability of ICC = 0.99 was reported.13
Figure 3.
Modified Pull Up
Davies Closed Kinetic Chain Upper Extremity Stability Test
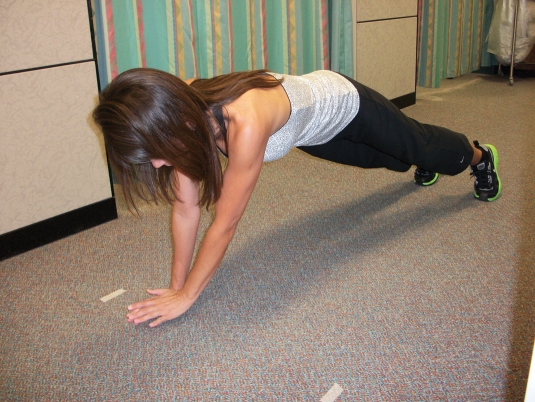
For the Davies Closed Kinetic Chain (CKC) Upper Extremity Stability Test the experimenter placed two parallel strips of tape on the floor three feet apart (Figure 4). The participant was instructed to assume the push-up position and move their hands alternately back and forth, touching each line as fast as possible. The participant was also instructed to continuously keep a straight trunk posture and to limit trunk and head motion. A warm-up trial was completed prior to three maximal trials. Each trial was performed for 15 seconds followed by 45 seconds of rest. The average number of touches completed for the three maximal effort trials was recorded for data analysis. This test has been previously studied with test-retest reliability of ICC = 0.92 reported.14
Figure 4.
CKC Upper Extremity Stability Test
Underkofler Softball Throw for Distance Test
The Underkofler Softball Throw for Distance Test was performed outside in an open area, allowing the subject to throw a standard league softball (30.5 cm in circumference, weighing 178 grams) as far as possible using their dominant arm. The participant was instructed to stand behind a pre-determined line made by the experimenter, designating the mark for recording the distance of the softball throw, and to use the one-step approach to throwing, without stepping over the line, except in landing. A warm-up trial of three self-selected sub-maximal effort softball throws was completed prior to 3 maximal effort throws. The experimenter recorded the distance of each maximal effort throw by measuring from the line to the site where the ball first struck the ground. The average distance of the 3 maximal effort throws was used for data analysis. This test has been previously studied with test-retest reliability of ICC = 0.95 reported.15
DATA ANALYSIS
All data were entered into SPSS 12.0 for statistical analysis. Descriptive statistics, including age, height (cm), weight (kg) and mean scores for each of the 5 tests were calculated for all subjects. A two-tailed Pearson Correlation analysis was performed to determine if relationships existed between the four tests (single arm seated shot put, timed push up, timed modified pull up, Davies CKC test) and the softball throw. A stepwise multiple regression analysis was used to determine which of the 4-tests could best predict performance on the softball throw for distance. Additionally, the variables of height, weight and age were added into the regression analysis. The level of significance for the statistical tests was set at p=0.05.
RESULTS
All 180 subjects successfully completed the testing procedures. Descriptive variables including both the mean and standard deviations of subject characteristics and the test scores are presented in Table 1. Pearson product correlations between all functional performance variables for participants are shown in Table 2. The modified pull-up test had the strongest correlation with the softball throw for distance (r = 0.70), followed closely by the push up test (r = 0.63). Both the modified pull up and the push up test were statistically significantly correlated (p = .001) with the softball throw.
Table 1.
Descriptive statistics for the entire group n=180
| Variable | Minimum | Maximum | Mean | Std. Deviation |
|---|---|---|---|---|
| Age | 18 | 45 | 24.29 | 5.329 |
| Height (cm) | 144.8 | 200.7 | 171.98 | 10.64 |
| Weight (kg) | 45.4 | 120.2 | 70.49 | 14.27 |
| ST score (meters) | 6.8 | 65.7 | 29.4 | 14.3 |
| DCKC score | 4.7 | 38.0 | 20.74 | 5.650 |
| PU score | 4.3 | 25.3 | 15.13 | 4.536 |
| MPU score | 0 | 21.7 | 7.53 | 4.972 |
| SSP dominant score (cm) | 88.9 | 743.5 | 234.95 | 129.82 |
| SSP non-dominant score (cm) | 31.24 | 602.74 | 212.37 | 116.57 |
IST= softball throw, DCKC= Davies closed kinetic chain test, PU= push-up, MPU= modified pull-up, SSP= seated shot put.
Table 2.
Correlational Matrix for entire group n=180
| SOFTBALL THROW SCORE | DAVIES CKC SCORE | PUSH UP SCORE | MODIFIED PULU UP SCORE | SHOT PUT DOMINANT SCORE | SHOT PUT NON-DOMINANT SCORE | ||
|---|---|---|---|---|---|---|---|
| Softball Throw Score | Pearson Correlation | 1 | 0.33 | 0.63 | 0.70 | 0.46 | 0.45 |
| Sig. (2-tailed) | – | .001 | .001 | .001 | .001 | .001 | |
| Davies CKC Score | Pearson Correlation | 0.33 | 1 | 0.54 | 0.59 | 0.63 | 0.66 |
| Sig. (2-tailed) | .001 | .001 | .001 | .001 | .001 | .001 | |
| Push-up Score | Pearson Correlation | 0.63 | 0.54 | 1 | 0.76 | 0.44 | 0.45 |
| Sig. (2-tailed) | .001 | .001 | – | .001 | .001 | .001 | |
| Modified Pull-up Score | Pearson Correlation | 0.70 | 0.59 | 0.76 | 1 | 0.56 | 0.56 |
| Sig. (2-tailed) | .001 | .001 | .001 | – | .001 | .001 | |
| Shot Put Dominant Score | Pearson Correlation | 0.46 | 0.63 | 0.44 | 0.56 | 1 | 0.98 |
| Sig. (2-tailed) | .001 | .001 | .001 | .001 | – | .001 | |
| Shot Put Non-dominant Score | Pearson Correlation | 0.45 | 0.66 | 0.45 | 0.56 | 0.98 | 1 |
| Sig. (2-tailed) | .001 | .001 | .001 | .001 | .001 | – |
Note: All correlations are significant to the p<.001 level (2-tailed).
The regression analysis (Table 3) indicated the modified pull-up test to be the best predictor of the softball throw for distance (r2 = 48.7); thus 48.7% of variation in subject throwing performance is explained by the results on the modified pull-up test. When a participant's weight was factored into the equation the variance increased to 64.5%, further increased to 66.2% when both weight and height were factored in and increased to 67.5% when weight, height and age were included as factors.
Table 3.
Regression model summary
| Model | r2 |
|---|---|
| Modified Pull-up | .487 |
| Modified Pull-up, Weight | .645 |
| Modified Pull-up, Weight, Height | .662 |
| Modified Pull-up, Weight, Height, Age | .675 |
DISCUSSION
While injuries attributed to throwing are well documented in the literature a paucity of research exists to identify variables that predict or are related to performance on the softball throw for distance test. The results of this investigation suggest that the best predictors of the softball throw for distance are the modified pull-up test as well as weight, height, and age. The modified pull up and push up tests were strongly correlated with throwing distance, and weak correlations were found between the one arm shot put and Davies CKC score and throwing distance. The correlation between the timed modified pull-up and push-up with the softball throw may indicate these strength/power maneuvers may have relevance as assessment tools for the throwing population.
Several authors have performed studies that suggest the beneficial effects of resistive exercise and upper body plyometrics on velocity of throwing in both males and females.16–19 Fleisig et al2 stated that at ball release, significant energy and momentum is transferred to the ball and throwing arm. After ball release, a kinetic chain is used to decelerate the rapidly moving arm with the entire body, allowing proper dissipation of the forces from the arm to the trunk and lower extremities.2 Shoulder and elbow muscles produce large compressive forces to resist joint distraction.2 Shoulder distraction forces of up to 108% of body weight have been associated with subsequent pathologic conditions of the rotator cuff and glenoid labrum.4 Considering these potentially destructive forces to the shoulder joint, it makes sense that decreasing the magnitude of shoulder distraction would reduce the risk of injury to this joint.4 The modified pull up test examined in this study may be a measure of the muscles used to counteract the forces of distraction by enhancing the upper bodies musculature that could be used to compress the shoulder joint and eccentrically decelerate the throwing motion.
The shoulder musculature involved with the modified pull up are considered stabilizers and decelerators, that serve to resist distraction forces about the shoulder girdle during throwing which may explain the correlation with throwing distance identified in this investigation. This is consistent with the findings of Fleisig20, who found the force to decelerate the throwing arm is directly proportional to the ball velocity.
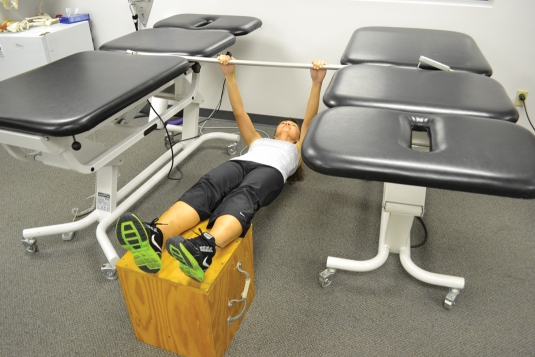
When performing the modified pull up the subject's shoulders were abducted approximately 90 degrees. This position is similar to the 95 degree shoulder abduction position at ball release and the deceleration phase reported by Fleisig.20 The similarity of these positions and the effect on the posterior musculature of the shoulder girdle may help explain the correlation identified in the current study. Clearly, the position of testing and the musculature used during the modified pull up is much different than actual throwing thus the strong correlation is not completely clear. Moreover, the velocity of throwing and the consideration of open kinetic chain being compared to closed kinetic chain activities make a direct link difficult to understand and describe. The dominant arm shot put test theoretically resembles the throwing motion to a greater degree, thus, the authors expected a stronger correlation. Lastly, in regard to equipment, the modified pull up test can be performed in alternate, more practical ways using a metal or wooden dowel placed between 2 training tables as shown in Figure 5.
Figure 5.
Alternate method for Modified pull Up Test
LIMITATIONS AND FUTURE RESEARCH
It should be recognized that the tests described in this study have not been tested against a formal gold standard measure of power or strength. Therefore, it is not possible to truly determine their predictive ability regarding either power or strength. None of the participants in this study were injured thus the results may not be generalized to the symptomatic population. This is a preliminary study, which could lead to further research to determine the potential validity of upper extremity functional tests with regard to injury prevention or decisions regarding return to sport or activity.
CONCLUSION
The modified pull up and push up test may be a beneficial assessment tools for throwing athletes given their correlation to throwing distance. The ability of the modified pull up to predict success with a softball throw for distance suggests its potential role in assessment of throwing athletes. The tests described in this investigation are easy to perform and require minimal space and equipment, thus could be performed in most rehabilitation settings. As part of a comprehensive rehabilitation program these performance tests may aid in determining readiness to return to a throwing sport.
REFERENCES
- 1. Dillman CJ, Fleisig GS, Andrews JR. Biomechanics of pitching with emphasis upon shoulder kinematics. J Orthop Sports Phys Ther. 1993;18:402–08 [DOI] [PubMed] [Google Scholar]
- 2. Fleisig GS, Barrentine SW, Escamilla RF, Andrews JR. Biomechanics of overhead throwing with implications for injuries. Sports Med. 1996;21:421–37 [DOI] [PubMed] [Google Scholar]
- 3. Meister K. Injuries to the shoulder in the throwing athlete. Part one: biomechanics/pathophysiology/classification of injury. Am J Sports Med. 2000;28:265–75 [DOI] [PubMed] [Google Scholar]
- 4. Werner SL, Gill TJ, Murray TA, Cook TD, Hawkins RJ. Relationships between throwing mechanics and shoulder distraction in professional baseball pitchers. Am J Sports Med. 2001;29:354–8 [DOI] [PubMed] [Google Scholar]
- 5. Werner SL, Guido JA, Jr., Stewart GW, McNeice RP, Van Dyke T, Jones DG. Relationship between throwing mechanics and shoulder distraction in collegiate pitchers. J Shoulder and Elbow Surg. 2007; Jan–Feb 16(1): 37–42 [DOI] [PubMed] [Google Scholar]
- 6. Powell JW, Barber-Foss KD. Injury patterns in selected high school sports: a review of the 1995–1997 seasons. J Athl Train. 1999; 34(3): 277–284 [PMC free article] [PubMed] [Google Scholar]
- 7. Dick R, Sauers EL, Agel J, Marshall SW, McCarty K, McFarland E. Descriptive epidemiology of collegiate men's baseball injuries: National Collegiate Surveillance System, 1988–1989 through 2003–2004. J Athl Train. 2007; 42(2): 183–93 [PMC free article] [PubMed] [Google Scholar]
- 8. Conte S, Requa RK, Garrick JG. Disability days in major league baseball. Am J Sports Med. 2001;29:431–436 [DOI] [PubMed] [Google Scholar]
- 9. Moseley JD, Jobe FW, Pink M, Perry J, Tibone J. EMG analysis of the scapular muscles during a shoulder rehabilitation program. Am J of Sports Med. 1992; 20 (2): 125–134 [DOI] [PubMed] [Google Scholar]
- 10. Townsend H, Jobe FW, Pink M, Perry J. EMG analysis of the glenohumeral muscles during a baseball rehabilitation program. Am J Sports Med. 1991; 19 (3): 264–272 [DOI] [PubMed] [Google Scholar]
- 11. Wilk KE, Meister K, Andrews JR. Current concepts in the rehabilitation of the overhead throwing athlete. Am J Sports Med. 2002;30:136–151 [DOI] [PubMed] [Google Scholar]
- 12. Stodden DF, Fleisig GS, McLean SP, Andrews JR. Relationship of biomechanical factors to baseball pitching velocity: within pitcher variation. J Appl Biomech. 2005; 21 (1): 44–56 [DOI] [PubMed] [Google Scholar]
- 13. Negrete RJ, Hanney WJ, Kolber MJ, Davies GJ, Ansley MK, McBride AB, Overstreet AL. Reliability, minimal detectable change and normative values for tests of upper extremity function and power. J Strength Cond Res. 2010; 24 (12): 3318–3325 [DOI] [PubMed] [Google Scholar]
- 14. Goldbeck T, Davies GJ. Test-retest reliability of a closed kinetic chain upper extremity stability test: a clinical field test. J Sport Rehab. 2000; 9; 35–45 [Google Scholar]
- 15. Collins DR, Hodges PB. A comprehensive guide to sports skills tests and measurement. Springfield, Illinois: Charles C Thomas Publisher; 1978 [Google Scholar]
- 16. Prokopy MP, Ingersoll CD, Nordenschild E, Katch FI, Gaesser GA, Weltman A. Closed kinetic chain upper body training improves throwing performance of NCAA division 1 softball players. J Strength Cond Res. 2008; 22 (6): 1790–1798 [DOI] [PubMed] [Google Scholar]
- 17. Derenne C, Ho KW, Murphy JC. Effects of general, special, and specific resistance training on throwing velocity in baseball: a brief review. J Strength Cond Res. 2001; 15 (1): 148–156 [PubMed] [Google Scholar]
- 18. Van Den Tillaar R. Effect of different training programs on the velocity of overarm throwing: a brief review. J Strength Cond Res. 2004; 18 (2): 388–396 [DOI] [PubMed] [Google Scholar]
- 19. Carter AB, Kaminski TW, Douex AT, Jr., Knight CA, Richards JG. Effects of high volume upper extremity plyometric training on throwing velocity and functional strength ratios of the shoulder rotators in collegiate baseball players. J Strength Cond Res. 2007; 21 (1): 208–215 [DOI] [PubMed] [Google Scholar]
- 20. Fleisig GS. The biomechanics of baseball pitching. Doctoral Thesis University of Alabama at Birmingham; Birmingham, Alabama: 1994 [Google Scholar]


