

Abstract
An increased plasma concentration of 3-hydroxyisovaleryl carnitine (3HIA-carnitine) results from impairment in the leucine catabolic pathway at the conversion of 3-methyl-crotonyl-CoA to 3-methylglutaconyl-CoA. The impairment is caused by reduced activity of the biotin-dependent enzyme 3-methylcrotonyl-CoA carboxylase. Here, we describe an LC-MS/MS method for the quantitation of 3HIA-carnitine in plasma and present preliminary evidence validating plasma 3HIA-carnitine as a novel biomarker of biotin deficiency in humans. Three healthy adult subjects were successfully made marginally biotin deficient by feeding of a 30% egg-white diet for 28 days. For each subject, the plasma 3HIA-carnitine increased approximately 3-fold from Study Day 0 to Study Day 28 (p = 0.027). These results indicate that plasma 3HIA-carnitine concentration increases with biotin deficiency. If these results are confirmed in larger studies, plasma 3HIA-carnitine is likely to be an important indicator of biotin status in a variety of clinical circumstances because quantitation of 3HIA-carnitine by this method has several technical advantages over existing validated indicators of biotin status in humans.
Marginal degrees of biotin deficiency are teratogenic in several species including mice which raises concern that biotin deficiency during early pregnancy might be teratogenic.1–4 Marginal biotin deficiency does not produce signs in the mouse dam, reduce reproductive efficiency, or reduce birth weight of offspring. Marginal biotin deficiency, however, does cause high rates of fetal abnormalities including orofacial clefts and limb shortening defects.5 In both timing and degree of metabolic disturbance, the mouse model resembles biotin deficiency during human gestation, further increasing concern about teratogenesis in humans.
An essential first step in assessing risk of human teratogenesis caused by biotin deficiency is to assess biotin status in the first trimester of a substantial number of normal human pregnancies. Timing of this early biotin status is particularly relevant because human organ and skeletal formation occur primarily in the first trimester. Our investigations have produced increasing evidence that marginal, but metabolically significant, biotin deficiency occurs frequently in normal human gestation6 and that the incidence of biotin deficiency is already high in the first trimester.7 The evidence for biotin deficiency includes both reduced activity of the biotin-dependent enzyme propionyl-CoA carboxylase (PCC) in peripheral blood lymphocytes (PBLs) and increased urinary excretion of 3-hydroxyisovaleric acid (3HIA). This increased 3HIA excretion reflects decreased activity of the biotin-dependent enzyme 3-methylcrotonyl-CoA carboxylase (MCC). PCC activity is a sensitive and specific indicator of biotin status that is independent of renal function, which is altered by pregnancy per se.7 The fundamental principal of the assay is quantitation of the incorporation of 14C-bicarbonate into methylmalonyl-CoA by PCC; enzyme activity is routinely normalized by lymphocyte protein content to account for variations in PBL count and efficiency of lymphocyte isolation.8 Both of these indicators of biotin status have been validated in marginal biotin deficiency induced experimentally in humans by egg-white feeding.7,9
On the basis of studies of genetic deficiency of either MCC10 or holocarboxylase synthetase,11 the measured plasma concentration of 3-hydroxyisovaleryl carnitine (3HIA-carnitine) increases in response to reduced activity of MCC. Here, we describe the development, analytical validation, and initial clinical validation of a new method for accurate quantitation of normal and minimally elevated plasma concentrations of 3HIA-carnitine due to marginal biotin deficiency. This method for 3HIA-carnitine quantitation is novel because the accuracy, precision, and dynamic range allows for the assessment of biotin status in humans subjected to a variety of phenotypical factors that have the potential to cause marginal biotin deficiency (e.g., pregnancy, diet, prescription or illegal drug use, disease, and smoking). Moreover, the method can be used to detect inborn genetic deficiency of MCC in newborns; in this circumstance, the plasma 3HIA-carnitine concentration is often elevated by a factor of 10–100 fold over the normal range.12,13 For assessment of marginal biotin deficiency in humans, quantitative measurement of plasma 3HIA-carnitine concentration over the range of 2.0–60 ng/mL (7.6–230 pmol/mL) is desired. This concentration range reflects plasma 3HIA-carnitine concentrations from near the lower limit of normal up to approximately twice the upper limit of normal, which is 0–29 ng/mL (0–110 pmol/mL) in plasma.13
EXPERIMENTAL SECTION
Reagents and Chemicals
Methanol (Optima, LC-MS grade), ammonium acetate (97.0% pure, ACS certified), and formic acid (99% pure, Acros Organics, Geel, Belgium) were purchased from Fisher Scientific (Pittsburgh, PA). Dulbecco’s phosphate buffered saline (PBS) and trifluoroacetic acid (>98% pure, reagent grade) in 1 mL ampules were purchased from Sigma Aldrich (St. Louis, MO). Deionized water was used for all studies and was purified to 18.2 MΩ-cm resistivity using a Siemans PURELAB Ultra laboratory water purification system (Warrendale, PA.). Analytical standards for 3HIA-carnitine (>98% pure) and [N-methyl-D3] D3-3-hydroxyisovaleryl carnitine (D3-3HIA-carnitine, >98% pure) were a generous gift from Cambridge Isotope Laboratories (Andover, MA).
Equipment
High-throughput solid phase extraction (SPE) of 3HIA-carnitine and D3-3HIA-carnitine from human plasma was performed using a Gilson SPE 215 4-probe robotic sample handling system (Middleton, WI) with Strata X-CW 33 μm polymeric weak cation exchange cartridges purchased from Phenomenex (Torrance, CA). Prior to reconstitution, sample extracts were evaporated to dryness using a TurboVap LV Evaporator Workstation from Caliper Life Sciences (Hopkinton, MA). HPLC separations were performed using an Agilent Series 1200 quaternary liquid chromatography system (Santa Clara, CA). This HPLC system included an autosampler, high-pressure quaternary pumps, column oven, and system controller. Sample analysis was performed using an Applied Biosystems API-4000 Q TRAP tandem mass spectrometer (Carlsbad, CA).
Analytical Calibration and Quality Control Standard Preparations
Two stock solutions used for 3HIA-carnitine calibration and quality control (QC) standards were prepared in PBS buffer at 750 ng/mL and 2000 ng/mL, respectively. The 750 ng/mL stock was serially diluted with PBS buffer to give nominal 3HIA-carnitine calibration standard concentrations of 250, 83.3, 27.8, 9.26, 3.09, and 1.03 ng/mL. The MS instrumental response factor (IR = AUCAnalyte/AUCIS) for each of the prepared calibration standards was shown to be linear over this range. The 2000 ng/mL working stock was used to prepare QC standards by serial dilution in an appropriate volume of human plasma matrix processed from whole blood obtained from an adult volunteer. Nominal 3HIA-carnitine concentrations in the QC standards were 200, 20, and 2 ng/mL. These QC concentrations were chosen to evaluate precision and accuracy over the high, middle, and low range of the calibration curve. To correct for the endogenous 3HIA-carnitine content of the plasma sample used for the QC standards, an endogenous control sample was made with the same volume of plasma from the common plasma source and a constant amount of D3-3HIA-carnitine without any addition of exogenous 3HIA-carnitine. The measured endogenous concentration was then subtracted from each of the calculated concentrations of 3HIA-carnitine for each of the QC standards. A stock for the D3-3HIA-carnitine internal standard (IS) was prepared at 10 ng/mL in PBS buffer.
Sample Preparation
Calibration and QC standards, PBS buffer blanks, and human subject samples were prepared by mixing 100 μL of the IS working stock with 100 μL of the prepared calibration standards, the QC standards, blank PBS, or the human subject samples. Mixtures were vortexed for 10 s. This procedure ensured an absolute IS concentration of 5 ng/mL for each sample.
To assess autosampler carryover, a blank standard was prepared from PBS buffer with no 3HIA-carnitine or IS added. Analysis of this blank throughout validation showed that the autosampler was free from carryover when methanol was used as the needle rinse solvent. A second blank was prepared as a 0 ng/mL 3HIA-carnitine QC sample to assess any 3HIA-carnitine contamination of the IS working stock solution by mixing 100 μL of the IS working stock to 100 μL of blank PBS buffer. Analysis of this blank sample throughout validation showed that the IS working stock was free from 3HIA-carnitine contamination.
SPE Methodology/% Recovery
All samples were prepared for SPE by mixing 100 μL of the sample with 900 μL of 10 mM ammonium acetate buffer solution, pH 7.0, followed by vortexing for 30 s. Then 800 μL of the sample mix was loaded onto an extraction cartridge that had been preconditioned with 1 mL of methanol and equilibrated with 1 mL of 10 mM ammonium acetate, pH 7.0. Cartridges were washed with 1 mL of 10 mM ammonium acetate buffer and eluted twice with 1 mL of 2% formic acid in methanol. All conditioning, equilibration, loading, washing, and elution steps used a stream of nitrogen at 10 PSI to elute the various solutions under positive pressure. The eluate containing the extracted analyte and IS was dried using a TurboVap evaporator workstation with the temperature controlled water bath heated to 70 °C under a stream of nitrogen at a positive pressure of ~2 PSI. Sample residues were reconstituted with 100 μL of a 25:75 methanol/water (V/V) mixture, vortexed for 40 s, transferred to sample vials, and stored at 4 °C until assayed.
Liquid Chromatography/Mass Spectrometry Conditions
Isocratic liquid chromatography for 3HIA-carnitine and D3-3HIA-carnitine was performed using an Agilent Zorbax Eclipse XDB-C18 analytical column (150 × 4.6 mm, 5 μm) heated to 30 °C. The mobile phase mixture was 60:40 (V/V) of 0.1% trifluoroacetic acid (TFA) in water/0.1% TFA in methanol delivered at a constant flow rate of 500 μL/min.
The Analyst software (Version 1.5, Life Technologies, Carlsbad, CA) was used to control the overall operation of the HPLC system and the mass spectrometer. Chromatographic data was acquired on the LC-MS/MS operating in positive ion mode. The Turbo IonSpray source voltage was 5000 V. The source temperature was 500 °C. Nitrogen gas pressures for the GS1 and GS2 source gases, curtain gas, and collision gases were 45.0, 45.0 and 25.0 cm/S, and “high”, respectively. Molecule specific parameters and Specific Reaction Monitoring (SRM) transitions are listed in Table 1. Although not used for this study, secondary fragments of 144.1 m/z and 147.1 m/z were identified for 3HIA-carnitine and D3-3HIA-carnitine, respectively. The relative abundance of these fragments is approximately 10% of fragment 85.0 m/z, which was monitored for both 3HIA-carnitine and D3-3HIA-carnitine.
Table 1.
Mass Spec Molecule Specific Parametersa
| compound | SRM transition (m/z) | CE (eV) | DP (eV) | CXP (eV) |
|---|---|---|---|---|
| 3HIA-carnitine | 262.2 → 85.0 | 35 | 71 | 10 |
| D3-3HIA-carnitine | 265.3 → 85.0 | 33 | 71 | 14 |
SRM: Selected Reaction Monitoring transition; CE: collision energy; DP: declustering potential; CXP: collison cell exit potential.
Clinical Study Design
The Institutional Review Board for the University of Arkansas for Medical Sciences approved this study. Written informed consent was obtained from each of the subjects prior to starting the study, and consent was assessed intermittently during the study. To measure the effect of biotin deficiency on 3HIA-carnitine plasma concentration, marginal asymptomatic biotin deficiency was induced in three healthy adults (2 women) by 28 days of feeding a diet low in biotin and high in undenatured egg white as described previously.14 Peripheral venous blood was sampled fasting on Study Day 0 and again on Study Day 28. To ensure biotin sufficiency, biotin-loading (30 μg/d for 1 week) and washout (0 μg/d for 2 weeks) was performed in the 4 weeks before initiating the egg-white diet as previously described.14 Biotin sufficiency on Study Day 0 and biotin deficiency on Study Day 28 was documented by measuring PCC activity in PBLs as described previously.14 A normal range for PCC activity was established by measuring lymphocyte PCC activity in 18 healthy adults who underwent a similar biotin loading and washout.14
Human Plasma Processing
Plasma for the samples was prepared by collecting blood from human subjects in syringes in which 1000 U/mL heparin was added to produce 15 U/mL whole blood. In order to simultaneously harvest PBLs (for PCC activity determinations), plasma was separated from whole blood by density gradient centrifugation as previously described.14 The processed plasma samples were stored at −80 °C until assayed. The human plasma matrix used in the preparation of the QC standards was collected from one adult volunteer and prepared as described above.
Statistical Methods
The normal range for PCC activity in PBLs was chosen as the 10th and 90th percentile of the distribution of the activity in 18 normal subjects as previously described.14 These percentiles, rather than ±2.5 standard deviations, were chosen to define the normal range because of the non-normal distribution of PCC activity values despite normalization against lymphocyte protein content (in mg). The significance of change in PBL PCC activity and plasma concentration of 3HIA-carnitine between Study Day 0 and Study Day 28 was tested by a paired Student’s t test; p < 0.05 was chosen as the critical value for statistical significance.
RESULTS AND DISCUSSION
Biotin is a water-soluble vitamin in the B complex and acts as an enzymatic cofactor for intracellular carboxylases.15–17 Biotin is released from digested dietary protein in the gut by the enzyme biotinidase and incorporated into apocarboxylases by the enzyme holocarboxylase synthetase. There are five known mammalian carboxylases: pyruvate carboxylase (PC),18 propionyl CoA carboxylase (PCC),9 3-methylcrotonyl CoA carboxylase (MCC),10,19 and the two isozymes of acetyl CoA carboxylase (ACC).20 These enzymes catalyze critical steps in several biochemical pathways, including gluconeogenesis, fatty acid biosynthesis, catabolism of branched chain amino acids, and odd chain fatty acid metabolism.15 Decreased MCC activity causes an impairment of leucine catabolism resulting in an increase of the intramitochondrial concentration of 3-methylcrotonyl CoA, which is then shunted via an alternate metabolic pathway to 3HIA-carnitine. This process is thought to restore the intracellular free CoA/esterified CoA ratio and reduce the toxicity associated with increased concentrations of the acyl CoAs (Figure 1).10,21 This alternate pathway reflects a general phenomenon in which increased intracellular concentrations of acyl CoAs cause increased plasma concentrations of the corresponding acyl carnitine.
Figure 1.

Impairment of the leucine catabolism pathway due to reduced activity of the biotin-dependent enzyme 3-methylcrotonyl-CoA carboxylase (MCC) as a result of biotin deficiency. The enzymes responsible for the catalysis of the reactions are 1, isovaleryl-CoA dehydrogenase; 2, 3-methylcrotonyl-CoA carboxylase, 3, crotonase; 4, carnitine acyltransferase. Inset: Molecular structure of 3-hydroxy-isovaleryl carnitine.
Precision, Accuracy, and % Recovery
Four analytical batches were prepared, extracted, and assayed on four different days. A calibration curve was constructed by plotting the instrument response (IR) factor for each calibration standard against the nominal 3HIA-carnitine concentration. From this plot, a least-squares, linear regression without weighting was used to calculate a line of best fit. A typical linear regression of IR versus [3HIA-carnitine] yielded the following equation: IR = 0.0642 × [3HIA-carnitine] − 0.00289; the regression coefficient was 0.9995. The 95% confidence intervals (CIs) for the slope of this regression were 0.061–0.067. The 95% CIs for the y-intercept were −0.293 to +0.292. The linear regression parameters for the four analytical batches included a range of calculated slopes from 0.051 to 0.067, y-intercepts from −0.036 to +0.060, and regression coefficients from 0.9986 to 1.000.
The precision and accuracy for this method was determined by replicate (n = 5) analysis of prepared QC standards at 3HIA-carnitine concentrations of 2, 20, and 200 ng/mL in human plasma matrix. Each of the plasma QC replicates for the three QC concentrations was corrected for endogenous 3HIA-carnitine content prior to data analysis (Table 2). The endogenous 3HIA-carnitine plasma concentration was measured to be 2.80 ± 0.821 ng/mL (mean ± 1 SD of 4 replicate measurements). The accuracy for the method was calculated as the % relative error for each of the corrected QC concentrations using the following equation: [(corrected mean calculated concentration − nominal concentration)/(nominal concentration)] × 100. The precision for the method was calculated as the % CV for the five replicates at the three QC concentrations. The % recovery for the extraction process was calculated to be 62.1% using the ratio of the mean absolute peak areas measured for D3-3HIA-carnitine in prepared plasma QC’s and neat, nonextracted control samples (n = 9). The isocratic conditions described above resulted in chromatographic retention times of 3.33 min for both 3HIA-carnitine and D3-3HIA-carnitine as exhibited in a reference QC 20 ng/mL sample (Figure 2A) and a human subject sample (Figure 2B).
Table 2.
| nominal conc. (ng/mL) | mean calc. conc. (ng/mL) | precision (% CV) | accuracy (% RE) |
|---|---|---|---|
| 2.00 | 2.42 | 20.1 | 21.2 |
| 20.0 | 23.9 | 6.95 | 19.4 |
| 200 | 212 | 9.83 | 6.18 |
Calculated from the linear least-squares regression composed for the calibration standards (n = 5).
Calculated as the coefficient of variation for the QC standard (n = 5) concentrations after correction for endogenous content of 3HIA-carnitine in the plasma.
Calculated as [(corrected mean calculated concentration − nominal concentration)/nominal concentration] × 100.
Figure 2.
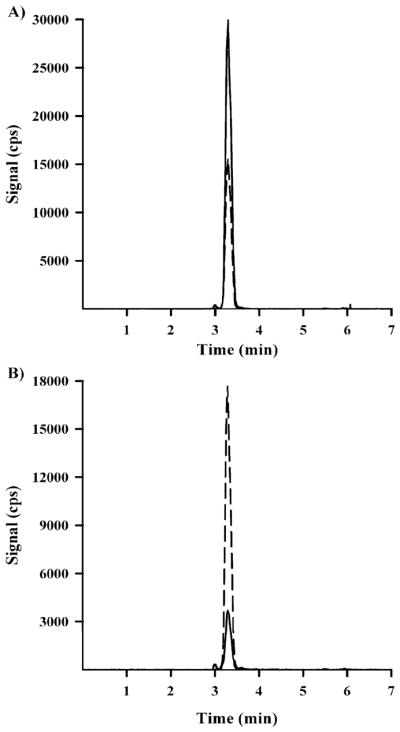
(A) Chromatogram for a 20 ng/mL 3HIA-carnitine QC standard prepared in human plasma matrix (3HIA-carntine, solid line; D3-3HIA-carnitine, dotted line). (B) Chromatogram for a representative subject sample on Study Day 0 (3HIA-carnitine, solid line; D3-3HIA-carnitine, dotted line).
Biotin Status
Biotin deficiency was successfully induced in the three subjects as documented by normal PCC activity on Study Day 0 and abnormally reduced PCC on Study Day 28 (Figure 3A). Plasma 3HIA-carnitine concentration increased approximately 3-fold between Study Day 0 and Study Day 28 for each subject (Figure 3B); this increase was significant at p = 0.027. The observed increase in plasma 3HIA-carnitine concentration mirrored the reduction in PCC activity. These data provide evidence that the enzymatic activity of MCC is sufficiently decreased to impair catabolism of leucine even at this marginal, asymptomatic degree of biotin deficiency.
Figure 3.

(A) PBL PCC activity for three human research subjects at Study Day 0 (biotin sufficient) and Study Day 28 (rendered biotin deficient). (B) Plasma 3HIA-carnitine concentrations for the same three human research subjects at Study Day 0 and Study Day 28.
The preliminary observation that this small molecule is a biomarker of marginal biotin status in humans is potentially important because measurement of this biomarker has several advantages over the existing validated indicators of marginal biotin status in humans. Currently, measurement of PCC activity in PBLs is technically demanding for several reasons. PCC must be enzymatically active after sample processing, cell isolation, and storage dictating timely processing and storage at −70 °C. Moreover, care must be taken during sample isolation to avoid hemolysis because hemoglobin interferes with the spectrophotometric protein assay. Complete removal of the 14CO2 from the trichloroacetic acid precipitable solids containing the reaction product (14C-labeled methylmalonyl-CoA) is technically challenging.
Sample preparation for the LC-MS/MS measurement of 3HIA-carnitine in human plasma using an authentic deuterated IS is less prone to error than the PCC activity assay, particularly for conditions of sample acquisition that are typical for clinical studies. The response of 3HIA-carnitine concentration to marginal degrees of biotin deficiency is likely to be measured in multiple biological matrixes such as whole blood, serum, and urine. 3HIA-carnitine is likely to be stable in these matrixes over a variety of storage conditions ranging from room temperature down to −80 °C.10,22,23 Moreover, 3HIA-carnitine in plasma is likely not substantially influenced by renal function, whereas urinary excretion of 3HIA (the second best validated indicator) is directly affected by renal function. This advantage is potentially important in clinical circumstances in which renal function may be altered (e.g., pregnancy and renal disease) or in which urine collection is impractical (e.g., infants).
CONCLUSION
Our data shows that the concentration of plasma 3HIA-carnitine measured by this method increases with marginal biotin deficiency induced experimentally in healthy adults. These preliminary data support a conclusion that 3HIA-carnitine concentration in plasma is a valid indicator of marginal biotin deficiency in humans; greater confidence in this conclusion awaits study of a larger number of subjects in a wider variety of clinical conditions. Potential confounders of plasma 3HIA-carnitine as an indicator of marginal biotin deficiency include dietary intake of leucine and isoleucine (flux in the catabolic pathway) and heterozygous carrier status for MCC deficiency and other enzymes distal to the MCC step in the leucine catabolic pathway. We speculate that measurement of 3HIA-carnitine can be applied to other areas of research in which biotin deficiency has been proposed or demonstrated to be a consequence of therapy or clinical circumstances.
Acknowledgments
This work was supported by the following agencies: National Institutes of Health, Grants R37 DK36823 (D.M.M.), R37 DK36823-26S1 (D.M.M.), and R01 DK79890-01S1 (D.M.M.); Centers for Disease Control cooperative agreement contract, 200-2007-21729 (J.M.); Bioterrorism Cooperative Agreement, U90/CCU616974-07 (J.M.); Association of Public Health Laboratories EH Training Fellowship. The project described was supported by Award Number 1UL1RR029884 from the National Center For Research Resources. The content is solely the responsibility of the authors and does not necessarily represent the official views of the National Center For Research Resources or the National Institutes of Health. We thank Mrs. Suzanne Owen at the Arkansas Department of Health for her technical assistance and Ms. Brandy VanDenBerg at UAMS for editorial support for this work. We would like to thank Joel Bradley, Ron Trolard, and Rosemarie Bachand of Cambridge Isotope Laboratories for the gift of the authentic 3HIA-carnitine and D3-3HIA-carnitine standards used in the performance of the work described herein.
References
- 1.Zempleni J, Mock D. Proc Soc Exp Biol Med. 2000;223:14–21. doi: 10.1046/j.1525-1373.2000.22303.x. [DOI] [PubMed] [Google Scholar]
- 2.Watanabe T, Endo A. Teratology. 1990;42:295–300. doi: 10.1002/tera.1420420313. [DOI] [PubMed] [Google Scholar]
- 3.Mock D. In: Modern Nutrition in Health and Disease. 10. Shils ME, Shike M, Ross AC, Caballero B, Cousins RJ, editors. Lippincott, Williams & Wilkins; Baltimore, MD: 2006. pp. 498–506. [Google Scholar]
- 4.Watanabe T, Endo A. J Nutr. 1991;121:101–104. doi: 10.1093/jn/121.1.101. [DOI] [PubMed] [Google Scholar]
- 5.Sealey W, Stratton SL, Hansen DK, Mock DM. J Nutr. 2005;135:973–977. doi: 10.1093/jn/135.5.973. [DOI] [PMC free article] [PubMed] [Google Scholar]
- 6.Mock DM. J Nutr. 2009;139:154–157. doi: 10.3945/jn.108.095273. [DOI] [PMC free article] [PubMed] [Google Scholar]
- 7.Mock DM, Quirk JG, Mock NI. Am J Clin Nutr. 2002;75:295–299. doi: 10.1093/ajcn/75.2.295. [DOI] [PMC free article] [PubMed] [Google Scholar]
- 8.Mock DM, Mock NI. J Nutr. 2002;132:1945–1950. doi: 10.1093/jn/132.7.1945. [DOI] [PMC free article] [PubMed] [Google Scholar]
- 9.Stratton SL, Bogusiewicz A, Mock MM, Mock NI, Wells AM, Mock DM. Am J Clin Nutr. 2006;84:384–388. doi: 10.1093/ajcn/84.1.384. [DOI] [PMC free article] [PubMed] [Google Scholar]
- 10.Roschinger W, Millington DS, Gage DA, Huang ZH, Iwamoto T, Yano S, Packman S, Johnston K, Berry SA, Sweetman L. Clin Chim Acta. 1995;240:35–51. doi: 10.1016/0009-8981(95)06126-2. [DOI] [PubMed] [Google Scholar]
- 11.Wolf B. In: The Metabolic and Molecular Basis of Inherited Disease. 8. Scriver CR, Beaudet AL, Sly WS, Valle D, editors. McGraw-Hill; New York: 2001. pp. 3151–3177. [Google Scholar]
- 12.Van Hove JL, Josefsberg S, Freehauf C, Thomas JA, Thuy LP, Barshop BA, Woontner M, Mock DM, Chiang PW, Spector E, Meneses-Morales I, Cervantes-Roldan R, Leon-Del-Rio A. Mol Genet Metab. 2008;95:210–215. doi: 10.1016/j.ymgme.2008.09.006. [DOI] [PMC free article] [PubMed] [Google Scholar]
- 13.Ficicioglu C, Payan I. Pediatrics. 2006;118:2555–2556. doi: 10.1542/peds.2006-1659. [DOI] [PubMed] [Google Scholar]
- 14.Vlasova TI, Stratton SL, Wells AM, Mock NI, Mock DM. J Nutr. 2005;135:42–47. doi: 10.1093/jn/135.1.42. [DOI] [PMC free article] [PubMed] [Google Scholar]
- 15.Mock DM. In: Handbook of Vitamins. 4. Zempleni J, Rucker RB, McCormick DB, Suttie JW, editors. CRC Press; Boca Raton, FL: 2007. pp. 361–384. [Google Scholar]
- 16.Zempleni J, Mock DM. J Nutr Biochem. 1999;10:128–138. doi: 10.1016/s0955-2863(98)00095-3. [DOI] [PubMed] [Google Scholar]
- 17.Wolf B, Feldman GL. Am J Hum Genet. 1982;34:699–716. [PMC free article] [PubMed] [Google Scholar]
- 18.Wallace JC, Jitrapakdee S, Chapman-Smith A. Int J Biochem Cell Biol. 1998;30:1–5. doi: 10.1016/s1357-2725(97)00147-7. [DOI] [PubMed] [Google Scholar]
- 19.Mock NI, Mock DM. J Nutr. 1992;122:1493–1499. doi: 10.1093/jn/122.7.1493. [DOI] [PubMed] [Google Scholar]
- 20.Kim K-H. In: Annual Review of Nutrition. McCormick DB, Bier DM, Goodridge AG, editors. Annual Reviews; Palo Alto, CA: 1997. pp. 77–99. [Google Scholar]
- 21.Costa CG, Struys EA, Bootsma A, ten Brink HJ, Dorland L, Tavares de Almeida I, Duran M, Jakobs C. J Lipid Res. 1997;38:173–182. [PubMed] [Google Scholar]
- 22.Maeda Y, Ito T, Ohmi H, Yokoi K, Nakajima Y, Ueta A, Kurono Y, Togari H, Sugiyama N. J Chromatogr, B: Anal Technol Biomed Life Sci. 2008;870:154–159. doi: 10.1016/j.jchromb.2007.11.037. [DOI] [PubMed] [Google Scholar]
- 23.Shigematsu Y, Bykov IL, Liu YY, Nakai A, Kikawa Y, Sudo M, Fujioka M. J Inherited Metab Dis. 1994;17:678–690. doi: 10.1007/BF00712010. [DOI] [PubMed] [Google Scholar]