

Abstract
Previous studies have shown that dopamine and galanin modulate cholinergic transmission in the hippocampus, but little is known about the mechanisms involved and their possible interactions. By using resonance energy transfer techniques in transfected mammalian cells, we demonstrated the existence of heteromers between the dopamine D1-like receptors (D1 and D5) and galanin Gal1, but not Gal2 receptors. Within the D1–Gal1 and D5–Gal1 receptor heteromers, dopamine receptor activation potentiated and dopamine receptor blockade counteracted MAPK activation induced by stimulation of Gal1 receptors, whereas Gal1 receptor activation or blockade did not modify D1-like receptor-mediated MAPK activation. Ability of a D1-like receptor antagonist to block galanin-induced MAPK activation (cross-antagonism) was used as a “biochemical fingerprint” of D1-like–Gal1 receptor heteromers, allowing their identification in the rat ventral hippocampus. The functional role of D1-like–Gal receptor heteromers was demonstrated in synaptosomes from rat ventral hippocampus, where galanin facilitated acetylcholine release, but only with costimulation of D1-like receptors. Electrophysiological experiments in rat ventral hippocampal slices showed that these receptor interactions modulate hippocampal synaptic transmission. Thus, a D1-like receptor agonist that was ineffective when administered alone turned an inhibitory effect of galanin into an excitatory effect, an interaction that required cholinergic neurotransmission. Altogether, our results strongly suggest that D1-like–Gal1 receptor heteromers act as processors that integrate signals of two different neurotransmitters, dopamine and galanin, to modulate hippocampal cholinergic neurotransmission.
Introduction
The neuropeptide galanin is widely distributed in the CNS (Melander et al., 1986a,b; Hökfelt et al., 1998; Ögren et al., 1998), where it is coreleased with noradrenaline, serotonin, histamine, and acetylcholine (ACh) (Hökfelt et al., 1998). Particular attention has been given to the presence of galanin in a population of cholinergic neurons in the septal nucleus and diagonal band of Broca, which project to the hippocampal formation (Melander et al., 1985), because of its possible relevance for learning, memory, and Alzheimer's disease (Ögren et al., 1998; Mitsukawa et al., 2008). Gal1 and Gal2 receptors are the predominant galanin receptor subtypes in the brain and, together with the less populated subtype Gal3, they belong to the G-protein-coupled receptor (GPCR) family (Branchek et al., 2000). The lack of selective ligands and reliable antibodies (Hawes and Picciotto, 2005) has made it difficult to identify the distribution of Gal1 and Gal2 receptors in the septohippocampal system. Gal1 mRNA is highly expressed in the septal area, where Gal2 mRNA expression is moderate and confined to a few scattered neurons (Parker et al., 1995; O'Donnell et al., 1999). 125I-galanin binding sites in the ventral hippocampus are significantly reduced after lesions of the septohippocampal projection, which eliminates most cholinergic input to the ventral hippocampus (Fisone et al., 1987). This provided clear evidence for the existence of a significant population of presynaptic hippocampal galanin receptors localized in cholinergic nerve terminals, although the galanin receptor subtype involved is still a matter of debate (Miller et al., 1997). With postsynaptic galanin receptors, Gal1 is preferentially expressed in the ventral hippocampus, CA1, and subiculum, whereas Gal2 is expressed in the dentate gyrus of both ventral and dorsal hippocampus (O'Donnell et al., 1999).
In vivo studies in rodents with central administration of galanin have suggested that galanin inhibits cholinergic neurotransmission in the ventral hippocampus (Fisone et al., 1987; Ögren et al., 1998; Laplante et al., 2004a). Furthermore, central administration of galanin leads to cognitive deficits in a variety of tasks (Crawley, 1996; Ögren et al., 1998). However, recent postmortem studies on brains from Alzheimer's disease patients suggest that galanin may instead stimulate cholinergic neurotransmission, which could attenuate the development of Alzheimer's symptoms (Counts et al., 2008; Ögren et al., 2010).
In addition to galanin, dopamine also plays a key modulatory role in the septohippocampal cholinergic pathway. Initial studies showed that dopamine facilitates hippocampal ACh release by acting on D1-like receptors that are thought to be located in hippocampal cholinergic terminals (Hersi et al., 1995). Of the two D1-like receptor subtypes, D1 and D5, D5 is the predominant subtype in the hippocampus (Ciliax et al., 2000) and the one most probably involved in the modulation of hippocampal ACh release (Hersi et al., 2000; Laplante et al., 2004b). In the present study, we demonstrate that dopamine and galanin work in concert to modulate cholinergic neurotransmission in the ventral hippocampus and that this modulation can occur via heteromers between D1 or D5 receptors and Gal1 receptors.
Materials and Methods
Animals.
Male Wistar rats (4–7 weeks old) from Harlan Interfauna Iberica were housed in a temperature- (21 ± 1°C) and humidity-controlled (55 ± 10%) room with a 12 h light/dark cycle with food and water ad libitum. Animal procedures were conducted according to standard ethical guidelines (European Communities Council Directive 86/609/EEC) and approved by the local (Portuguese or Spanish) ethical committees. Rats were anesthetized with isoflurane before decapitation.
Cell culture.
Human embryonic kidney 293T (HEK-293T) cells were grown in DMEM supplemented with 2 mm l-glutamine, 100 μg·ml−1 sodium pyruvate, 100 units/ml penicillin/streptomycin, and 5% (v/v) heat-inactivated fetal bovine serum (FBS) (all supplements were from Invitrogen). Chinese hamster ovary (CHO) cells were cultured in MEM α medium without nucleosides supplemented with 100 units/ml of penicillin/streptomycin and 10% (v/v) heat-inactivated FBS. HEK-293T and CHO cells were maintained at 37°C in a humidified atmosphere of 5% CO2 and were passaged when they were 80–90% confluent, i.e., approximately twice a week.
Fusion proteins and expression vectors.
The cDNAs for D1, D5, Gal1,Gal2, cannabinoid CB1, and serotonin 5HT2B receptors cloned into pcDNA3.1 were amplified without their stop codons using sense and antisense primers harboring unique EcoRI and BamHI sites to clone D1, D5, and 5HT2B receptors and EcoRV and KpnI sites to clone Gal2 receptors in the Renilla luciferase (Rluc) vector, or EcoRI and BamHI to clone D1, D5, and CB1 receptors and EcoRI and KpnI to clone the Gal1 receptor in the enhanced yellow fluorescent protein (EYFP) vector. The amplified fragments were subcloned to be in-frame into restriction sites of pcDNA3.1-Rluc (Renilla luciferase; Clontech) or pEYFP-N1 (Clontech) vectors resulting in the plasmids D1-Rluc, D1-YFP, D5-Rluc, D5-YFP, Gal1-YFP, and Gal2-Rluc. Expression of constructs was tested by confocal microscopy, and the receptor functionality by ERK1/2 phosphorylation (see Results). The cDNA encoding the C terminus of the rat D1 or D5 receptors (D1CT and D5CT, respectively) were amplified from Rat Brain QUICK-Clone cDNA (Clontech) by PCR using the following primers: D1-CT1012F (CAG AAG GCG TTC TCA ACC) and D1-CT1321R (AGT GGA ATG CTG TCC ACT) or D5-CT1051F (CCC ATC ATC TAT GCC TTT AAT GCA GAC TTC) and D5-CT1425R (AGC AGT TTT ATC GAA ACA ATT GGG GGT GAG). The cDNA encoding D1CT or D5CT were subcloned into the BamHI/EcoRI sites of pGEX-4T-1 (GE Healthcare). A GST fusion protein containing the C terminus of the rat D1 or D5 receptors (GST-D1CT and GST-D5CT, respectively) were generated corresponding to amino acid residues 227–335 of the rat D1 receptor and amino acid residues 358–475 of the rat D5 receptor, respectively. Bacterial BL21 (DE3) cells with pGEX-4T-1/Drd5CT plasmid were grown overnight in imMedia medium (Invitrogen) using ampicillin selection. Protein production was induced with 0.5 mm isopropyl-β-d-thiogalactopyranoside (Sigma) at 20°C for 18 h. Bacteria were harvested by centrifugation at 7,500 × g for 15 min at 4°C, and the pellet was suspended in cold PBS buffer with 1 mm PMSF and a protease inhibitor mixture (Roche). Cells were lysed by sonication, and the lysate was incubated for 1 h with 1% Triton X-100 and centrifuged at 18,000 × g for 10 min at 4°C. The supernatant was collected for purification of GST fusion protein. Purification of fusion proteins was performed using the Glutathione Sepharose 4B bead matrix (GE Healthcare) as described by the manufacturer.
Transient transfection and protein determination.
HEK-293T or CHO cells growing in 35-mm-diameter wells of six-well plates were transiently transfected with the corresponding fusion protein cDNA by the ramified polyethylenimine (PEI; Sigma) method. Cells were incubated (4 h) with the corresponding cDNA together with ramified PEI (5 ml/mg cDNA of 10 mm PEI) and 150 mm NaCl in a serum-starved medium. After 4 h, the medium was changed to a fresh complete culture medium. Forty-eight hours after transfection, cells were washed twice in quick succession in HBSS [containing the following (in mm): 137 NaCl, 5 KCl, 0.34 Na2HPO4 × 12 H2O, 0.44 KH2PO4, 1.26 CaCl2 × 2 H2O, 0.4 MgSO4 × 7 H2O, 0.5 MgCl2, 10 HEPES, pH 7.4], supplemented with 0.1% glucose (w/v), detached by gently pipetting, and resuspended in the same buffer. To control the cell number, sample protein concentration was determined using a Bradford assay kit (Bio-Rad) using bovine serum albumin (BSA) dilutions as standards. HEK-293T cell suspension (20 μg of protein) was distributed into 96-well microplates; black plates with a transparent bottom (Porvair) were used for fluorescence determinations, whereas white opaque plates (Sigma) were used for bioluminescence resonance energy transfer (BRET) experiments.
BRET assays.
HEK-293T cells were transiently cotransfected with the indicated amounts of plasmid cDNAs corresponding to the indicated fusion proteins (see corresponding figure legends). To quantify fluorescence proteins, cells (20 μg protein) were distributed in 96-well microplates (black plates with a transparent bottom) and fluorescence was read in a Fluo Star Optima fluorimeter (BMG Lab Technologies) equipped with a high-energy xenon flash lamp, using a 10 nm bandwidth excitation filter at 400 nm reading. Receptor-fluorescence expression was determined as fluorescence of the sample minus the fluorescence of cells expressing receptor-Rluc alone. For BRET measurements, the equivalent of 20 μg of cell suspension was distributed in 96-well microplates (Corning 3600, white plates; Sigma) and 5 μm coelenterazine H (Invitrogen) was added. After 1 min of adding coelenterazine H, readings were collected using a Mithras LB 940 (Berthold), which allows the integration of the signals detected in the short-wavelength filter at 485 nm (440–500 nm) and the long-wavelength filter at 530 nm (510–590 nm). To quantify receptor-Rluc expression, luminescence readings were performed after 10 min of adding 5 μm coelenterazine H. Cells expressing BRET donors alone were used to determine background. The net BRET is defined as [(long-wavelength emission)/(short-wavelength emission)] − Cf, where Cf corresponds to [(long-wavelength emission)/(short-wavelength emission)] for the Rluc construct expressed alone in the same experiment. Curves were fitted using a nonlinear regression equation and assuming a single phase (GraphPad Prism software). BRET is expressed as mili BRET units (mBU: 1000 × net BRET).
Immunocytochemistry.
After 48 h of transfection, HEK-292T cells were fixed in 4% paraformaldehyde for 15 min and washed with PBS containing 20 mm glycine (buffer A) to quench the aldehyde groups. Cells were permeabilized with buffer A containing 0.05% Triton X-100 for 5 min and then were treated with PBS containing 1% bovine serum albumin. After 1 h at room temperature, protein-Rluc was labeled with the primary mouse monoclonal anti-Rluc antibody (1/100; Millipore Bioscience Research Reagents) for 1 h, washed, and stained with the secondary antibody Cy3 Donkey anti-mouse (1/200; Jackson ImmunoResearch). Protein-YFP was detected by its fluorescence properties. The slides were rinsed several times and mounted with a medium suitable for immunofluorescence (30% Mowiol; Calbiochem). The samples were observed in a Leica SP2 confocal microscope (Leica Microsystems).
Pull-down assay.
HEK-293T cells were collected after 48 h of transfection with 25 μg Gal1-YFP, Gal2-YFP, or pEYFP-N1 plasmid (control) and extracted in cell extraction buffer (10 mm Tris, pH 7.4, 100 mm NaCl, 1 mm EDTA, 1 mm EGTA, 1 mm NaF, 20 mm Na4P2O7, 2 mm Na3VO4, 1% Triton X-100, 10% glycerol, 0.1% SDS, 0.5% deoxycholate) with 1 mm PMSF and a protease inhibitor mixture (Roche) for 30 min on ice. The cell extracts were centrifuged at 16,000 × g for 10 min at 4°C, and the supernatant was used for pull-down experiments. Pull-down experiments were performed by incubating cell extracts (135 relative fluorescence units per 800 μl) with 50 μg GST-D1CT, GST-D5CT, or GST for 2 h with constant rotation at 4°C. Then, 30 μl Glutathione Sepharose 4B beads were added, and incubation was prolonged for 1 h. The beads were then washed four times with cold wash buffer (TBS, 0.1% Triton X-100, and protease inhibitor mixture). Subsequently, 50 μl of elution buffer (10 mm reduced glutathione in 50 mm Tris-HCl, pH 8.0) was added to each sample and kept for 10 min at room temperature. Fluorescence in the eluted solution was measured with SpectraMax M5 microplate readers (Molecular Devices) using 514 nm wavelength excitation and 596 nm wavelength emission filters. Differences in relative fluorescence units among the different groups were statistically analyzed with repeated-measures ANOVA with Bonferroni's correction.
ERK phosphorylation assay.
Transfected CHO cells were cultured in serum-free medium for 16 h before the addition of any agent. For assays in hippocampal slices, rat brains were rapidly removed and placed in ice-cold oxygenated (95% O2/5% CO2) Krebs-HCO3− buffer [containing (in mm) 124 NaCl, 4 KCl, 1.25 NaH2PO4, 1.5 MgCl2, 1.5 CaCl2, 10 glucose, and 26 NaHCO3, pH 7.4]. The brains were sliced perpendicularly to the long axis of the hippocampus at 4°C. Slices (400 μm thick) were kept at 4°C in Krebs-HCO3− buffer during the dissection. Each hippocampal slice was transferred into an incubation tube containing 1 ml of ice-cold Krebs-HCO3− buffer [containing (in mm) 124 NaCl, 4 KCl, 1.25 NaH2PO4, 1.5 MgCl2, 1.5 CaCl2, 10 glucose, and 26 NaHCO3]. The temperature was raised to 23°C, and after 30 min the medium was replaced by 2 ml of fresh Krebs-HCO3− buffer (23°C) with similar composition. The slices were incubated under constant oxygenation (95% O2/5% CO2) at 30°C for 4–5 h in an Eppendorf-5 Prime Thermomixer. The medium was replaced by 200 μl of fresh Krebs-HCO3− buffer and incubated for 30 min before the addition of any agent. Cells or slices were treated or not with the indicated ligand for the indicated time and were rinsed with ice-cold PBS and lysed by the addition of 500 μl of ice-cold lysis buffer (50 mm Tris-HCl, pH 7.4, 50 mm NaF, 150 mm NaCl, 45 mm β-glycerophosphate, 1% Triton X-100, 20 μm phenyl-arsine oxide, 0.4 mm NaVO4, and protease inhibitor mixture). The cellular debris was removed by centrifugation at 13,000 × g for 5 min at 4°C, and the protein was quantified by the bicinchoninic acid method using bovine serum albumin dilutions as standard. To determine the level of ERK1/2 phosphorylation, equivalent amounts of protein (10 μg) were separated by electrophoresis on a denaturing 7.5% SDS-polyacrylamide gel and transferred onto PVDF-fluorescence membranes. Odyssey blocking buffer (LI-COR Biosciences) was then added, and the membrane was rocked for 90 min. The membranes were then probed with a mixture of a mouse anti-phospho-ERK1/2 antibody (1:2500; Sigma) and rabbit anti-ERK1/2 antibody that recognizes both phosphorylated and nonphosphorylated ERK1/2 (1:40,000; Sigma) for 2–3 h. Bands were visualized by the addition of a mixture of IRDye 800 (anti-mouse) antibody (1:10,000; Sigma) and IRDye 680 (anti-rabbit) antibody (1:10,000; Sigma) for 1 h and scanned by the Odyssey infrared scanner (LI-COR Biosciences). Bands densities were quantified using the scanner software exported to Excel (Microsoft). The level of phosphorylated ERK1/2 isoforms was normalized for differences in loading using the total ERK protein band intensities. Statistical differences between the different groups were analyzed by one-way ANOVA with Bonferroni's correction.
[3H]Ach release from hippocampal synaptosomes.
The synaptosomal fraction was prepared according to routine (Vaz et al., 2008). Briefly, after decapitation under halothane anesthesia, each brain was rapidly removed into ice-cold continuously oxygenated (95% O2/5% CO2) artificial CSF (aCSF) containing the following (in mm): 124 NaCl, 3 KCl, 1.2 NaH2PO4, 25 NaHCO3, 2 CaCl2, 1 MgSO4, and 10 glucose, pH 7.40. The whole hippocampus was dissected out free of the subiculum or enthorinal cortex areas and the ventral part, i.e., the portion lying in the temporal part of the brain, was isolated from the dorsal one (the portion lying just behind the septum) by a cut made perpendicularly to the long hippocampal axis. The ventral hippocampi were homogenized in an ice-cold isosmotic sucrose solution (0.32 m, containing 1 mm EDTA, 1 mg/ml bovine serum albumin, and 10 mm HEPES, pH 7.4) and centrifuged at 3,000 × g for 10 min; the supernatant was centrifuged again at 14,000 × g for 12 min. The whole procedure was conducted at 4°C. The pellet was resuspended in 45% Percoll in Krebs–Henseleit–Ringer solution containing (in mm) 140 NaCl, 1 EDTA, 10 HEPES, 5 KCl, and 5 glucose, and was centrifuged 14,000 × g for 2 min. The synaptosomal fraction corresponds to the top buoyant layer and was collected from the tube. Percoll was removed by two washes with a KHR solution; synaptosomes were then kept on ice and used within 3 h. The synaptosomes were loaded for 20 min at 37°C, with [methyl-3H] choline chloride (10 μCi/ml, 122 nm). Hemicholinium-3 (10 μm) was present in all solutions up the end of the experiments to prevent choline uptake. Synaptosomes were then layered over Whatman GF/C filters and superfused (flow rate, 0.8 ml/min; chamber volume, 90 μl) with gassed aCSF. After a 30 min washout period, the effluent was collected (release period) in 2 min fractions for 36 min. The synaptosomes were stimulated during 2 min with 20 mm K+ (isomolar substitution of Na+ with K+ in the perfusion buffer) at the 5th and 23rd minutes after starting sample collection (S1 and S2, respectively). The tested drugs were added to the superfusion medium at the 17th minute, therefore before S2, and remained in the bath up to the end of the experiments. When we evaluated the changes of galanin effect by the D1-like receptor agonist SKF 38393, this was applied at the beginning of the washout period, and therefore it was present during S1 and S2 in both test and control chambers, whereas galanin was added before S2 in the test chambers. A “mirror” experiment was also performed to evaluate changes of the effect of SFK 38393 effect by galanin; in this case the neuropeptide was applied at the beginning of the washout period, being therefore present during S1 and S2 in both test and control chambers, whereas SKF 38393 was added before S2 in the test chambers. At the end of each experiment, aliquots (500 μl) of each sample as well as the filters from each superfusion chamber were analyzed by liquid scintillation counting. The fractional release was expressed in terms of the percentage of total radioactivity present in the preparation at the beginning of the collection of each sample. The amount of radioactivity released by each pulse of K+ (S1 and S2) was calculated by integration of the area of the peak after subtraction of the estimated basal tritium release. In each experiment, two synaptosome-loaded chambers were used as control chambers, the others being used as test chambers. In the test chambers, the test drug was added to the perfusion solution before S2, and the S2/S1 ratios in control and test conditions were calculated. The effect of the drug on the K+-evoked tritium release was expressed as percentage of change of the S2/S1 ratios in test conditions compared to the S2/S1 ratios in control conditions in the same experiments (i.e., with the same pool of synaptosomes). When present during S1 and S2, neither galanin nor SKF 38393 significantly (p > 0.05, Student's t test) altered the S2/S1 ratio as compared with the S2/S1 ratio obtained in the absence of these drugs. The values presented are the mean ± SEM of n experiments. For comparisons, statistical significance was assessed with Student's t test using GraphPad Software (Prism, version 4.02 for Windows).
Field EPSP recordings from hippocampal slices.
After decapitation under halothane anesthesia, the hippocampus was dissected out of the brain on ice-cold continuously oxygenated (95% O2/5% CO2) aCSF as described above. Ventral and dorsal hippocampal slices (400 μm thick, cut perpendicularly to the long axis of the hippocampus) were allowed to recover functionally and energetically for at least 1 h in a resting chamber filled with continuously oxygenated (95% O2/5% CO2) aCSF at room temperature (22–25°C). After recovering, slices were transferred to a recording chamber (1 ml plus 5 ml dead volume) for submerged slices, and were continuously superfused (3 ml/min) at 32°C with oxygenated aCSF; the drugs were added to this superfusion solution. To minimize peptide lost resulting from binding to the perfusion system, all of the system was superfused with 0.1 mg/ml BSA before starting any experiment. Field EPSPs (fEPSPs) were recorded according to routine (Diógenes at al., 2004) through an extracellular microelectrode (4 m NaCl, 2–6 MΩ resistance) placed in the stratum radiatum of the CA1 area. Stimulation (rectangular 0.1 ms pulses, once every 15 s) was delivered through a concentric electrode placed on the Schaffer collateral–commissural fibbers in the stratum radiatum near the CA3–CA1 border. The intensity of stimulus (80–200 μA) was initially adjusted to obtain a large fEPSP slope with a minimum population spike contamination. Recordings were obtained with an Axoclamp 2B amplifier and digitized (Molecular Devices). Individual responses were monitored, and averages of eight consecutive responses were continuously stored on a personal computer with the LTP program (Anderson and Collingridge, 2001). Data are expressed as the mean ± SEM from n number of slices. To allow comparisons between different experiments, slope values were normalized, taking as 100% of the averaged of the five values obtained immediately before applying the test compound. The significance of differences between the mean values obtained in test and control conditions was evaluated by Student's t test. For multiple comparisons, the one-way ANOVA followed by the Bonferroni correction was used.
Drugs.
Galanin was from Bachem. (R)-(+)-7-chloro-8-hydroxy-3-methyl-1-phenyl-2,3,4,5-te trahydro-1H-3-benzazepine hydrochloride (SCH 23390), (±)-6-chloro-2,3,4,5-tetrahydro-1-phenyl-1H-3-benzazepine hydrobromide (SKF 81297), (±)-1-phenyl-2,3,4,5-tetrahydro-(1H)-3-benzazepine-7,8-diol hydrobromide (SKF 38393), and galanin (1–13)-Pro-Pro-(Ala-Leu-)2Ala amide (M40) were from Tocris Cookson. BSA and atropine were from Sigma. Galanin was supplied as a powder that was resuspended in TBS buffer (50 mm Tris-base, 150 mm NaCl, pH 7.60) in a 0.5 mm concentration stock solution. SCH 23390 (10 mm), SKF 38393 (10 mm), and atropine (50 mm) stock solutions were prepared in water. Aliquots of these stock solutions were kept frozen at −20°C until use.
Results
D1 and D5 receptors form heteromers with Gal1 receptors but not with Gal2 receptors
We first looked for a molecular interaction between dopamine D1-like and Gal1 receptors using an in vitro energy transfer assay. First, receptors were cloned as fusion proteins competent for energy transfer experiments. To ensure the fusion proteins trafficked to the correct location in the cell, we performed immunofluorescence experiments in transfected HEK cells. All fusion proteins were found to properly express and localize at the plasma membrane (Fig. 1a). Fusion of Rluc or YFP did not modify receptor function, as determined by ERK1/2 phosphorylation assays (data not shown). Next, we examined whether D1 or D5 and Gal1 receptors form heteromers using the BRET technique. The BRET technique allows real-time detection of two proteins in close proximity in living cells. BRET measurements were performed in transiently cotransfected HEK cells using a constant amount of cDNA, corresponding to D1-Rluc or D5-Rluc receptors, and increasing amounts of cDNA, corresponding to Gal1-YFP receptors. A positive and saturable BRET signal was obtained in cells coexpressing D1-Rluc and Gal1-YFP receptors, with a BRETmax value of 47 ± 4 mBU and a BRET50 value of 7 ± 2, or in cells coexpressing D5-Rluc and Gal1-YFP receptors, with a BRETmax value of 71 ± 3 mBU and a BRET50 value of 6 ± 1 (Fig. 1b), indicating that both D1 and D5 receptors formed heteromers with Gal1 receptors. As negative controls we first used cells cotransfected with a constant amount of cDNA corresponding to 5HT2B-Rluc and increasing amounts of cDNA corresponding to Gal1-YFP receptors. Second, we also used cells cotransfected with a constant amount of cDNA corresponding to D1-Rluc or D5-Rluc and increasing amounts of cDNA corresponding to CB1-YFP receptors. Only a small and linear BRET was detected (Fig. 1b), indicating that the saturable BRET between D1 or D5 and Gal1 represented a true complex.
Figure 1.

D1–Gal1 and D5–Gal1 receptor heteromers in living cells. a, Confocal microscopy images of cells expressing (top to bottom) D5-Rluc (0.6 μg plasmid) and Gal1-YFP (1 μg plasmid), Gal2-Rluc (0.5 μg plasmid) and D5-YFP receptors (1 μg plasmid), D1-Rluc (0.5 μg plasmid) and Gal1-YFP (1 μg plasmid), and Gal2-Rluc (0.5 μg plasmid) and D1-YFP (1.3 μg plasmid) receptors. Proteins were identified by fluorescence or by immunocytochemistry. D5-Rluc, D1-Rluc, or Gal2-Rluc receptor immunoreactivity is shown in red; Gal1-YFP, D5-YFP, or D1-YFP receptor fluorescence in shown in green; and colocalization is shown in yellow. Scale bars, 5 μm. b, BRET experiments were performed with cells coexpressing D5-Rluc (400 ng plasmid; red) or D1-Rluc (300 ng plasmid; blue) and Gal1-YFP receptors (0.4 to 7 μg plasmid), Gal2-Rluc (300 ng plasmid) and D5-YFP receptors (0.5 to 5 μg plasmid; green) or D1-YFP receptors (0.5 to 4 μg plasmid; purple), or, as negative controls, D5-Rluc (600 ng plasmid; gray) or D1-Rluc (500 ng plasmid; orange) and CB1-YFP receptors (0.5 to 7 μg plasmid) or 5HT2B-Rluc (1 μg plasmid) and Gal1-YFP receptors (0.5 to 5 μg plasmid) (black). Both fluorescence and luminescence of each sample were measured before every experiment to confirm similar donor expressions (about 150,000 luminescent units) while monitoring the increase acceptor expression (10,000–70,000 fluorescent units). The relative amount of BRET is given as the ratio between the fluorescence of the acceptor minus the fluorescence detected in cells expressing only the donor and the luciferase activity of the donor. BRET data are expressed as the mean ± SD of 4–16 different experiments grouped as a function of the amount of BRET acceptor. At the top, a scheme corresponding to a BRET assay is shown.
Since D1-like and Gal1 receptors can form heteromers, we sought to determine whether D1-likeand Gal2 receptors could also form heteromers. Using confocal microscopy, we confirmed expression, proper trafficking of receptors, and colocalization between D1-YFP and Gal2-Rluc receptors and between D5-YFP and Gal2-Rluc receptors (Fig. 1a). When we performed BRET experiments, however, we obtained a linear nonspecific BRET signal in cells expressing a constant amount of Gal2-Rluc and increasing amounts of D1-YFP or D5-YFP receptors (Fig. 1c), suggesting that the two pairs of receptors are not able to form heteromers. Therefore, the results indicate that D1-like receptors show a preference for forming receptor heteromers with Gal1 receptors.
D1 and D5 receptors compete for the same molecular determinants of Gal1 receptors
Previous studies have shown that the C termini of D1 and D5 receptors are selectively involved in the formation of heteromers with the ligand-gated ion channels of NMDA and GABAA receptors (Liu et al., 2000; Lee et al., 2002). We, therefore, reasoned that these same regions might interact with Gal1 receptors. We constructed plasmids expressing the C-terminal part of the D1 and D5 receptors fused to GST protein (GST-D1CT and GST-D5CT, respectively). We produced this protein in Escherichia coli and then added it to lysates from HEK-293T cells transfected with either Gal1-YFP or Gal2-YFP receptors. Using Sepharose beads coated with glutathione, we precipitated GST-D5CT. With analysis of fluorescence, we found that the GST-D5CT fusion protein, but not GST alone, pulled down Gal1-YFP receptors, but not Gal2-YFP receptors, as demonstrated by a significant increase in fluorescence in the samples from cells expressing Gal1-YFP, compared with samples from cells expressing YFP alone (Fig. 2a). When we tried the same experiments with GST-D1CT, we were unable to pull down Gal1-YFP or Gal2-YFP (Fig. 2b). In view of the very similar results obtained in BRET experiments with the selective heteromerization of both D1 and D5 receptors with Gal1 but not Gal2 receptors, these results suggest that additional regions outside of the C terminus play a role in forming heteromers and that there are differences between D1 and D5 receptors in the regions involved in heteromerization with Gal1 receptors. BRET competition experiments were then performed to determine whether Gal1 receptors use the same molecular determinants to heteromerize with D1 and D5 receptors. BRET was measured in cells coexpressing D1-Rluc and Gal1-YFP receptors (to give approximately BRETmax values) with increasing amounts of D5 receptors. The BRET signal decreased to very low values in the presence of increasing amounts of D5 receptors, with a complex dose–response competition curve (Fig. 3a). Because the D1–Gal1 heteromer is disrupted by adding D5 receptor, D1 and D5 receptors must share a similar interaction surface on the Gal1 protein. To further support this hypothesis, a BRET saturation curve was performed in cells transfected with a constant amount of cDNA for the D1-Rluc receptor, with increasing amounts of cDNA for the Gal1-YFP receptor and with a constant amount of cDNA for D5 receptors. Under these conditions, there was a very significant decrease in BRETmax values (23 ± 1 vs. 47 ± 4 mBU; p < 0.001), but not BRET50 values (9 ± 2 vs. 7 ± 2), compared to the BRET saturation curve in the absence of D5 receptors (Fig. 3b), strongly suggesting that D1 and D5 receptors compete for the same region of Gal1 receptors.
Figure 2.
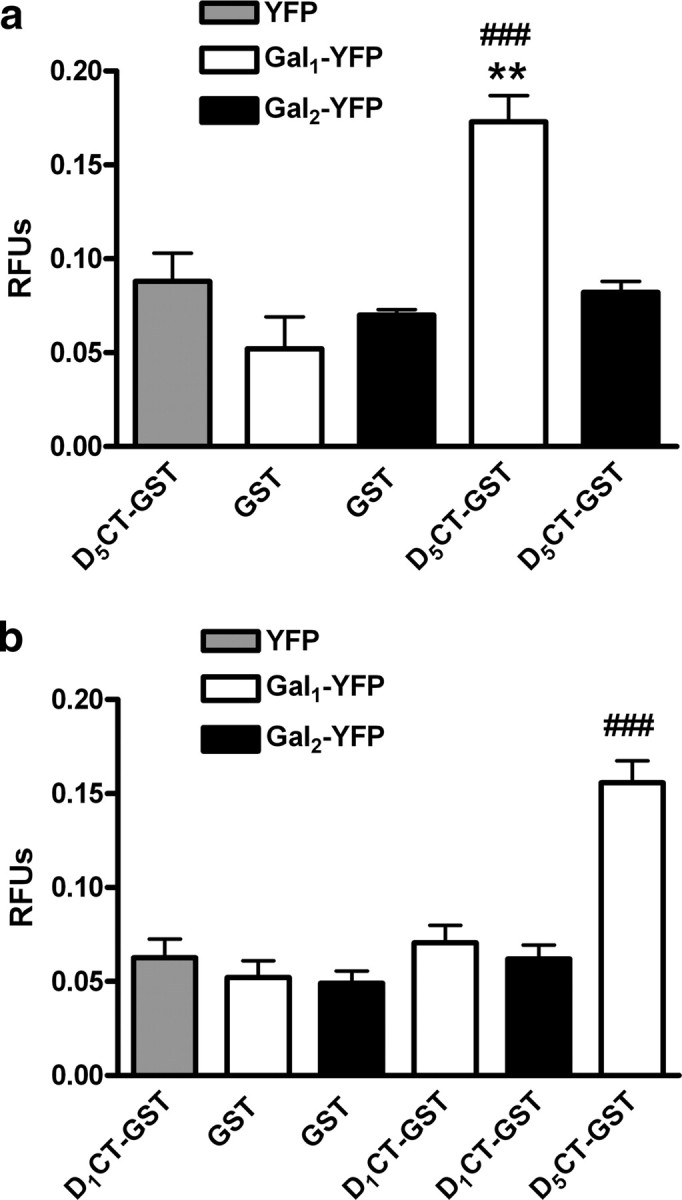
Role of the C-terminal domains of D1 and D5 receptors in heteromerization with Gal1 receptor. a, b, Extracts from cells transfected with either Gal1-YFP or Gal2-YFP receptors or just with YFP (see Materials and Methods) were incubated with GST-D5CT or with just GST (a) or GST-D1CT, GST-D5CT, or with just GST (b). The results of pull-down experiments (see Materials and Methods) were analyzed by measuring fluorescence. Results are expressed as the mean ± SEM (3 independent experiments with 3 replicates) of relative fluorescence units (RFUs); **p < 0.01 (significantly different compared to the pull down of YFP with GST-D5CT); ###p < 0.001 (significantly different compared to the pull down of Gal1-YFP with GST; repeated-measures ANOVA with Bonferroni's correction).
Figure 3.

D1 and D5 receptors compete for binding to Gal1 receptors. a, b, BRET experiments were performed with cells coexpressing D1-Rluc (300 ng plasmid) and Gal1-YFP receptors (4 μg plasmid) and increasing amounts of D5 receptors (0 to 5.5 μg plasmid) (a) or D1-Rluc (300 ng plasmid), Gal1-YFP (0.3 to 5 μg plasmid), and D5 receptors (1.5 μg plasmid) (b). In a, no significant variation in luminescence caused by D1-Rluc receptors (about 150,000 luminescent units) or fluorescence caused by Gal1-YFP receptors (about 10,000–70,000 fluorescent units) was observed by increasing D5 receptor expression. In b, similar luminescence attributable to D1-Rluc or fluorescence attributable to Gal1-YFP receptors was obtained in the absence or presence of D5 receptors. The relative amount of BRET is given as the ratio between the fluorescence of the acceptor minus the fluorescence detected in cells expressing only the donor and the luciferase activity of the donor. BRET data are expressed as the mean ± SD of 4–16 different experiments grouped as a function of the amount of BRET acceptor. The dashed curve represents BRET saturation curve obtained with the D1-Rluc receptor and increasing amounts of cDNA for the Gal1-YFP receptor in the absence of D5 receptors shown in Figure 1.
Functional characteristics of D1–Gal1 and D5–Gal1 receptor heteromers
To investigate whether D1-like receptors can modify Gal1 receptor function, and vice versa, we measured changes in ERK1/2 phosphorylation in the presence or absence of D1-like and Gal1 receptor agonists and/or antagonists. First, the D1-like receptor agonist SKF 81297 (50 nm) time-dependently induced ERK1/2 phosphorylation in cells expressing D1 or D5 receptors, whereas galanin (100 nm) time-dependently induced ERK1/2 phosphorylation in cells expressing Gal1 receptors (Fig. 4a). In cells expressing both D5 and Gal1 receptors (Fig. 4b,c) or D1 and Gal1 (Fig. 4d,e) receptors, SKF 81297-induced dose–response curves were not significantly modified by the presence of galanin (100 nm) (Fig. 4b,d). EC50 values in cells expressing both D5 and Gal1 receptors were 17 ± 2 nm and 23 ± 3 nm in the absence and presence of galanin, respectively (nonpaired t test, not significant; n = 5 in both groups). In cells expressing both D1 and Gal1 receptors, EC50 values were 7 ± 1 nm and 11 ± 1 nm in the absence and presence of galanin, respectively (nonpaired t test, not significant; n = 5 in both groups). On the other hand, galanin-induced dose–response curves were significantly shifted to the left in the presence of SKF 81297 (50 nm) (Fig. 4c,e). EC50 values were 17.1 ± 0.7 nm in the absence of SKF 81297 and 4.8 ± 0.6 nm in the presence of SKF 81297 in cells expressing both D5 and Gal1 receptors (nonpaired t test, p < 0.001; n = 4 in both groups). EC50 values in cells expressing both D1 and Gal1 receptors were 21 ± 2 nm in the absence of SKF 81297 and 6 ± 1 nm in the presence of SKF 81297 (nonpaired t test, p < 0.001; n = 4 in both groups). These results demonstrate that D1-like receptor agonist activation facilitates Gal1 receptor-mediated MAPK signaling, whereas the reverse is not true, since no significant functional effects were observed in the SKF 81297-induced dose–response curves with galanin. Importantly, in cells expressing both D1 and Gal2 receptors or D5 and Gal2 receptors, galanin-induced dose–response curves were not significantly modified by the presence of SKF 81297 (Fig. 5), suggesting that the enhancement of Gal1 receptor-mediated MAPK signaling by D1-like receptor agonist activation is a biochemical property of D1–Gal1 and D5–Gal1 receptor heteromers.
Figure 4.

Cross talk between D1-like receptors and Gal1 receptors on ERK1/2 phosphorylation in transfected cells. a, Cells transfected with the cDNA corresponding to D5 (1.5 μg, black), D1 (1.2 μg, white), or Gal1 (2 μg, gray) receptors were stimulated for the indicated times with 50 nm (black) or 70 nm (white) of the D1-like receptor agonist SKF 81297 or with 100 nm galanin (gray). ERK1/2 phosphorylation was determined as indicated in Materials and Methods. The immunoreactive bands from three to five experiments were quantified and the values represent the mean ± SEM of the percentage of phosphorylation relative to the basal levels found in untreated cells; *p < 0.05; ***p < 0.001 (significantly different compared to the results obtained after 1 min of agonist exposure; one-way ANOVA with Bonferroni's correction). b–e, Cells cotransfected with the cDNA corresponding to D5 (1.3 μg) and Gal1 (1.8 μg) receptors (b, c) or D1 (1 μg) and Gal1 (1.8 μg) receptors (d, e) were treated for 5 min with the indicated concentrations of the D1-like receptor agonist SKF 81297 in the absence (circles) or in the presence (triangles) of 100 nm galanin (b, d) or with the indicated concentrations of galanin in absence (circles) or presence (triangles) of 50 nm (c) or 70 nm SKF 81297 (d). The immunoreactive bands from four independent experiments were quantified and the values represent the mean ± SEM of phosphorylation (arbitrary units) minus the basal levels found in SKF 81297- (b, d) or galanin-untreated (c, e) cells.
Figure 5.

Lack of cross talk between D1-like receptors and Gal2 receptors on ERK1/2 phosphorylation in transfected cells. a, b, Cells were cotransfected with the cDNA corresponding to D5 (1.5 μg) and Gal2 (2 μg) receptors (a) or to D1 (1 μg) and Gal2 (2 μg) receptors (b). Cells were treated for 5 min with the indicated concentrations of galanin in the absence (circles) or in the presence (triangles) of 50 nm (a) or 70 nm (b) of SKF 81297. The immunoreactive bands from four independent experiments were quantified and the values represent the mean ± SEM of phosphorylation (arbitrary units) minus the basal levels found in untreated cells.
Next, we examined the effect of heteromer formation on antagonist-modulation of agonist-induced ERK1/2 phosphorylation. The D1-like receptor antagonist SCH 23390 (10 μm) was able to block ERK1/2 phosphorylation caused by SKF 81297 in cells expressing D1 or D5 receptors, whereas the putative nonselective galanin receptor antagonist M40 (10 μm) blocked galanin-induced ERK1/2 phosphorylation in cells expressing Gal1 receptors (Fig. 6a). It is important to mention that M40, as well as other galanin-like peptides, has been shown to act as full agonists in some cell lines, although they are clearly antagonists in vivo (Lang et al., 2007). In our hands, M40 behaved as a galanin receptor antagonist, as evidenced by the complete reversion of galanin-induced signaling. In addition, we established that in cells expressing only D1 or D5 receptors, signaling induced by the D1-like receptor agonist SKF 81297 was not modified by the presence of M40, and in cells expressing only Gal1, signaling induced by galanin was not altered by addition of SCH 23390 (Fig. 6a). In cells coexpressing both D5 and Gal1 receptors (Fig. 6b) or both D1 and Gal1 receptors (Fig. 6c), D1-like receptor-mediated ERK1/2 phosphorylation could be blocked by SCH 23390 but not by M40. However, galanin-induced ERK1/2 phosphorylation was counteracted by both M40 and SCH 23390 (Fig. 6b,c). This is a clear example of unidirectional cross-antagonism in a receptor heteromer (Carriba et al., 2007; Ferrada et al., 2009; Navarro et al., 2010). Since, by definition, an antagonist is not able to induce intracellular signaling, the more straightforward way to explain the effect of D1-like receptor antagonist on Gal1 receptor activation is through a direct protein-protein interaction between both receptors.
Figure 6.

D1-like receptor antagonist-mediated blockade of galanin-induced ERK1/2 phosphorylation in cells expressing D1-like and Gal1 receptors. a, Cells were transfected with the cDNA corresponding to D5 (1.5 μg, black), D1 (1.2 μg, white) or Gal1 receptors (2 μg, gray) and were stimulated with the D1-like receptor agonist SKF 81297 (70 nm) or with galanin (100 nm) in the presence or absence of the D1-like receptor antagonist SCH 23390 (10 μm) or the Gal1 receptor antagonist M40 (10 μm); ***p < 0.001 [significantly different compared to the effect of SKF 81297 alone (black and white columns) or to the effect of galanin alone (gray columns); one-way ANOVA with Bonferroni's correction]. b, c, Cells cotransfected with the cDNA corresponding to D5 (1.3 μg) and Gal1 receptors (1.8 μg) (b) or to D1 (1 μg) and Gal1 (1.8 μg) receptors (c) were treated with SCH 23390 (10 μm), M40 (10 μm), SKF 81297 (70 nm), or galanin (100 nm) alone or in combination; ***p < 0.001 [significantly different compared to the effect of SKF 81297 alone (in cells treated with SKF 81297) or to the effect of galanin alone (in cells treated with galanin); one-way ANOVA with Bonferroni's correction]. In all cases, cells were treated for 5 min with the indicated concentrations of agonists and 20 min before the addition of agonists with the indicated concentrations of antagonists. The inmunoreactive bands from four to five experiments were quantified, and the values represent the mean ± SEM of the percentage of phosphorylation relative to the basal levels found in untreated cells (100%).
D1-like–Gal1 receptor heteromers are expressed in the rat ventral hippocampus
In view of the cross-antagonism clearly observed in the transfected cells, we decided to use a similar approach to seek biochemical evidence (“biochemical fingerprint”) for the existence of D1-like–Gal1 receptor heteromers in the brain (Ferré et al., 2009). Therefore, to test whether D1–Gal1 or D5–Gal1 receptor heteromers exist in the brain, we isolated rat ventral and dorsal hippocampal slices and compared the ability of the D1-like receptor antagonist SCH 23390 to block the effect of galanin on ERK1/2 phosphorylation. Slices were incubated with galanin in the absence or in the presence of either SCH 23390 or the galanin receptor antagonist M40. In the ventral hippocampus, the results reproduced the cross-antagonism found in transfected cells (Fig. 7). ERK1/2 phosphorylation induced by galanin (300 nm) was not blocked only by M40 (10 μm), but also by SCH23390 (10 μm). In contrast, in dorsal hippocampus slices, SCH23390 (10 μm) failed to antagonize the effect of galanin (Fig. 7). These results provide strong evidence for the existence of D1-like–Gal1 receptor heteromers in the ventral hippocampus.
Figure 7.

D1-like receptor antagonist-mediated blockade of galanin-induced ERK1/2 phosphorylation in rat hippocampal slices. Slices from dorsal (black) or ventral (white) hippocampus were treated for 10 min with medium, SCH 23390 (10 μm), or M40 (10 μm) before the addition of galanin (300 nm) and an additional incubation period of 10 min. The inmunoreactive bands from four slices from two different animals were quantified and the values represent the mean ± SEM of the percentage of phosphorylation relative to the basal levels found in untreated slices (100%). *p < 0.05; **p < 0.01 (significantly different compared to the effect of galanin alone; one-way ANOVA with Bonferroni's correction).
The role of D1-like and Gal1 receptor coactivation on K+-induced [3H]ACh release in synaptosomes from rat ventral hippocampus
Having established that D1-like–Gal1 receptor heteromers occur in the ventral hippocampus, we looked for their functional role by first analyzing the effect of a D1-like agonist and galanin on K+-induced [3H]ACh release in isolated synaptosomes from rat ventral hippocampus. The D1-like receptor agonists SKF 81297 and SKF 38393 have a similar affinity for D1 and D5 receptors. The major difference between the two agonists is a significantly higher selectivity for D1 versus dopamine D2 receptors and D1 versus serotonin 5-HT2A receptors of SKF 38393 compared to SKF 81297 (Seeman and Van Tol, 1994; Neumeyer et al., 2003). Since selectivity was a major concern when dealing with hippocampal tissue, we decided to shift to SKF 38393 as the D1-like receptor agonist in the studies of ACh release in synaptosomes and the electrophysiological studies in slices. Neither galanin, at low nanomolar concentrations (30–100 nm) in the range used by Wang et al. (1999) in rat cortical slices and cortical synaptosomal preparations, nor the D1-like receptor agonist SKF 38393 (20–100 nm) significantly (p > 0.05; n = 3–6) affected K+-induced ACh release, as assessed by modifications of the S2/S1 ratio after addition of the agonists before S2. However, prior addition of SKF 38393 (20 nm; added before S1 and being present during S1 and S2) triggered an excitatory effect (p < 0.05; n = 6) of galanin (30 nm; only added before S2) on evoked ACh release (Fig. 8a). On the other hand, no significant functional effects where observed with the reverse protocol, since adding galanin (30 nm) before S1 did not influence the absence of effect of SKF 38393 (20 nm, only added before S2) (Fig. 8b). These results nicely correlate with the functional results obtained in cells expressing D1 or D5 and Gal1 receptors, showing the selective enhancement of Gal1 but not Gal2 receptor-mediated MAPK signaling by a D1-like receptor agonist. Therefore, the results strongly suggest that D1–Gal1 or D5–Gal1 receptor heteromers are present in ventral hippocampal cholinergic terminals where they modulate ACh release.
Figure 8.

Effect of a D1-like receptor agonist and galanin on K+-induced [3H]ACh release from ventral hippocampal synaptosomes. a, Dopamine receptors were activated (right column) by preincubation with the agonist SKF 38393 before addition of galanin. b, Galanin receptors were activated (right column) by preincubation with galanin before addition of SKF 38393. Ordinates represent the S2/S1 ratios as percentage of the control value in the same experiments (see Materials and Methods). Drug conditions during S1 and S2 are indicated below each bar. In the ordinates, 100% represents the S2/S1 ratio in the absence of the test drug, i.e., in the absence of galanin (a) or in the absence of SKF 38393 (b), using the same synaptosomal batch. An S2/S1 ratio close to 100% represents, therefore, absence of effect of the test drug (galanin in a or SKF 38393 in b). Values are mean ± SEM (n = 3–6). In a, 100% corresponds to 0.76 ± 0.046, and in b it corresponds to 0.70 ± 0.029. The presence of SKF 38393 (a) or of galanin (b) during S1 and S2 did not significantly affect S2/S1 ratios compared with those obtained in the absence of any drug. *p < 0.05; NS, p > 0.05 (Student's t test).
The role of D1-like and Gal1 receptor coactivation on rat ventral hippocampus synaptic transmission
To identify whether D1-like–Gal1 receptor interactions affect excitatory synaptic transmission in the hippocampus, we evaluated the effect of galanin on EPSPs in hippocampal slices (Fig. 9a) in the absence or presence of the dopaminergic receptor agonist SKF 38393. As illustrated in Figure 9, b and e, when galanin (30 nm) was applied alone to ventral hippocampal slices, there was a statistically significant (p < 0.05; n = 9) inhibition (21 ± 2.6%) of the slope of fEPSP. On the other hand, SKF 38393 (20 nm) was virtually devoid of effect (n = 7) on the slope of fEPSP (Fig. 9c,e). However, in the presence of SKF 38393, the effect of galanin was reversed and it produced a significant increase of 15.4 ± 2.4% (p < 0.05; n = 8) in the slope of fEPSPs (Fig. 9d,f). These results indicate a synergistic effect when both D1-like and Gal1 receptors are costimulated by agonists and match those results obtained in synaptosomal preparations when measuring ACh release and those results obtained in transfected cells and in ventral hippocampal slices while measuring EPK phosphorylation. Moreover, blockade of D1-like receptors with SCH 23390 (1 μm; added 30 min before SKF 38393) completely counteracted the effect of SKF 38393 (Fig. 9d,f). Indeed, in the presence of SCH 23390 (1 μm) and SKF 38393 (20 nm), galanin (30 nm) decreased (p < 0.05; n = 6) the slope of fEPSPs by 21.2 ± 3.4% (Fig. 9d), an effect similar to that observed when galanin was applied to the slices alone (Fig. 9b,f).
Figure 9.

Effect of coactivation of D1-like and galanin receptors on galanin-mediated modulation of synaptic transmission in the ventral hippocampus. a, Schematic representation of a transverse hippocampal slice with the electrode configuration used to record fEPSPs in the CA1 apical dendritic layer (stratum radiatum) evoked by electric stimulation (S0) of the Schaffer fibers. b, Averaged time courses of changes in fEPSP slope induced by application of 30 nm galanin alone. c, Averaged time course of changes in fEPSP slope induced by application of 20 nm SKF 38393 alone. d, Averaged time courses of the effect of galanin (30 nm) in the presence of the D1-like receptor agonist SKF 38393 (20 nm; ●) or in the presence of both SKF 38393 (10 nm) and the D1-like receptor antagonist SCH23390 (1 μm; ○). SKF 38393 was applied at least 30 min before galanin application, and SCH 23390 was applied 30 min before SKF 38393 application. e, Recordings obtained from representative experiments, where each trace is the average of eight consecutive responses obtained in absence (1) and presence (2) of galanin (30 nm; left), in absence (3) and presence (4) of SKF 38393 (20 nm; middle), and in absence (5) and presence (6) of galanin (30 nm) when the slice was incubated with SKF 38393 (20 nm; right) are shown D1-like; each trace is composed of the stimulus artifact followed by the presynaptic volley and the fEPSP. Superimposed recordings were obtained from the same slice at the time points indicated in b–d. Note the inhibitory effect of galanin in b (absence of SKF 38393) and facilitatory effect in d (presence of SKF 38393). f, Comparison between the averaged effects of galanin on hippocampal synaptic transmission in presence of SKF 38393 and in the presence of both SKF 38393 and SCH 23390. The ordinates show the percent change of fEPSP slope induced by galanin (30 nm) 50–60 min after its application to hippocampal slices not treated or treated with SKF 38393 and treated with both SKF 38393 and SCH 23390, as indicated below each bar. θ, p < 0.05 (one-way ANOVA with Bonferroni's correction) as compared with absence of galanin in the same slices; ϕ, p < 0.05 (one-way ANOVA with the Bonferroni's correction) as compared with galanin alone. All values are mean ± SEM [100%, averaged fEPSP slopes at times −10 to 0: d, −0.69 ± 0.073 mV/ms, n = 8 (●); −0.66 ± 0.103 mV/ms, n = 6 (○); b, −0.69 ± 0.023 mV/ms, n = 9; c, −0.64 ± 0.041 mV/ms, n = 7].
Based on our results on the modulation of ACh release from isolated nerve terminals (see Fig. 8) and previous evidence that dopamine and galanin receptors regulate septohippocampal cholinergic neurotransmission, we hypothesized that the cross talk between galanin and dopamine receptors involved in the modulation of hippocampal excitatory transmission resulted from modulation of cholinergic neurotransmission. To test this hypothesis, we used the muscarinic cholinergic receptor antagonist atropine (5 μm), which by itself did not significantly modify fEPSP when applied to ventral hippocampal slices (Fig. 10b). The application of SKF 38393 (20 nm) after previous application (at least 30 min before) of atropine also did not significantly affect synaptic transmission (Fig. 10b). However, when galanin was added, a significant inhibition (p < 0.05; n = 6) of the slope of fEPSP was observed (Fig. 10a,b). This inhibition (21 ± 5%) was similar to the inhibition obtained when galanin was applied in the absence of any drug (18 ± 0.9%) (Fig. 8a,d), demonstrating a cholinergic-independent depressant effect of galanin, but a cholinergic-dependent facilitatory action of galanin that requires D1-like receptor activation. These results suggest that D1-like–Gal1 receptor heteromers localized in cholinergic terminals influence excitatory synaptic transmission in the ventral hippocampus. Finally, we performed fEPSP measurements using slices of dorsal hippocampus. Application of galanin (30 nm) to dorsal hippocampal slices had no significant effect on fEPSP slope (Fig. 11a). Application of SKF 38393 (20 nm) was also devoid of any effect on fEPSP slope (Fig. 11b). Furthermore, previous addition of SKF 38393 (20 nm; 30 min before) did not trigger any effect of galanin on fEPSPs (Fig. 11c,d). These results agree with the selective existence of D1-like–Gal1 receptor interactions in the ventral versus the dorsal hippocampus, as indicated by the ERK1/2 phosphorylation experiments in hippocampal slices.
Figure 10.

Effect of muscarinic receptor blockade on the dopamine-dependent galanin-mediated modulation of synaptic transmission in the ventral hippocampus. a, Top, Averaged time courses of the effect of galanin (30 nm) in the presence of both the D1-like receptor agonist SKF 38393 (20 nm) and the muscarinic acetylcholine receptor antagonist atropine (5 μm). SKF 38393 was applied at least 60 min before galanin, and atropine was applied 30 min before SKF 38393. Bottom, Traces obtained with a representative experiment; each trace is the average of eight consecutive responses obtained immediately before (1) and during (2) galanin application, and is composed of the stimulus artifact followed by the presynaptic volley and the fEPSP. b, Comparison between the averaged effects of galanin (30 nm for 50–60 min) in the absence of drugs and in the presence of both SKF 38393 and atropine. The averaged effects of atropine and both atropine and SKF 38393 are also shown; θ, p < 0.05 (Student's t test) compared with absence of galanin in the same slices; ϕ, p < 0.05 (Student's t test) compared with both atropine and SKF 38393 present in the same slices. All values are shown as the mean ± SEM (100%, averaged fEPSP slopes at times −10–0: a, −0.60 ± 0.037 mV/ms; n = 6).
Figure 11.

Lack of effect of galanin on synaptic transmission in the dorsal hippocampus. a, b, Averaged time course of changes in fEPSP slope induced by application of 30 nm galanin (a) or 20 mm SKF 38393 (b). c, Averaged time courses of the effect of galanin (30 nm) in the presence of the D1-like receptor agonist SKF 38393 (20 nm). SKF 38393 was applied at least 30 min before galanin; ordinates show the percent change of fEPSP slope induced by galanin (30 nm) 50–60 min after its application to hippocampal slices not treated and treated with SKF 38393, as indicated below each bar. All values are shown as the mean ± SEM (100%, averaged fEPSP slopes at times −10–0: a, −0.55 ± 0.070 mV/ms, n = 5; b, −0.58 ± 0.048 mV/ms, n = 3; c, −0.55 ± 0.064 mV/ms, n = 3). d, Comparison between the averaged effects of galanin in the presence and absence of SKF 38393.
Discussion
By using a multidisciplinary approach, we provide several important mechanistic and functional insights into the role of galanin and dopamine on regulation of ACh release in the hippocampus. We show, for the first time, that dopamine D1-like receptors form heteromers with Gal1 but not Gal2 receptors in transfected cells and in rat ventral hippocampus. Within the D1–Gal1 and D5–Gal1 receptor heteromers, dopamine receptor activation and blockade potentiate and counteract, respectively, MAPK activation induced by stimulation of Gal1 receptors, whereas Gal1 receptor ligands do not modify D1-like receptor-mediated MAPK activation. We also demonstrate that dopamine and galanin work in concert to modulate cholinergic neurotransmission in the ventral hippocampus and that this modulation could occur via heteromers between D1 or D5 receptors and Gal1 receptors.
Using an in vitro cell culture system, we demonstrated by BRET the ability of both D1 and D5 receptors to form heteromers with Gal1 but not Gal2 receptors. This is not surprising if we consider that these two galanin receptors have relatively low amino acid similarity (Branchek et al., 2000). Although both D1 and D5 receptors were able to compete for their heteromerization with the Gal1 receptor, only the C terminus of the D5 receptor pulled down the whole Gal1 receptor from membrane preparations of transfected cells. On the one hand, these results suggest that additional regions outside of the C terminus play a role in forming heteromers and that there are differences between D5 and D1 receptors in the regions involved in heteromerization with Gal1 receptors. On the other hand, our results strongly suggest that D1 and D5 receptors compete for the same region of Gal1 receptors.
One of the main challenges in the study of membrane protein complexes is their identification in native tissues. Solubility issues and unreliable antibodies make coimmunoprecipitation experiments difficult to interpret, and current spectroscopic approaches, with few exceptions, lack the resolution for an in situ approach at the single-molecule level. These limitations thus require indirect approaches to validate the presence of such membrane complexes, such as the determination of a biochemical property of the receptor heteromer, which can be used as a “biochemical fingerprint” (Ferré et al., 2009). The cross-antagonism in which a D1-like receptor antagonist is able to block the effect of a Gal1 receptor agonist is very difficult to explain by a mechanism not involving receptor heteromerization, taking into account that an antagonist does not induce intracellular signaling. This cross-antagonism was therefore used as a “biochemical fingerprint” of the D1-like–Gal1 receptor heteromer. Using these criteria and measuring MAPK activation as an endpoint, we were able to identify D1-like–Gal1 receptor heteromers in the ventral, but not the dorsal, hippocampus.
Although the existence of Gal1 receptors on septohippocampal cholinergic neurons has been questioned previously (Miller et al., 1997), our observations of the same qualitative cross talk in signaling in synaptosomal preparations as in cells expressing D1-like and Gal1 receptors strongly suggests that functional Gal1 receptors are present in cholinergic terminals of the ventral hippocampus. As mentioned above, in transfected cells, D1-like receptor stimulation potentiates the effects of Gal1 but not Gal2 receptor activation, but Gal1 receptor stimulation does not modify D1-like receptor-mediated signaling. In hippocampal synaptosomal preparations at nanomolar concentrations, neither galanin nor a D1-like receptor agonist produced any modification of K+-induced ACh release. Nevertheless, previous activation of D1-like receptors triggered a facilitatory effect of galanin. Also as in transfected cells, galanin did not modify the lack of effect of a D1-like receptor agonist. Since D5 predominates over D1 receptors in the hippocampus (Ciliax et al., 2000), and D5 receptors have been shown previously to be involved in the modulation of hippocampal ACh release (Hersi et al., 2000; Laplante et al., 2004b), D5 is probably the main D1-like receptor subtype forming heteromers with Gal1 receptors in cholinergic terminals of the ventral hippocampus.
In previous studies, galanin generally showed an inhibitory effect on hippocampal cholinergic neurotransmission (Fisone et al., 1987; Ögren et al., 1998; Laplante et al., 2004a). However, most of these studies were performed with in vivo microdialysis techniques using much higher (micromolar) concentrations of galanin than in the present experiments (Ögren et al., 1998; Laplante et al., 2004a) and with artificially increased extracellular concentrations of ACh because of the addition of acetylcholinesterase inhibitors in the perfusion medium. The use of acetylcholinesterase inhibitors in the dialysis medium has raised concerns about the possibility of not only quantitative but also qualitative artifactual results (DeBoer and Abercrombie, 1996; Acquas and Fibiger, 1998). At the level of the Shaffer–CA1 glutamatergic synapses of the ventral hippocampus, a low (nanomolar) concentration of galanin was inhibitory providing that dopamine receptors were not activated. This result is in accordance with the expression of Gal1 receptors in the CA1 area of the ventral hippocampus (O'Donnell et al., 1999). In fact, we found galanin to be completely ineffective in the dorsal hippocampus. This cholinergic-independent depressant effect of galanin could be related to its ability to decrease neuronal hippocampal glutamatergic neurotransmission (Zini et al., 1993; Mazarati et al., 2000). Also, galanin has been reported to inhibit LTP in the Shaffer–CA1 glutamatergic synapses (Sakurai et al., 1996). The D1-like receptor agonist, which was ineffective when administered alone, turned an inhibitory effect of galanin into an excitatory effect, and this interaction depended on cholinergic neurotransmission, since it was completely blocked by a muscarinic ACh receptor antagonist. From our results from ventral hippocampal synaptosomal preparations and slices, a model of the role of galanin in the Shaffer–CA1 synapses of the ventral hippocampus can be proposed: an isolated increase in the activity of the septohippocampal cholinergic input produces a modest release of ACh and galanin. This modest release of galanin would, nevertheless, be sufficient to inhibit the excitability of glutamatergic synapses by acting on presynaptic or postsynaptic galanin receptors. However, with a concomitant increase in the activity of the ventral tegmental area (VTA)–hippocampal dopaminergic input, coactivation of D1-like and galanin receptors localized in cholinergic terminals induces a strong release of ACh, which overcomes the inhibitory role of galanin and leads to increased excitability of the glutamatergic synapses.
The interactions reported here occur in the ventral but not in the dorsal hippocampus. These two hippocampal areas have differential efferent connections with the rest of the brain, such that the dorsal hippocampus is primarily connected with the neocortex, whereas the ventral hippocampus is connected to subcortical structures, such as the hypothalamus and the amygdala (Naber and Witter, 1998). Since both the amygdala and the hypothalamus control the activity of the hypothalamus–pituitary–adrenal axis, it is therefore not a surprise that a major function of the ventral hippocampus is the processing of information related to emotion-related behaviors, as increasing evidence now indicates (Segal et al., 2010). Interestingly, injection of acetylcholine into the ventral, but not the dorsal, hippocampus, reduces anxiety (Degroot and Treit, 2004). One can therefore speculate that the cholinergic-dependent facilitatory action of galanin on excitatory Schaffer–CA1 synapses (a last relay of the excitatory output of the hippocampus) may influence the control of anxiety and emotional memory.
Altogether, our results strongly suggest that D1-like–Gal1 receptor heteromers that are localized in cholinergic nerve terminals play an important role in the modulation of cholinergic neurotransmission in the ventral hippocampus. Receptor heteromers are becoming the focus of extensive research in the field of GPCRs, and we are just starting to understand the mechanisms involved in heteromerization and its functional meaning (Bulenger et al., 2005; Ferré et al., 2007; Dalrymple et al., 2008; Milligan, 2009; Rozenfeld and Devi, 2010). The present study provides a clear example of a receptor heteromer acting as a processor that integrates signals of different neurotransmitters and modulates cell signaling and neuronal function (Ferré et al., 2007). Since receptor heteromers are increasingly being considered as pharmacological targets (George et al., 2002; Ferré et al., 2010), D1–Gal1 and D5–Gal1 receptor heteromers could be considered targets for drugs useful in Alzheimer's disease, in view of the involvement of the septohippocampal cholinergic system in this disease (Ögren et al., 1998; Mitsukawa et al., 2008). Importantly, D1, D5, and Gal1 receptors are also colocalized in brain areas other than the hippocampus, such as the mesencephalic dopaminergic nuclei substantia nigra and the VTA (Schilström et al., 2006; Picciotto, 2008). If D1-like–Gal1 receptor heteromers are also present in the mesencephalic dopaminergic cells, they could be targets for the treatment of dopamine-related neuropsychiatric disorders, including drug addiction. Finally, the ability of galanin receptors to heteromerize with other GPCRs in other regions of the CNS could explain pharmacological findings that have so far been difficult to explain, such as the well-known biphasic dose-dependent effect of galanin on nociception (Xu et al., 2008).
Footnotes
This work was supported by the Spanish Ministerio de Ciencia y Tecnología (Grants SAF2008-03229-E, SAF2009-07276 and SAF2010-18472), the intramural funds of the National Institute on Drug Abuse, EU (Cost B-30 concerted action), and Fundação para a Ciência e Tecnologia (FCT, Portugal). S.H.V. is in receipt of a FCT PhD fellowship (SFRHBD/27989/2006). P.J.M. is a Ramon y Cajal Investigator. We acknowledge the technical help obtained from Jasmina Jiménez (Molecular Neurobiology laboratory, Barcelona University, Barcelona).
The authors declare no competing financial interests.
References
- Acquas E, Fibiger HC. Dopaminergic regulation of striatal acetylcholine release: the critical role of acetylcholinesterase inhibition. J Neurochem. 1998;70:1088–1093. doi: 10.1046/j.1471-4159.1998.70031088.x. [DOI] [PubMed] [Google Scholar]
- Anderson WW, Collingridge GL. The LTP Program: a data acquisition program for on-line analysis of long-term potentiation and other synaptic events. J Neurosci Methods. 2001;108:71–83. doi: 10.1016/s0165-0270(01)00374-0. [DOI] [PubMed] [Google Scholar]
- Branchek TA, Smith KE, Gerald C, Walker MW. Galanin receptor subtypes. Trends Pharmacol Sci. 2000;21:109–117. doi: 10.1016/s0165-6147(00)01446-2. [DOI] [PubMed] [Google Scholar]
- Bulenger S, Marullo S, Bouvier M. Emerging role of homo- and heterodimerization in G-protein-coupled receptor biosynthesis and maturation. Trends Pharmacol Sci. 2005;26:131–137. doi: 10.1016/j.tips.2005.01.004. [DOI] [PubMed] [Google Scholar]
- Carriba P, Ortiz O, Patkar K, Justinova Z, Stroik J, Themann A, Müller C, Woods AS, Hope BT, Ciruela F, Casadó V, Canela EI, Lluis C, Goldberg SR, Moratalla R, Franco R, Ferré S. Striatal adenosine A2A and cannabinoid CB1 receptors form functional heteromeric complexes that mediate the motor effects of cannabinoids. Neuropsychopharmacology. 2007;32:2249–2259. doi: 10.1038/sj.npp.1301375. [DOI] [PubMed] [Google Scholar]
- Ciliax BJ, Nash N, Heilman C, Sunahara R, Hartney A, Tiberi M, Rye DB, Caron MG, Niznik HB, Levey AI. Dopamine D(5) receptor immunolocalization in rat and monkey brain. Synapse. 2000;37:125–145. doi: 10.1002/1098-2396(200008)37:2<125::AID-SYN7>3.0.CO;2-7. [DOI] [PubMed] [Google Scholar]
- Counts SE, Perez SE, Mufson EJ. Galanin in Alzheimer's disease: neuroinhibitory or neuroprotective? Cell Mol Life Sci. 2008;65:1842–1853. doi: 10.1007/s00018-008-8159-2. [DOI] [PMC free article] [PubMed] [Google Scholar]
- Crawley JN. Minireview. Galanin-acetylcholine interactions: relevance to memory and Alzheimer's disease. Life Sci. 1996;58:2185–2199. doi: 10.1016/0024-3205(96)00093-8. [DOI] [PubMed] [Google Scholar]
- Dalrymple MB, Pfleger KD, Eidne KA. G protein-coupled receptor dimers: functional consequences, disease states and drug targets. Pharmacol Ther. 2008;118:359–371. doi: 10.1016/j.pharmthera.2008.03.004. [DOI] [PubMed] [Google Scholar]
- DeBoer P, Abercrombie ED. Physiological release of striatal acetylcholine in vivo: modulation by D1 and D2 dopamine receptor subtypes. J Pharmacol Exp Ther. 1996;277:775–783. [PubMed] [Google Scholar]
- Degroot A, Treit D. Anxiety is functionally segregated within the septo-hippocampal system. Brain Res. 2004;1001:60–71. doi: 10.1016/j.brainres.2003.10.065. [DOI] [PubMed] [Google Scholar]
- Diógenes MJ, Fernandes CC, Sebastião AM, Ribeiro JA. Activation of adenosine A2A receptor facilitates brain-derived neurotrophic factor modulation of synaptic transmission in hippocampal slices. J Neurosci. 2004;24:2905–2913. doi: 10.1523/JNEUROSCI.4454-03.2004. [DOI] [PMC free article] [PubMed] [Google Scholar]
- Ferrada C, Moreno E, Casadó V, Bongers G, Cortés A, Mallol J, Canela EI, Leurs R, Ferré S, Lluís C, Franco R. Marked changes in signal transduction upon heteromerization of dopamine D1 and histamine H3 receptors. Br J Pharmacol. 2009;157:64–75. doi: 10.1111/j.1476-5381.2009.00152.x. [DOI] [PMC free article] [PubMed] [Google Scholar]
- Ferré S, Ciruela F, Woods AS, Lluis C, Franco R. Functional relevance of neurotransmitter receptor heteromers in the central nervous system. Trends Neurosci. 2007;30:440–446. doi: 10.1016/j.tins.2007.07.001. [DOI] [PubMed] [Google Scholar]
- Ferré S, Baler R, Bouvier M, Caron MG, Devi LA, Durroux T, Fuxe K, George SR, Javitch JA, Lohse MJ, Mackie K, Milligan G, Pfleger KD, Pin JP, Volkow ND, Waldhoer M, Woods AS, Franco R. Building a new conceptual framework for receptor heteromers. Nat Chem Biol. 2009;5:131–134. doi: 10.1038/nchembio0309-131. [DOI] [PMC free article] [PubMed] [Google Scholar]
- Ferré S, Navarro G, Casadó V, Cortés A, Mallol J, Canela EI, Lluís C, Franco R. G protein-coupled receptor heteromers as new targets for drug development. Prog Mol Biol Transl Sci. 2010;91:41–52. doi: 10.1016/S1877-1173(10)91002-8. [DOI] [PMC free article] [PubMed] [Google Scholar]
- Fisone G, Wu CF, Consolo S, Nordström O, Brynne N, Bartfai T, Melander T, Hökfelt T. Galanin inhibits acetylcholine release in the ventral hippocampus of the rat: histochemical, autoradiographic, in vivo, and in vitro studies. Proc Natl Acad Sci U S A. 1987;84:7339–7343. doi: 10.1073/pnas.84.20.7339. [DOI] [PMC free article] [PubMed] [Google Scholar]
- George SR, O'Dowd BF, Lee SP. G-protein-coupled receptor oligomerization and its potential for drug discovery. Nat Rev Drug Discov. 2002;1:808–820. doi: 10.1038/nrd913. [DOI] [PubMed] [Google Scholar]
- Hawes JJ, Picciotto MR. Characterization of GalR1, GalR2, and GalR3 immunoreactivity in catecholaminergic nuclei of the mouse brain. J Comp Neurol 2004. 2005;479:410–423. doi: 10.1002/cne.20329. Erratum in: J Comp Neurol 2005 490:98–100. [DOI] [PubMed] [Google Scholar]
- Hersi AI, Richard JW, Gaudreau P, Quirion R. Local modulation of hippocampal acetylcholine release by dopamine D1 receptors: a combined receptor autoradiography and in vivo dialysis study. J Neurosci. 1995;15:7150–7157. doi: 10.1523/JNEUROSCI.15-11-07150.1995. [DOI] [PMC free article] [PubMed] [Google Scholar]
- Hersi AI, Kitaichi K, Srivastava LK, Gaudreau P, Quirion R. Dopamine D-5 receptor modulates hippocampal acetylcholine release. Mol Brain Res. 2000;76:336–340. doi: 10.1016/s0169-328x(00)00015-2. [DOI] [PubMed] [Google Scholar]
- Hökfelt T, Xu ZQ, Shi TJ, Holmberg K, Zhang X. Galanin in ascending systems. Focus on coexistence with 5-hydroxytryptamine and noradrenaline. Ann N Y Acad Sci. 1998;863:252–263. doi: 10.1111/j.1749-6632.1998.tb10700.x. [DOI] [PubMed] [Google Scholar]
- Lang R, Gundlach AL, Kofler B. The galanin peptide family: receptor pharmacology, pleiotropic biological actions, and implications in health and disease. Pharmacol Ther. 2007;115:177–207. doi: 10.1016/j.pharmthera.2007.05.009. [DOI] [PubMed] [Google Scholar]
- Laplante F, Crawley JN, Quirion R. Selective reduction in ventral hippocampal acetylcholine release in awake galanin-treated rats and galanin-overexpressing transgenic mice. Regul Pept. 2004a;122:91–98. doi: 10.1016/j.regpep.2004.05.022. [DOI] [PubMed] [Google Scholar]
- Laplante F, Sibley DR, Quirion R. Reduction in acetylcholine release in the hippocampus of dopamine D5 receptor-deficient mice. Neuropsychopharmacology. 2004b;29:1620–1627. doi: 10.1038/sj.npp.1300467. [DOI] [PubMed] [Google Scholar]
- Lee FJ, Xue S, Pei L, Vukusic B, Chéry N, Wang Y, Wang YT, Niznik HB, Yu XM, Liu F. Dual regulation of NMDA receptor functions by direct protein-protein interactions with the dopamine D1 receptor. Cell. 2002;111:219–230. doi: 10.1016/s0092-8674(02)00962-5. [DOI] [PubMed] [Google Scholar]
- Liu F, Wan Q, Pristupa ZB, Yu XM, Wang YT, Niznik HB. Direct protein-protein coupling enables cross-talk between dopamine D5 and gamma-aminobutyric acid A receptors. Nature. 2000;403:274–280. doi: 10.1038/35002014. [DOI] [PubMed] [Google Scholar]
- Mazarati AM, Hohmann JG, Bacon A, Liu H, Sankar R, Steiner RA, Wynick D, Wasterlain CG. Modulation of hippocampal excitability and seizures by galanin. J Neurosci. 2000;20:6276–6281. doi: 10.1523/JNEUROSCI.20-16-06276.2000. [DOI] [PMC free article] [PubMed] [Google Scholar]
- Melander T, Staines WA, Hökfelt T, Rökaeus A, Eckenstein F, Salvaterra PM, Wainer BH. Galanin-like immunoreactivity in cholinergic neurons of the septum-basal forebrain complex projecting to the hippocampus of the rat. Brain Res. 1985;360:130–138. doi: 10.1016/0006-8993(85)91228-4. [DOI] [PubMed] [Google Scholar]
- Melander T, Hökfelt T, Rökaeus A, Cuello AC, Oertel WH, Verhofstad A, Goldstein M. Coexistence of galanin-like immunoreactivity with catecholamines, 5-hydroxytryptamine, GABA and neuropeptides in the rat CNS. J Neurosci. 1986a;6:3640–3654. doi: 10.1523/JNEUROSCI.06-12-03640.1986. [DOI] [PMC free article] [PubMed] [Google Scholar]
- Melander T, Staines WA, Rökaeus A. Galanin-like immunoreactivity in hippocampal afferents in the rat, with special reference to cholinergic and noradrenergic inputs. Neuroscience. 1986b;19:223–240. doi: 10.1016/0306-4522(86)90017-5. [DOI] [PubMed] [Google Scholar]
- Miller MA, Kolb PE, Raskind MA. GALR1 galanin receptor mRNA is coexpressed by galanin neurons but not cholinergic neurons in the rat basal forebrain. Brain Res Mol Brain Res. 1997;52:121–129. doi: 10.1016/s0169-328x(97)00250-7. [DOI] [PubMed] [Google Scholar]
- Milligan G. G protein-coupled receptor hetero-dimerization: contribution to pharmacology and function. Br J Pharmacol. 2009;158:5–14. doi: 10.1111/j.1476-5381.2009.00169.x. [DOI] [PMC free article] [PubMed] [Google Scholar]
- Mitsukawa K, Lu X, Bartfai T. Galanin, galanin receptors and drug targets. Cell Mol Life Sci. 2008;65:1796–1805. doi: 10.1007/s00018-008-8153-8. [DOI] [PMC free article] [PubMed] [Google Scholar]
- Naber PA, Witter MP. Subicular efferents are organized mostly as parallel projections: a double-labeling, retrograde-tracing study in the rat. J Comp Neurol. 1998;393:284–297. [PubMed] [Google Scholar]
- Navarro G, Moreno E, Aymerich M, Marcellino D, McCormick PJ, Mallol J, Cortés A, Casadó V, Canela EI, Ortiz J, Fuxe K, Lluís C, Ferré S, Franco R. Direct involvement of σ1 receptors in the dopamine D1 receptor-mediated effects of cocaine. Proc Natl Acad Sci U S A. 2010;107:18676–18681. doi: 10.1073/pnas.1008911107. [DOI] [PMC free article] [PubMed] [Google Scholar]
- Neumeyer JL, Kula NS, Bergman J, Baldessarini RJ. Receptor affinities of dopamine D1 receptor-selective novel phenylbenzazepines. Eur J Pharmacol. 2003;474:137–140. doi: 10.1016/s0014-2999(03)02008-9. [DOI] [PubMed] [Google Scholar]
- O'Donnell D, Ahmad S, Wahlestedt C, Walker P. Expression of the novel galanin receptor subtype GALR2 in the adult rat CNS: distinct distribution from GALR1. J Comp Neurol. 1999;409:469–481. [PubMed] [Google Scholar]
- Ögren SO, Schött PA, Kehr J, Yoshitake T, Misane I, Mannström P, Sandin J. Ann N Y Acad Sci. 1998;863:342–363. doi: 10.1111/j.1749-6632.1998.tb10706.x. [DOI] [PubMed] [Google Scholar]
- Ögren SO, Kuteeva E, Elvander-Tottie E, Hökfelt T. Neuropeptides in learning and memory processes with focus on galanin. Eur J Pharmacol. 2010;626:9–17. doi: 10.1016/j.ejphar.2009.09.070. [DOI] [PubMed] [Google Scholar]
- Parker EM, Izzarelli DG, Nowak HP, Mahle CD, Iben LG, Wang J, Goldstein ME. Cloning and characterization of the rat GALR1 galanin receptor from Rin14B insulinoma cells. Mol Brain Res. 1995;34:179–189. doi: 10.1016/0169-328x(95)00159-p. [DOI] [PubMed] [Google Scholar]
- Picciotto MR. Galanin and addiction. Cell Mol Life Sci. 2008;65:1872–1879. doi: 10.1007/s00018-008-8151-x. [DOI] [PMC free article] [PubMed] [Google Scholar]
- Rozenfeld R, Devi LA. Exploring a role for heteromerization in GPCR signalling specificity. Biochem J. 2010;433:11–18. doi: 10.1042/BJ20100458. [DOI] [PMC free article] [PubMed] [Google Scholar]
- Sakurai E, Maeda T, Kaneko S, Akaike A, Satoh M. Galanin inhibits long-term potentiation at Schaffer collateral-CA1 synapses in guinea-pig hippocampal slices. Neurosci Lett. 1996;212:21–24. doi: 10.1016/0304-3940(96)12772-5. [DOI] [PubMed] [Google Scholar]
- Schilström B, Yaka R, Argilli E, Suvarna N, Schumann J, Chen BT, Carman M, Singh V, Mailliard WS, Ron D, Bonci A. Cocaine enhances NMDA receptor-mediated currents in ventral tegmental area cells via dopamine D5 receptor-dependent redistribution of NMDA receptors. J Neurosci. 2006;26:8549–8558. doi: 10.1523/JNEUROSCI.5179-05.2006. [DOI] [PMC free article] [PubMed] [Google Scholar]
- Seeman P, Van Tol HH. Dopamine receptor pharmacology. Trends Pharmacol Sci. 1994;15:264–270. doi: 10.1016/0165-6147(94)90323-9. [DOI] [PubMed] [Google Scholar]
- Segal M, Richter-Levin G, Maggio N. Stress-induced dynamic routing of hippocampal connectivity: A hypothesis. Hippocampus. 2010;20:1332–1338. doi: 10.1002/hipo.20751. [DOI] [PubMed] [Google Scholar]
- Vaz SH, Cristóvão-Ferreira S, Ribeiro JA, Sebastião AM. Brain-derived neurotrophic factor inhibits GABA uptake by the rat hippocampal nerve terminals. Brain Res. 2008;1219:19–25. doi: 10.1016/j.brainres.2008.04.008. [DOI] [PubMed] [Google Scholar]
- Wang HY, Wild KD, Shank RP, Lee DHS. Galanin inhibits acetylcholine release from rat cerebral cortex via pertussis toxin-sensitive Gi protein. Neuropeptides. 1999;33:197–205. doi: 10.1054/npep.1999.0024. [DOI] [PubMed] [Google Scholar]
- Xu XJ, Hökfelt T, Wiesenfeld-Hallin Z. Galanin and spinal pain mechanisms: where do we stand in 2008? Cell Mol Life Sci. 2008;65:1813–1819. doi: 10.1007/s00018-008-8155-6. [DOI] [PMC free article] [PubMed] [Google Scholar]
- Zini S, Roisin MP, Langel U, Bartfai T, Ben-Ari Y. Galanin reduces release of endogenous excitatory amino acids in the rat hippocampus. Eur J Pharmacol. 1993;245:1–7. doi: 10.1016/0922-4106(93)90162-3. [DOI] [PubMed] [Google Scholar]