Abstract
Power output of light bulbs changes over time and the total energy delivered will depend on the optical beam path of the microscope, filter sets and objectives used, thus making comparison between experiments performed on different microscopes complicated. Using a thermocoupled power meter, it is possible to measure the exact amount of light applied to a specimen in fluorescence microscopy, regardless of the light source, as the light power measured can be translated into a power density at the sample. This widely used and simple tool forms the basis of a new degree of calibration precision and comparability of results among experiments and setups. Here we describe an easy-to-follow protocol that allows researchers to precisely estimate excitation intensities in the object plane, using commercially available opto-mechanical components. The total duration of this protocol for one objective and six filter cubes is 75 min including start-up time for the lamp.
INTRODUCTION
Fluorescence is used as a major tool in biological research to provide contrast formation in imaging applications. Quantification of fluorescent signals has become an important tool to analyze cellular structure and function. One reason for the success of fluorescent imaging in cell biology, besides the excellent availability of labels including fluorescent proteins, is the cost-efficient use of equipment. A standard fluorescent microscope is equipped with a number of filter sets, consisting of exciter, emitter and dichroic, and a lamp for excitation. However, the power output of light sources changes over time and the total energy delivered to the specimen will depend on the optical path of the microscope and the filter sets and objectives used, as well as on their alignment. Changes in the environment, photo damage to the filter sets and run time of the light source provide effects that will lead to a deterioration of the transmission characteristics of the microscope, adding to the biological variability of the results and making comparison of experiments difficult. Intensity standards have been used for calibration and quantification1–4 and light-emitting diodes (LEDs) have been used to generate an adjustable signal. Imaging of the LED output through the microscope provides a calibration method for the optical system5,6. Microscopes used for single-molecule detection are often equipped with laser lines for illumination. This allows calibrating the excitation intensity to compare results based on this parameter using calibrated photodiodes7,8.
Currently, most labs use beads and dyes as the standard way to calibrate a fluorescence microscope because they are easy to use and are widely available.1,2 The only limitation is that the actual amount of light used to excite the sample is still unknown.1,2 The amount of light can be translated into a power density that allows a direct comparison of experiments, independent of the equipment, for example, objective lenses or filter sets. In the case of photobleaching or photoactivation experiments, a defined amount of applied power is crucial for repeatability of the experiment9. For imaging, knowledge of this parameter can be used to define the detection threshold and is necessary for quantitative analysis of the image brightness10.
In summary, we describe a rapid way to calibrate the amount of light/heat delivered to the specimen for any configuration of a standard research grade fluorescent microscope which we have used in our studies on single-molecule mobility in living cells7,8. This method offers a tool to directly compare results of experiments performed using different optical equipment and microscopes. The major limit to the precision of this method is the variation between the transmission of the objective as provided by the producer and the real transmission. The simplicity and ease of the measurement make this calibration feasible for labs that do not have an extensive background in physics.
Experimental design
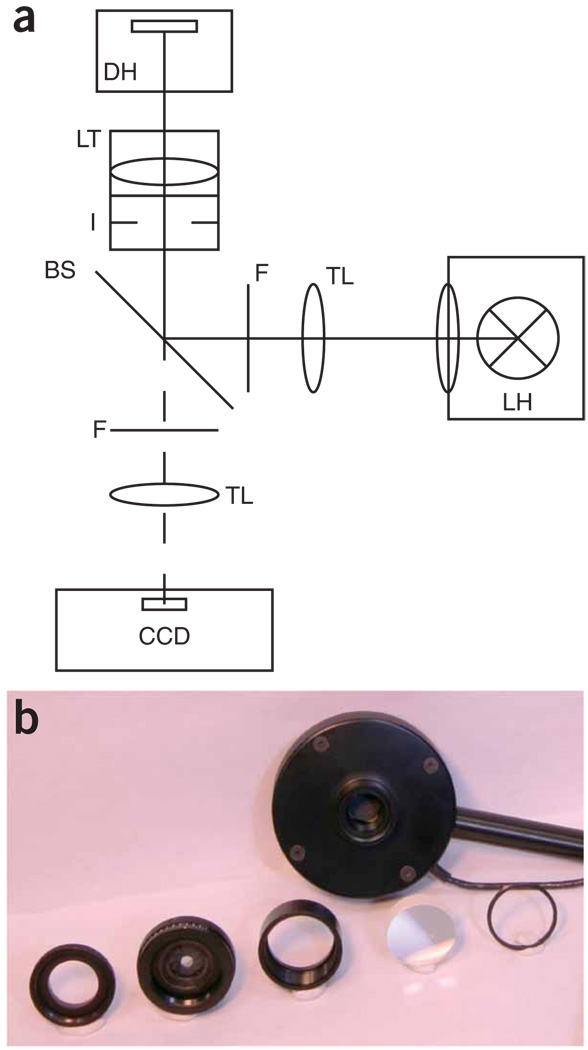
This section contains background information on the optics and concepts related to this protocol. Figure 1a gives a schematic of the light path and where to perform the measurement described in this protocol. Figure 1b shows a photograph of the components used for this protocol. Because laser light is monochromatic, its intensity can be measured using calibrated photodiodes. However, to measure the intensity of light that covers a certain bandwidth, for example, 40 nm passing through an excitation filter, a thermo-coupled detector is needed. Thermal detectors measure the temperature increase that results when the detector surface absorbs light energy, which provides a wavelength-independent measure of the power of light. The goal is to obtain a measurement of the intensity used to excite fluorescence in a given experiment.
Figure 1.
Principle setup and components. (a) Beam path of an inverted fluorescence microscope. Fluorescent light is provided by a lamp (LH) and delivered to the objective by the tube lens (TL). The spectral region of interest is defined by a band pass filter (F), and a matched dichroic beam splitter (BS) is used to reflect the light toward the objective. The objective is replaced by an adjustable iris (I) using a thread adaptor for centered mounting. A lens with short focal length (LT) is stacked on top of the iris to collect the light and image it onto the detector (DH). For completeness, the emission filter (F), the imaging tube lens (TL) and a detector (charge-coupled device (CCD)) are shown. (b) Photograph of the lens and iris assembly that is used to focus the light on to the detector. From left to right: RMS to SM1 thread adapter, SM1 calibrated iris, lens tube, lens and retaining ring. The larger device in the back is the detector head. Please note the size of the active area of the detector head that can be seen inside of the head.
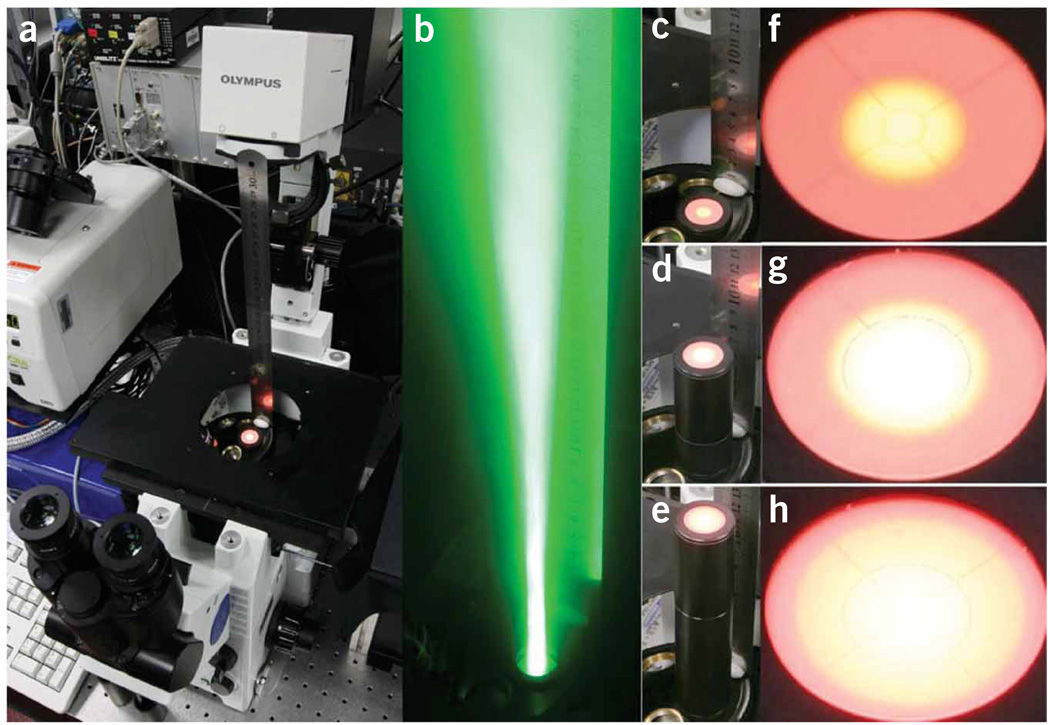
Each objective has a back opening of a defined diameter, acting as an aperture to limit the beam diameter that is allowed to enter the objective. Light delivered to the objective is focused into the back focal plane of the objective by the tube lens in the microscope stand (see Fig. 2). The power measurement is best done above the objective turret without an objective in place. One reason for this is that if a high numerical aperture (NA) immersion objective is used, immersion media would be needed between the objective and the power detector. In addition, many objectives will not fit into the detector head. Removing the objective, hence, helps to avoid damage to the objective’s lens. Placing an adjustable iris centered on the turret opening allows adjustment of the beam diameter to the same size effectively seen by the objective (Fig. 3). Chopping the beam diameter eliminates the need to measure the actual power profile of the beam (see Fig. 4). A lens with a short focal length is used to focus the light from the objective turret onto the power detector that can be mounted on the microscope stage (Figs. 5 and 6). The focused spot should have approximately the size of the active detector area to provide accurate power measurements. Using the transmission curve and field of view of the objective, the intensity measured at the turret can be translated into a power density at the sample. Table 1 presents data taken on an Olympus IX-81 stand for different standard filter sets.
Figure 2.
Beam profile along the optical axis of the microscope. (a) Photograph of an IX71 microscope stand for orientation. Instead of an objective, a screen is installed to visualize the beam profile. A scale (metal ruler) is installed on top of the objective turret. (b) Beam of green light as it is leaving the objective turret in an open position. The tail along the optical axis is clearly visible. (c–e) Screen installed at different distances (see scale on images) from the objective turret. (f,g) Zoom out of the beam profile on the screen at positions (c–e).
Figure 3.
Accounting for differences in the objective back aperture. (a) Calibrated iris with 5-mm opening. (b,c) Photograph of two different high numerical aperture objectives. The open apertures of the objectives are largely different. (d) Calibrated iris with 12-mm opening. If the iris is placed at approximately the same relative position within the beam (Fig. 2b) as the aperture of the objective, it can be used to selectively measure only the amount of light that is actually entering the respective objective.
Figure 4.
Lateral intensity profile of the excitation light. (a) Photograph of the beam profile on a screen 12 cm above the objective turret. The position is arbitrarily chosen to optimally present the intensity distribution within the beam. (b) Line profile plot (as indicated by black line in a) of the intensity distribution of the beam profile. The profile shows an approximately Gaussian form with excellent flatness in the center and slow intensity decay toward the outsides. The total width of the beam profile is in the range of 15 mm. The sharp dips at 30 and 120 on the x axis result from the target on the screen. To correct the power measurement for different diameters of the objective back opening and the Gaussian form of the profile, one has to either know the intensity distribution within the beam to calculate the correct power or introduce an iris with an open diameter corresponding to that of the objective. In the latter case, one directly measures the correct power value.
Figure 5.
Assembling of the refocusing unit. The assembly of the iris and lens is shown. (a) Thread adapter (here RMS to SM1), (b) calibrated iris that is mounted to the thread adapter, (c) lens tube that holds the lens centered on the iris, (d) short focal length lens that focuses the beam onto the detector and (e) retaining ring that screws on top of the lens into the lens tube to secure the lens. (f) Fully assembled iris and focusing unit.
Figure 6.
Installation of refocusing unit and power meter on the microscope. Overview of the installation on the microscope. (a) Total view of an IX71 stand. (b) The iris/lens assembly is installed in an open position of the objective turret. (c) The detector head is placed in the center of the stage inset. Tape is used to hold it in place.
TABLE 1.
Anticipated results.
| Exciter filter |
Power reading at turret (mW) |
Power density × 60 (W cm−2) |
Power reading at turret (mW) |
Power density × 150 (W cm−2) |
|---|---|---|---|---|
| 436/20 | 1.1 | 0.6 | 0.7 | 3.4 |
| 470/40 | 2.9 | 1.6 | 1.7 | 8.6 |
| 500/20 | 1.4 | 0.8 | 0.9 | 4.7 |
PlanAPO 60×, 1.4 numerical aperture (NA), field number 26.5, 80% transmission at 436/20 nm, 83% transmission at 470/40 nm, 89% transmission at 500/20 nm, back aperture opening 12 mm. UPlanAPO 150×, 1.35 NA, field number 22, transmission 436/20 at 82%, 470/40 at 85%, 500/20 at 88%, back aperture opening 8 mm. Newport power meter, M70260 with detector head 70268. Light source Lamda DG4/OF30, sutter, equipped with a 300 W Xenon bulb and coupled to the microscope using a liquid light guide.
The power density describes how much light is passing through a defined area and might be pictured as the ‘flow’ or light flux. It directly describes the effective amount of light applied to the sample and is commonly used in laser-based applications. The unit of the parameter is kW cm−2. The illuminated area on a fluorescent microscope is in the range of hundreds of square micrometers and less, depending on the field of view (FoV) of the objective lens, which is expressed in the field number (FN). The field of view is the field number divided by the magnification of the objective; for example, an objective with a field number of 26.5 and a magnification of ×60 will illuminate an area in the object plane of 442 µm in diameter according to equation (1).
| (1) |
Using the radius of the FoV it is straightforward to translate the power measured into a power density as done for Table 1 using equation (2).
| (2) |
For instance, a 60× objective with a field number of 26.5 mm, as used in Table 1, will provide a field of view of 441.7 µm (FoV = 26.5 mm/60 = 0.44167 mm). Accordingly the illuminated area is ~3.14 × (220.85 µm)2 = 0.0015 cm2 (when scaling from µm2 to cm2 keep in mind the square so the total is 10−8). In Table 1 an intensity of 0.0011 W (or 1.1 mW) is reported, resulting in an power density of 0.0011 W/0.0015 cm2 = 0.73 W cm−2, which multiplied by the transmission of 80%(as provided by the producer of the objective) leads to the power density of 0.6 W cm−2 as given in Table 1.
The intensity reading at the turret also provides a convenient way to monitor the transmission and alignment performance of all the components in the excitation path such as the lamp, light guide, lenses, filters and mirrors.
MATERIALS
EQUIPMENT
Power meter and low power detector head (e.g., Newport model 70260 radiant power meter, model 70268 thermopile 3 W; Newport)
Antireflection-coated lens 1-inch or 25.4-mm diameter (e.g., AC254-040-A1 or AC254-030-A1; Thorlabs)
Lens tube (e.g., SM1L05; Thorlabs)
Adjustable iris (SM1D12C; Thorlabs)
Thread adapter (e.g., SM1A4; Thorlabs, for Olympus stands) (see EQUIPMENT SETUP)
Caliper; spanner wrench (e.g., SPW602 or SPW801; Thorlabs) or small screw driver for assembly of optics screen (see EQUIPMENT SETUP)
EQUIPMENT SETUP
Optomechanics
Mount the lens into the lens tube. If available, use a spanner wrench or a small screw driver to fix the lens with the retaining ring that comes with the lens tube. Mount the lens tube on the adjustable iris. Connect the thread adapter to the iris (Fig. 5).  Thread adapters are available commercially but not for all microscope stands. While the end of the thread adapter that connects to the iris and lens uses a female SM1 thread (Thorlabs standard), it might be necessary to ask a machine shop to fabricate an adapter that couples your microscope turret to SM1. The size of your turret thread is available from the manufacturer. Measure the open aperture of the objective’s back side; see Figure 3b,c for examples. If you use multiple objectives repeat this for each objective.
  Use extreme care not to touch or scratch the lens mounted in the back aperture of the objective!
Screen
A screen is used to visualize beams without looking at them directly. The material should be homogenous and sized so that the screen can easily be introduced between turret and stage. Orange cardboard has been proven useful as well as object holders with a piece of scotch tape attached to one side or a piece of lens paper.
Power meter
Connect the power meter and the detector head. Follow the manufacturer’s handbook. Double check if an external calibration module needs to be connected. Remove tubes in front of the detector head to minimize its dimension.
PROCEDURE
Calibration of light source
-
Turn the light source on 1 h before the measurement.
 Never look directly into open beams; use safety goggles when dealing with high power light sources!
 This procedure is written based on training this protocol to lab members. If you are an experienced microscopist you will easily adjust the protocol. This protocol is written to enable people unfamiliar with optics to perform this calibration safely.
The assembly of parts on the microscope is shown in Figure 6.
If required, zero the power meter, allow for thermal adjustment.
-
Remove the objective or turn the turret to an empty position.
 To avoid damage of mounted objectives make sure that the lens–iris assembly fits easily between the objectives.
Remove objectives if they present steric hindrance. Also, make sure that objectives do not hit the stage plate if the turret position is adjusted, for example, for focusing.
Adjust the iris diameter to the size of the back aperture of the objective used for the experiment.
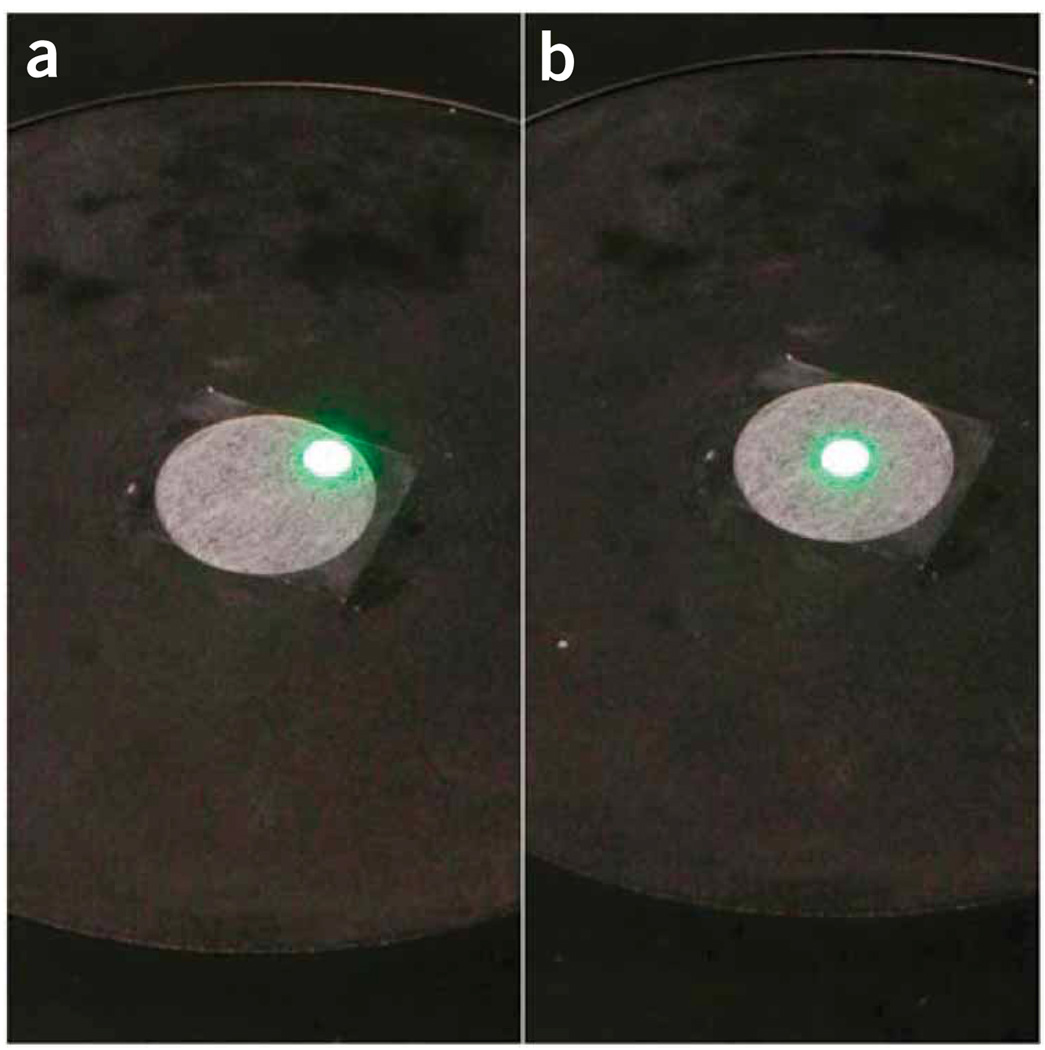
To find the correct x,y position for the detector head first place a screen (see EQUIPMENT SETUP) on top of the stage instead of the power detector. Open the excitation light shutter. Use the stage handle to center the stage relative to the spot (see Fig. 7). Use the coarse focus knob of the microscope to focus onto the screen. Close excitation light shutter when done.
-
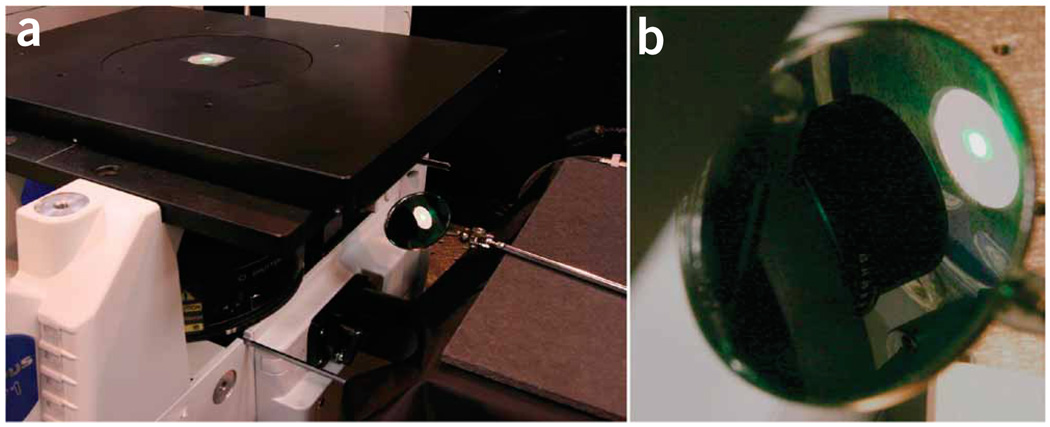
Mount the detector head onto the stage. Follow the appropriate protocol for your microscope stand as described. Inverted stand: center the detector head with the open position down (facing the turret) on the stage inset. Use scotch tape to fix the detector head. Upright stand: the distance between turret and stage is often smaller than it is with inverted stands. If you cannot slide the detector head between the lens tube and the stage, you might be successful by rotating the lens tube (turret) a little out of its position, sliding the detector head in and turning the lens tube back. (A dentist’s mirror has been proven helpful for beginners to see the beam on the detector surface (see Fig. 8) but has to be used carefully as light can be reflected back toward the eye.)
 Never use force here to avoid damage to the detector head or lens.
Turn the filter turret to a filter set used in the experiment.
Open excitation light shutter.
-
Adjust the position of the detector for maximal power reading by using the stage drive.
 Thermocoupled power meters are slow. Move the stage for short distances and wait for a stable reading on the power meter (2–10 s). Move along one direction first until you have the maximum, and then do the second direction.
Repeat for both directions alternating at least two times.
 Do not move stage once the best position (maximum intensity) is found.
 Read maximum intensity.
Take data for all filter sets of interest by moving the filter turret. Close the excitation light shutter between measurements.
Figure 7.
Repositioning of the microscope stage to center the detector head. A screen can be used to visualize the relative position of the beam and the stage (a). To cover the whole beam on the active area of the detector (see Fig. 1b), the stage should be centered (b) on the optical axis before the detector head is installed.
Figure 8.
Visualization of the beam position relative to a detector. Microscopy beginners might find an additional control of the beam position helpful. (a) A dentist mirror is used to visualize the lower side of the object stage of the microscope. (b) Zoom in on the mirror. Please be aware that back scattered light will reflect off the mirror toward the eyes of the observer. For precise alignment of the detector head, determine the position where maximal power is measured. Keep in mind that thermo-based power meters have relatively long lag times in the range of a couple of seconds.
![]()
The total time of this protocol for one objective and six filter cubes is 75 min including start-up time for the lamp.
During start up of the lamp there is time to perform Steps 2–7, which will take 5 min. Steps 8–10 can be done for testing during warm up but must be repeated once the lamp is running stable (after ~1 h). Steps 8–10, 5 min. Steps 10 and 11, 30 s per filter set.
![]()
Troubleshooting advice can be found in Table 2.
TABLE 2.
Troubleshooting table.
| Problem | Solution |
|---|---|
| The spot of the focused light is larger than the active area of the detector | Refocus the turret |
| Change focal length of the lens | |
| Measure the size of the focused spot and correct measurement by the area mismatch | |
| The detector does not fit between the lens (turret) and stage | Most likely to occur with upright microscope stands. The protocol was tested on an IX70 (Olympus) upright stand, an IX71/81 (Olympus) inverted stand, an inverted Observer (Zeiss) stand and an inverted DM IRE2 (Leica) stand. If new equipment is purchased for this protocol, minimal total height should be a criterion for the detector head and lenses |
| Mount a mirror in a filter cube and reflect the light out of the original beam path or try to remove the stage or stage insets |
ANTICIPATED RESULTS
Three different filter sets commonly used in biological applications have been used to measure the power at the turret; see Table 1. Using published data or specification from the manufacturer on the transmission efficiency of the objective the power measured has been translated into the corresponding power densities. The filter nomenclature gives the center wavelength and the band width of the exciter filter. Because of the smaller field of view of the 150 × objective, compared to the 60×, the power densities are higher for this objective. Typical intensity values will be in the low mW region as presented in Table 1. Often light bulbs have peaks at certain wavelength regions and are rather dim in others. The total power will depend on the amount of light coupled from the lamp to the microscope, the width of filter sets and their transmission. Calculating power densities (see Experimental design) for different objectives based on their field of view allows comparing imaging results between different experiments more easily. Large differences in day-to-day performance will most often be caused by burnout effects of the bulb, changes in the alignment or intermediates such as liquid light guides. One order of magnitude is considered a large change; however, even much smaller changes can explain why for example the detection threshold is not longer reached in an experiment.
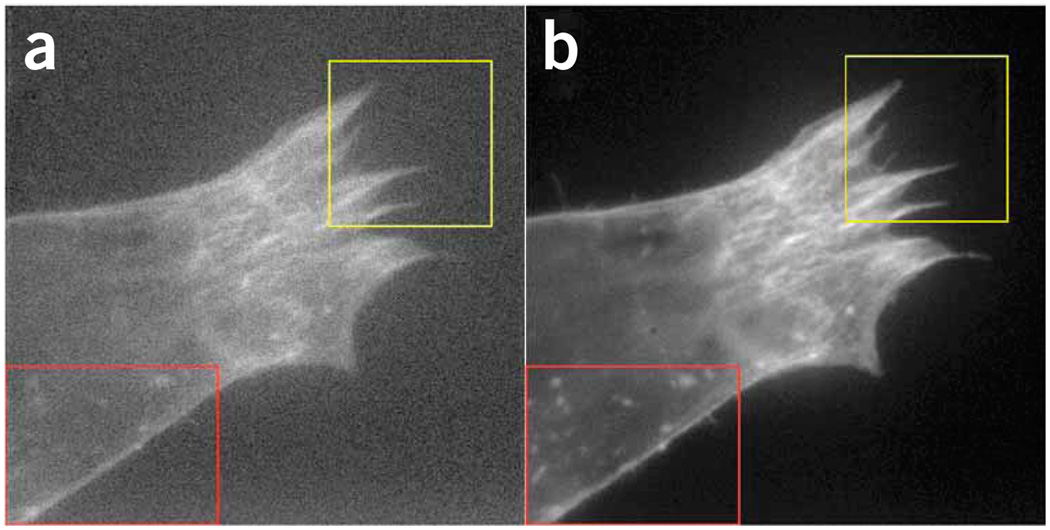
Figure 9 visualizes the effect of differences in excitation power. A cell stained with fluorescein isothiocyanate phalloidin was imaged first under low light conditions (18 W cm−2, Fig. 9a) and next under high power conditions (120 W cm−2, Fig. 9b). All other settings (filter, objective, exposure time, gain, charge-coupled device settings) were unchanged. Although many fine details are clearly visible under high power conditions, they are hardly noticeable in the previously acquired image at low power.
Figure 9.
Effect of excitation intensity variations on images. MRC5 fibroblast cells expressing an RNA-binding protein fusion have been stained with fluorescein isothiocyanate phalloidin to show actin filaments. (a) The first image was taken at a power of 18 W cm−2 to avoid prebleaching of the sample. (b) The same cell was imaged a second time at 120 W cm−2. Red and yellow insets highlight regions with fine detailed structures. An iXon+ EMCCD was used for acquisition, integration time was 30 ms, gain 5 at 10 MHz clock speed in frame transfer mode. Images were taken on an IX71 stand (Olympus) equipped with a 150× objective combined with a 300-mm focal length tube lens (providing 250× magnification), an HQ480/20 excitation filter and a z500dcxru dichroic mirror (Chroma).
This protocol can also be used for maintenance, to compare the effects of different objectives on the imaging, to measure the applied heat or get a grip on the overall variation of the light source. The following list provides some examples how to apply steps of the protocol to gain different information:
Use of multiple objectives. Most objectives vary in the size of the back aperture, see Figure 3. To compare different objectives, as done in Table 1, repeat Steps 9–11 of the protocol for different iris settings. The iris settings should match the back apertures of your objectives.
To monitor the light bulb performance over time, repeat Step 9–11 with a fully open iris for all filter sets on a regular basis (e.g., weekly). The result is a table that contains the date of the measurement and the power you read. This allows a better judgment on bulb replacement cycles.
To monitor the noise of the light bulb, repeat Step 10 at fixed time intervals like every 2 or 5 min. Monitor power fluctuations shortly after turning the lamp on and at later time points, for instance take ten measurements within 2 min after 15, 30 and 60 min. Calculate and compare the s.d. of the intensity measurements at the different time points to estimate the heat up time for your light source. To estimate the fluctuations introduced by the light source, perform time lapse measurements corresponding to your experiment with cells. Repeat the time lapse measurement at least six times and calculate the s.d. for each time point of the time lapse. In all cases shutter light between measurements.
To measure heat, adjust the read out of your power meter. Most power meters will allow choosing between read outs in power and energy units. If the heat applied to the sample is of interest, it can be estimated in this way for different filter settings.
ACKNOWLEDGMENTS
The authors thank Fedor Subach for help with photography, Amber Wells for providing cells and stainings, Christina Polumbo for testing the protocol for facility use and Saumil Gandhi for bringing the original problem back on our agenda. This work was supported by National Institutes of Health grants to R.H.S and a DFG postdoctoral fellowship (GR3388/1) to D.G. Photographs have been adjusted in size and for best display of features using Photoshop CS (Adobe). Images for Figure 9 have been adjusted to 8-bit using ImageJ.
References
- 1.Model MA, Blank JL. Intensity calibration of a laser scanning confocal microscope based on concentrated beads. Anal. Quant. Cytol. Histol. 2006;28:253–261. [PubMed] [Google Scholar]
- 2.Zwier JM, Van Rooij GJ, Hofstraat JW, Brakenhoff GJ. Image calibration in fluorescence microscopy. J. Microsc. 2004;216:15–24. doi: 10.1111/j.0022-2720.2004.01390.x. [DOI] [PubMed] [Google Scholar]
- 3.Fusco D, et al. Single mRNA molecules demonstrate probabilistic movement in living mammalian cells. Curr. Biol. 2003;13:161–167. doi: 10.1016/s0960-9822(02)01436-7. [DOI] [PMC free article] [PubMed] [Google Scholar]
- 4.Murray JM, Appleton PL, Swedlow JR, Waters JC. Evaluating performance in three-dimensional fluorescence microscopy. J. Microsc. 2007;228:390–405. doi: 10.1111/j.1365-2818.2007.01861.x. [DOI] [PMC free article] [PubMed] [Google Scholar]
- 5.Beach JM. A LED calibration source for dual-wavelength microscopy. Cell Calcium. 1997;105:55–63. doi: 10.1016/s0143-4160(97)90097-x. [DOI] [PubMed] [Google Scholar]
- 6.Cho EH, Lockett SJ. Calibration and standardization of the emission light path of confocal microscopes. J. Microsc. 2006;223:15–25. doi: 10.1111/j.1365-2818.2006.01598.x. [DOI] [PubMed] [Google Scholar]
- 7.Kubitscheck U, et al. Nuclear transport of single molecules: dwell times at the nuclear pore complex. J. Cell Biol. 2005;168:233–243. doi: 10.1083/jcb.200411005. [DOI] [PMC free article] [PubMed] [Google Scholar]
- 8.Grünwald D, Hoekstra A, Dange T, Buschmann V, Kubitscheck U. Direct observation of single protein molecules in aqueous solution. ChemPhysChem. 2006;7:812–815. doi: 10.1002/cphc.200500632. [DOI] [PubMed] [Google Scholar]
- 9.Shaner NC, et al. Improving the photostability of bright monomeric orange and red fluorescent proteins. Nat. Methods. 2008;5:545–551. doi: 10.1038/nmeth.1209. [DOI] [PMC free article] [PubMed] [Google Scholar]
- 10.Burger W, Burge MJ. Digital Image Processing: An Algorithmic Introduction using Java. New York: Springer-Verlag; 2008. [Google Scholar]


