

Abstract
High-throughput analyses of a large number of samples for pharmacokinetic (PK) studies are essential in drug development. Analysis of drug candidates from blood using LC-ESI-MS generally requires separation of the plasma fraction followed by various offline sample preparation procedures. This step is a bottleneck that impedes throughput. In order to overcome this difficulty and accelerate analysis in PK and other studies, we developed an approach allowing the direct analysis of low volumes of whole blood (10 μL) after dilution and centrifugation. Samples were injected in an online-SPE-LC-ESI-MS/MS setup allowing a total run time of only 126 s for a full gradient separation. Analytes were extracted from the matrix within 30 s by turbulent flow chromatography. Subsequently, a full gradient separation was carried out within 1.5 minutes on a 50 × 2.1 mm (1.7 μm) RP-18 column and the analytes were sensitively detected by ESI-MS/MS in SRM mode. The performance of this new ultra fast online SPE-LC-ESI-MS/MS approach was demonstrated by the analysis of diclofenac (DCF), a widely used anti-inflammatory drug. DCF eluted at stable retention times (±0.33%) with narrow peak width (FWHM 3.3 ± 0.15 s). The method displays excellent analytical performance, with a limit of detection of 6 fmol on column, a linear range of over four orders of magnitude and a negligible carry over of 0.12 ± 0.03% for DCF. The PK profile of DCF administered by topical and intraperitoneal routes in rats and by oral route in one human volunteer is investigated using this method. Finally, general applicability of the approach for drugs is demonstrated by analysis of rofecoxib and several inhibitors of the soluble epoxide hydrolase. This new method requires only readily available, off the shelf standard LC instrumentation, and is compliant with the requirements of green analytical chemistry.
1. Introduction
The determination of drug concentration in biological fluids is indispensable in pharmaceutical research. In order to investigate the pharmacokinetic (PK) of new drug candidates, compare PK profiles of different formulations, or to monitor drug levels to establish the appropriate dose or frequency of administration, bio-analytical methods are needed which allow the fast and reliable measurement of the compounds in biological matrices.1 Online solid-phase extraction (SPE) is a fast analysis strategy that allows direct injection of plasma and urine samples for HPLC analysis.1–3 This procedure is not only faster than conventional sample preparation (manual SPE or liquid/liquid extraction), but can improve reproducibility and decrease the risks of handling potentially infectious biomaterials.1–3 For the online SPE of protein containing samples, one of the most effective techniques is the use of short, narrow columns filled with large particles (50–60 μM).1–3 The application of these columns with high flow rates results in a turbulent flow, which enhances mass transfer between the mobile phase and stationary phase. This allows the separation of small molecule analytes from the matrix due to the larger diffusion coefficient of proteins.1–3 This technique, now known as turbulent flow chromatography (TFC), significantly reduces the matrix effects of proteins in LC-ESI-MS quantification,4 though it was found to be ineffective in reducing disturbance by phospholipids.5 TFC was introduced in 1997 by Quinn and Takarewski6 and has found broad application in bio-analytical research. The uses of TFC range from enhancing the limit of detection (LOD) by injection of large sample volumes,7 to the monitoring of enzyme inhibition8 or receptor binding.9 However, TFC is most widely used in online-SPE-LC-ESI-MS/MS for the analysis of drugs in biological samples.1–3 In the last three years, numerous methods have been published utilizing TFC in online-SPE-LC-ESI-MS/MS designed for the fast analysis of single drug compounds in biological samples, specifically plasma.10–17 Few approaches combine TFC with the high chromatographic resolution of modern sub-2 μm particle filled columns. Xin et al.17 and Mottier et al.18 showed that a combination of TFC with sub-2 μm columns can be successful, however, their methods’ runtimes were rather long at 7 and 19 minutes, respectively.
Whereas urine can be frozen and stored after sample collection or used directly for extraction and analysis, whole blood is generally separated into plasma and a cellular fraction before analysis. A drawback to this conventional procedure is the immediate processing required prior to storage. Additionally, a relatively large sample volume is required in order to isolate the plasma fraction by centrifugation, which is not always possible with commonly used laboratory animals. Although whole blood is regarded as an acceptable biological matrix for the measurement of drug exposure by regulatory authorities,19 the concentration of compound in whole blood differs from the concentration in plasma.20 Given a blood to plasma ratio of 2 (comparable to a standard hematocrit of 0.5) the concentration of a compound which does not bind to red blood cells in plasma is twice as high when compared to analytical techniques using whole blood.21 However, the compound of interest in red blood cells, or adhering to cells or platelets is not analyzed in the plasma since the cellular fraction is removed. Due to the compound dependent binding of drugs to blood cells, the ratio between whole blood and plasma concentration is highly variable.20,21 Moreover, the ratio of free (unbound) drug in plasma relative to its determined concentration in whole blood is highly dependent on the compound.20 However, concentration of a drug in whole blood better reflects the total amount of compound in the system. The present work aims to develop a robust TFC based online-SPE-LC-ESI-MS/MS method utilizing a sub-2 μm column for chromatographic separation. This technique is designed for high-throughput analyses in PK studies allowing quantification from small volumes of whole blood. The applicability of this new method is demonstrated by analyzing diclofenac (DCF), a widely used non-steroidal anti-inflammatory drug (NSAID) as a model compound. At least seven online-SPE-LC-MS/MS22–28 and several LC-MS/MS methods29–32 are described, allowing a direct comparison of the analytical performance of our approach. Finally, we successfully applied this method in a PK study and demonstrated that the approach can easily be adapted to the high-throughput analysis of other drugs.
2. Experimental
2.1 Chemicals
Diclofenac sodium salt (>98% purity) was purchased from MP Biomedicals LLC (Solon, Ohio). The internal standard (I.S.) diclofenac-d4 (phenyl-d4) (98% atom D) was obtained from CDN Isotopes (Quebec, Canada). The chemical structures of the analytes are displayed in Fig. 1. Rofecoxib (ROF) was purchased from Toronto Research Chemicals Inc. (North York, ON, Canada). All other chemicals were obtained from Fischer-Scientific (Pittsburgh, PA) and were of the highest quality available.
Fig. 1.
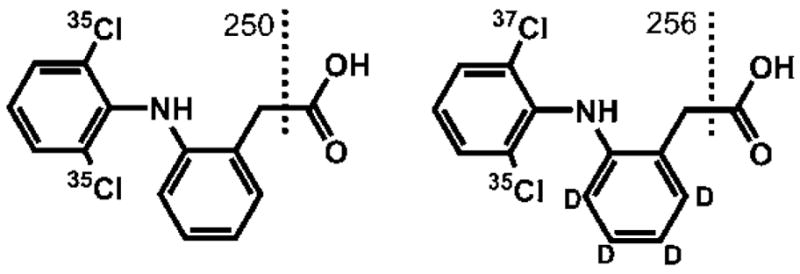
Structures of diclofenac (left) and its deuterated derivative (right) used as the internal standard. The dashed lines depict the sites of fragmentation and the adjacent numbers represent the m/z values of the fragments used for quantification in SRM.
2.2 Synthesis
Inhibitors of the soluble epoxide hydrolase were synthesized in our laboratory as described elsewhere.33,34 The internal standard (I.S.) sEHi b was synthesized by an analogous procedure. In brief, N-BOC-4-aminopiperidine was added to a solution of 4-trifluoromethoxyphenylisocyanate (1 eq.) in THF at 0 °C, and the reaction was stirred overnight. The resulting compound was purified by flash chromatography and treated with 1 M HCl in methanol (MeOH). The solvent was removed, and the residue was triturated with 1 M NaOH and filtered. The resulting piperidine free base was dissolved in dry THF and reacted with ethanesulfonyl chloride (1 eq.) and triethylamine (1.3 eq.). After stirring for 12 hours at room temperature, the reaction was quenched with 1 M HCl. The precipitate was collected and recrystallized from ethyl acetate: acetone to give 1-(1-(ethylsulfonyl)piperidin-4-yl)-3-(4-(trifluoromethoxy)phenyl)urea as a white solid (122 mg, 52% over 3 steps), mp 235–239 °C. 1H NMR (500 MHz, DMSO-d6) δ 8.56 (s, 1H), 7.47 (d, J = 9.1 Hz, 2H), 7.22 (d, J = 8.7 Hz, 2H), 6.29 (d, J = 7.6 Hz, 1H), 3.66–3.58 (m, 1H), 3.52 (br d, J = 12.6 Hz, 2H), 3.05 (q, J = 7.3 Hz, 2H), 2.96 (ddd, J = 11.5, 11.5, 2.5 Hz, 2H), 1.89 (dd, J = 12.6, 2.5 Hz, 2H), 1.41 (dq, J = 11.5, 2.5 Hz, 2H), 1.21 (t, J = 7.3 Hz, 3H).
2.3. Instrumental setup
Online SPE-LC (Fig. 2) was performed on a Agilent 1200 LC system (Agilent, Palo Alto, CA) comprised by two G1379B degassers, two G1312B gradient HPLC pumps and a high-pressure, two-position six port valve implemented in a G1316B column oven set to 40 °C. Samples were kept at 4 °C in a LEAP HTC-PAL auto sampler (Leap Technologies, Carrboro, NC) equipped with a 20 μL sample loop and 25 μL syringe. The samples (25 μL) were injected and 20 μL were introduced by full-loop injection into a flow of 1250 μL min−1 0.1% acetic acid (HAc) in water delivered by pump 1 (Fig. 2A). The analytes were extracted using a Cyclone RP-18 column (Thermo Fisher Scientific, Waltham, MA) with the dimensions 50 × 0.5 mm, a particle size of 50 μm and a pore size of 10 nm (Fig. 2A). After 30 s the 6 port valve was switched, and the analytes were back flushed by the solvent stream of 300 μL min−1 delivered by pump 2 (Fig. 2B) into a Water Acquity C18 reversed phase column (Waters Milford, MA) with the dimensions 50 × 2.1 mm, a particle size of 1.7 μM and a pore size of 13 nm. The analytes were separated by a binary gradient of 25 mM ammonium acetate containing 0.1% HAc as solvent A and pure acetonitrile (ACN) as solvent B. The gradient, flow rates and the six port switching times are displayed in Fig. 2 and in detail in Table S1†.
Fig. 2.

Scheme of the online-SPE-LC-MS/MS set up. The sample is transferred onto the SPE column by pump 1 (A). After this loading step, the six port valve is switched (0.5 min) so that analytes are eluted from the SPE column towards the separation column by pump 2 (B). The valve is switched back immediately after (1.0 min). DCF and I.S. elute, while the SPE column is cleaned and regenerated. In the diagrams the applied gradients (black line) and flow rates (grey line) of the LC pumps are given, and switching points of the six port valve are indicated by dashed lines.
Mass spectrometric detection was carried out on an ABI 4000 TRAP tandem mass spectrometer equipped with a pneumatically assisted “turbo V” electrospray ionisation (ESI)-source (Applied Biosystems, Foster City, CA). The instrument was operated in negative ion mode with an ion-spray voltage of −2500 V, using nitrogen at 25 psi as curtain gas, at 40 psi nebulizer gas and at 70 psi drying gas at a temperature of 450 °C. The analytes were detected in unit resolution in the selected reaction monitoring mode (SRM), monitoring the transitions m/z 294/250 for DCF and m/z 300/256 for the I.S. with a dwell time of 100 ms. The parameters were as follows: declustering potential (DP) −50 V, entrance potential −10 V, collision energy (CE) −16 V, and collision exit potential −13 V. The collision-activated dissociation gas was set to “medium”. All source parameters were optimized under LC conditions and the electrical parameters were optimized by direct infusion. The same source parameters were used for analysis of ROF and sEHi a–g. The transitions and optimized CE and DP are shown in Section 3.3.
Analyst Software (version 1.4.4.2, Applied Biosystems) was used for controlling the online-SPE-LC-ESI-MS/MS system, data acquisition, integration and quantification. The sample analyte concentrations were calculated directly by comparing the detected DCF peak area to the I.S. peak area. For calibration, the DCF to I.S. ratios were linearly fitted reciprocally weighted by concentration.
2.4 Preparation of standard solutions and spiked samples
Analyte and I.S. stock solutions were prepared in DMSO (10 mM) and kept at −20 °C. I.S. solution was prepared by diluting I.S. stock solution in ACN/water/HAc 50/45/5 to a final concentration of 50 nM. For calibration, analyte solution was sequentially diluted in water yielding concentrations of: 1000, 500, 300, 100, 50, 30, 10, 5, 3, 1, 0.5, 0.3, 0.1, 0.03, and 0.01 nM. The dilutions were equally mixed with the I.S. solution.
For determination of recovery rates, spiked sample solutions were prepared by mixing 90 μL of human urine, rat plasma and rat whole blood with 10 μL of 1000 nM, 300 nM and 100 nM of standard solution respectively. Each spiked solution was prepared in triplicate and treated the same as samples. For the calculation of the recovery rate the measured concentration was divided by the spiked amount (100, 30 and 10 nM).
2.5 Sample preparation
Whole blood samples (10 μL) were directly added to pre-prepared tubes containing 50 μL purified water and gently vortexed directly following collection. The clear bright red mixture was immediately frozen at −80 °C and stored for up to 7 days. On the day of the analysis, this sample was mixed with I.S. solution 1: 1 (v/v), vortexed and centrifuged at 16 000 × g at 4 °C for 5 min. The supernatant was then directly injected into the online-SPE-LC-ESI-MS/MS system. Urine and plasma were prepared in the same way, by directly mixing 50–100 μL of sample with an equal volume of I.S. solution.
2.6 Biological samples
For the generation of blood and plasma samples, male Sprague Dawley rats (n = 3) were deeply anesthetised with isoflurane and blood collected by cardiac puncture in heparinised glass tubes (BD BioSciences, San Jose, CA). A portion of the pooled blood was stored as “whole blood” at 4 °C. The remainder was centrifuged at 3500 rpm for 10 min at 4 °C and the plasma was recovered and frozen at −80 °C. Urine samples were collected from human volunteers and used directly.
2.7 Pharmacokinetic (PK) studies
PK studies of DCF were conducted in two groups of 6 male rats (Charles River Inc. Boston, MA) as part of a cassette dosing experiment with other compounds. Animals were housed in approved facilities with access to ad libitum food and water under 12: 12 light: dark cycle under standard conditions. The first group received a single dose of DCF (1 mg kg−1 bodyweight) by intraperitoneal injection (1 mg mL−1 in 1: 1 sterile saline: PEG400). The second group received a dermal formulation (1%, 6 mg Kg−1 bodyweight) prepared by dissolving DCF in Vanicream as described by Inceoglu et al.35 The cream was administered to one hind paw and massaged into the paw for at least 1 minute. Blood (10 μL) was then collected by tail vein puncture at 0.5, 1, 1.5, 2, 4, 8, 24 and 38 h post-administration.
A pioneer PK study monitored blood and urine DCF concentration in a single male human volunteer (80 kg bodyweight) who was treated with a DCF tablet prescribed for knee joint pain. In this study, the subject ingested a single Voltaren tablet (Novartis Pharma GmBH, Nürnberg, Germany) containing 50 mg DFC sodium salt in an enterically coated formulation. Blood samples (10 μL) were collected by finger prick 0.5, 1, 1.5, 2, 3, 4, 5, 6, 7, 8, 11 and 24 h after administration. An Accu-Chek, soft touch device (Roche, IN) set to a penetration depth of 5 with “ultra thin” needles was used for finger pricks. The first blood drop was discarded. A 10 μL volume of blood was then transferred from the finger into a 1.5 mL tube using a 10 μL tip with an Eppendorf pipetter. Urine was collected over a period of 24 h. This study was reviewed and approved by the UC Davis IRB committee and informed consent was obtained from the subject prior to the study.
The PK study of sEHi b was conducted in a group of 3 male Sprague-Dawley rats (Charles River Inc. Boston, MA), receiving a single dose of the compound (10 mg kg−1 bodyweight, dissolved in PEG400) by intraperitoneal injection. Blood was collected at 1, 2, 4, 8, 24, 48, 72, 96, 120, 144, 168, 240, 264 and 312 h following drug administration as described for the rat DCF study above.
3 Results and discussion
3.1 Sample preparation
The aim of our study was to develop a rapid and robust method for the quantification of drugs in biological fluids. We focused on developing a streamlined and automated ultra fast approach for extraction, separation and detection. Equally important, we aimed to develop a fast and reproducible procedure for sample collection and preparation. This approach is suitable for small blood volumes collected from minimally invasive finger pricks or from small laboratory animals, and avoids time consuming fractionation steps. For sample collection, whole blood (10 μL) is simply mixed promptly with 50 μL purified water. The blood cells burst by osmosis and no coagulation occurs. The resulting clear red solution can be frozen or directly analyzed. Since there are no additional requirements, this step is easily performed at the site of collection. Similar to a rapid approach for the determination of acetylcholine in crude samples,36 the only sample preparation in our method is a mixing with water followed by 1: 1 dilution with an internal standard solution in 50/45/5 water/ACN/HAc followed by centrifugation. The final acid concentration of 2.5% in the samples denatures proteins and enables efficient retention of the acidic analytes on the SPE column. The 25% ACN content of this mixture increases the extraction efficiency of the analytes from the high molecular mass matrices, and is sufficiently polar to allow retention of analytes on the SPE column (see Section 3.2). Urine and plasma samples can be treated in the same manner, by mixing with an equal volume of sample and I.S. solution. Overall, only three steps require manual manipulation: (i) sample collection, (ii) mixing with I.S. solution and centrifugation, and (iii) transferring the supernatant for analysis. Parallel processing of 30 samples results in a cumulative hands-on preparation time of about 1 minute per sample.
3.2 Online-solid phase extraction
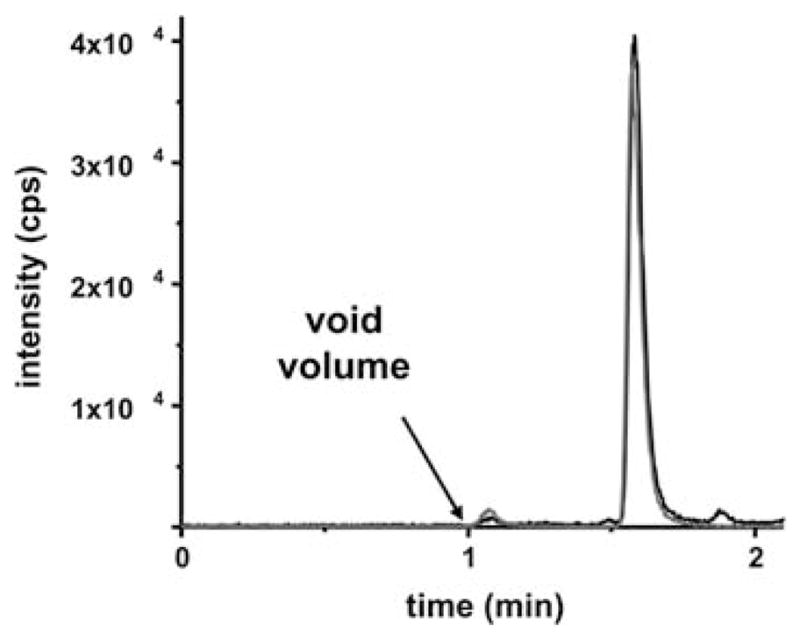
In the development of the online-SPE-LC-MS/MS method, the main emphasis was set on a short analysis time suitable for high throughput analysis. The crude samples were injected into a flow of 1250 μL min−1 water acidified with 0.1% HAc. This flow rate is sufficient to generate a turbulent flow in the applied 50 × 0.5 mm column with 50 μm particles. DCF and the I.S. were completely extracted by the online-SPE column and no analyte was detected in the flow through up to an elution volume of 6 mL (Fig. S1†). Salts and protein were directed to waste, and a minimal extraction time of 30 seconds corresponding to an elution of 15 void volumes of the SPE column was found to be sufficient. Thereafter, the six port valve was switched and the analytes were eluted in back-flush mode from the SPE column by the flow (50% ACN) delivered by pump 2 (Fig. 2B). DFC eluted from the SPE column in 9 s following the valve switch at a total time of 39 s (Fig. S2†). The resulting analyte peak had a very narrow shape with a full width at half maximum (FWHM) height of 3 s and showed only moderate tailing. Thus, the transfer step from SPE column to the analytical column was fully completed within 60 s. The six port valve was switched back to forward flow through the SPE column and HPLC column, allowing concurrent sample analysis and reconditioning of the SPE column (Fig. 2A). The SPE column was washed with 100% ACN for 30 s and further reconditioned for 35 s (15 void volumes), meanwhile the analytes are separated and detected. The separation was carried out on a short 50 × 2.1 mm, 1.7 μm particle filled, RP-18 column to achieve rapid separation and high resolution. The gradient was optimized to fully separate analytes from the void volume (120 μL) of the analytical column where polar matrix compounds co-extracted by SPE elute (Fig. 3 and 4). DCF eluted at a stable retention time of 95.04 ± 0.32 s with a shallow gradient from 50–60% ACN, as shown in Fig. 3. At this point, the gradient was increased from 60% to 100% ACN over 9 s and the column was washed with half a void volume to elute co-extracted non-polar compounds. These compounds eluted after the DCF peak and thus did not influence the ESI-MS signal of the analytes. Finally, the solvent composition was returned to initial conditions and the analytical column was equilibrated during the injection and SPE extraction of the next sample (Fig. 2).
Fig. 3.
SRM chromatogram of the online-SPE-LC-MS/MS system. The SRM signals of DFC (black line) and I.S. (grey line) following an injection of 20 μl of standard solution containing 15 nM DFC and 25 nM I.S. is shown.
Fig. 4.

DFC (black line) SRM chromatograms of a urine, plasma and whole blood samples mixed 1: 1 with I.S. (50 nM, grey line). The top panels show spiked samples of indicated final concentrations and the bottom panels are matrix control samples.
The DFC peak showed very narrow FWHM of 3.31 ± 0.003 s and nearly perfect Gaussian shape. Moreover, it co-elutes perfectly with the deuterated I.S. (Fig. 3). The small peaks in the SRM chromatogram eluting close to the void volume (65 s) and in the column cleaning step do not originate from DCF or the I.S. as they also occurred in blank injections (Fig. 4).
The present method allows a runtime of only 126 s, which is significantly faster than other reported online-SPE-LC-MS methods for DCF that require analysis times of 11–70 min.22,24,25,27,28 Moreover, these other methods were partially designed for water analysis.22,24,28 It is therefore unclear whether the monolithic,24 molecular imprinted polymer22 or classical RP-18 SPE28 materials used in these studies are suitable for the repeated direct injection of high protein content samples. The online SPE-LC-MS analyses described by Alnouti et al. are, to the best of our knowledge, the only existing methods with analytical speed comparable to the present study.23,26 These authors utilized a sophisticated column switching system to allow the use of disposable SPE cartridges in a total runtime of 205 s with a 5 μm particle size analytical column26 or 120 s with a monolithic column.23 The latter method is equally as fast as the method described here. However, it is disadvantageous due to the high flow rate of 3500 μL min−1 which is incompatible for direct MS coupling. Thus, a post-column split has to be integrated which decreases the sensitivity and robustness of an analytical system.
3.3 Mass spectrometric detection
Given that DCF is an acid (pKa 4.028), ESI ionisation was carried out in negative mode and the [M – H] − ion of the most abundant 35CI2-DCF isotope at m/z 294 was selected as the precursor ion. In MS/MS, DCF gave rise to a single intense fragment ion at m/z 250, originating from the loss of CO2 from the carboxyl group (Fig. 1). Thus, this rather non-specific transition must be used for quantification, and has been applied previously in various methods for the quantification of DCF by ESI(−)-MS/MS.23,26,29,31,32 In order to increase the robustness and precision of the method, isotopically labelled D4-DCF was used as an I.S. showing analogous fragmentation behaviour by ESI-MS/MS. Due to the natural abundance of 10.2% 37Cl2-DCF, the signal of the most intense transition of the I.S. ([35CI2-D4-DCF-H]− ion) at m/z 298 → 254 is effected by the DCF concentration. In order to guarantee a specific and independent detection of the I.S. signal, 37Cl35CI-D4-DCF was monitored as previously described by Sparidans et al.30 Both transitions were monitored with a dwell time of 100 ms to ensure sensitive detection with good S/N of the MS signal. More than 15 data points were collected over the FWHM of 3.3 s (Section 3.2) allowing for accurate peak integration.
3.4 Calibration and validation
The method was calibrated using a series of standard solutions prepared in water, which were treated in the same manner as sample solutions. The limit of detection (LOD, S/N = 3) for DCF was 0.15 nM (50 pg mL−1) equivalent to 6 fmol on column. The method provided a broad linear detection range over 4 orders of magnitude (R2 ≥ 0.999), indicating high extraction efficiency even for highly concentrated samples of 0.5 μM (Table 1). As shown in Table 2, the method provided high accuracy and precision with a low intra- and inter-sample variation. With this analytical performance, the present method is comparable to or better than existing online-LC-ESI-MS/MS methods for DCF with LODs of 16.7 pg mL−1,28 37 pg mL−1,24 and 2.5 ng25,27 and reported working ranges between 10–100 pg mL−1,28 25–750 ng mL−1 27 and 1–1000 ng mL−1.23 It should be noted that many of the described methods for direct LC-ESI-MS/MS analysis of DCF provide similar performance: LOD in the low nM range29,30,32 and linear working ranges from 25–300 ng mL−1 32 or 20–8000 ng mL−1.30 However, Gebhardt and Schröder reported a significantly lower LOD of 0.2 pg mL−1 31 utilizing a Orbitrap mass spectrometer, likely owing to a better S/N due to the high resolution capabilities of this detector.
Table 1.
Performance summary of the method. Observed retention time, peak width, peak width at half maximum height (FWHM), dynamic range and the limit of detection (LOD) are displayed
| Analyte | Retention time | Peak width LOD (15 nM standard) | FWHM (15 nM standard) | Dynamic range | r2 | LOD | LOD on column |
|---|---|---|---|---|---|---|---|
| DFC | 95.04 ± 0.32 s (0.33%) | 16.48 ± 0.79 s | 3.31 ± 0.15 s | 0.5–500 nM | 0.999 | 0.15 nM | 3 fmol |
Table 2.
Recovery rates of the analytes determined in spiked urine, plasma and whole blood samples. The mean of the measured concentration, the recovery rate and RSD of the analysis of 3 independent samples (inter-sample variation) is shown. Intra-sample variation is represented by the mean of the RSD of three injections of the same sample
| Matrix (spiked content) | Measured concentration/nM | Recovery rate (%) | Intra-sample RSD (%) | Inter-sample RSD (%) |
|---|---|---|---|---|
| Urine (10 nM) | 9.98 | 99.83 | 4.18 | 4.67 |
| Urine (30 nM) | 30.43 | 101.4 | 0.97 | 5.70 |
| Urine (100 nM) | 103.6 | 103.6 | 0.73 | 5.37 |
| Plasma (10 nM) | 10.57 | 105.7 | 3.80 | 8.71 |
| Plasma (30 nM) | 32.99 | 110.0 | 2.58 | 7.89 |
| Plasma (100 nM) | 102.3 | 102.3 | 2.00 | 4.93 |
| Whole blood (10 nM) | 9.95 | 99.53 | 3.19 | 1.98 |
| Whole blood (30 nM) | 30.35 | 101.2 | 2.56 | 6.64 |
| Whole blood (100 nM) | 100.3 | 100.3 | 1.63 | 3.84 |
One fundamental drawback inherent to online-SPE is the risk of carry over.3 In order to investigate carry over, the highest concentrated sample (0.5 μM) was injected and the DCF concentration in subsequent blank injections was quantified. With a determined carry over of 0.12 ± 0.03% (n = 3), which is within the acceptable performance range of the autosampler, negative influences due to carry over can be regarded as negligible.
In order to validate the method, whole blood, plasma and urine samples were spiked with DFC and analyzed like the samples. As shown in Table 2, the present method shows a near perfect accuracy in these crude samples, with a mean recovery rate of 103 ± 3%. Moreover, the method precision was remarkable with an inter-sample variation of below 5% and an intra-sample variation of below 10%. Thus, the direct injection of crude samples after addition of I.S. and centrifugation in the fully automated ultra-fast online-SPE-LC-MS/MS did not compromise the analytical performance. This rapid analytical platform is ideal for PK studies, because it is not only faster than other described online-SPE-LC-MS approaches, but also has better or comparable sensitivity, accuracy and precision.
3.5 Application in PK studies
In order to demonstrate the applicability of this method, we investigated and compared the PK of topical vs. intraperitoneal (i.p.) administration of DCF in rats. The minimal blood volume required for analysis (10 μl) (Section 3.1) enabled sample collection by serial bleeding without disturbing the fluid balance of the animals.37 Although whole blood was used in this analysis, the results were comparable to previous observations described for plasma.38,39 After i.p. (1 mg kg−1 bodyweight) administration, DCF was rapidly systematically available and the maximal concentration (Cmax) of 356 ± 63 ng mL−1 was measured after 30 min (Fig. 5B). This Cmax is consistent with the results from Reyes-Gordillo et al., who reported a plasma Cmax of about 1 μg mL−1 following i.v. administration of DCF at 3 mg kg−1 bodyweight.39 DCF is rapidly excreted, as described previously39 and after 2.4 h only half of the concentration remains in the blood. The animals receiving a six fold higher dose of topical DCF (6 mg kg−1 bodyweight) absorbed the compound slowly, which shifted the Cmax of 2713 ± 673 ng mL−1 in the blood to 1.5 h. Despite the different administration routes, the Cmax increased 7.4 fold with a six fold increase in dose, indicating good −1 of dose linearity. Taking into account the IC50 of 303 ng mL DCF for COX-1 and 505 ng mL−1 for COX-2 inhibition,40 it can be seen that the i.p. dose of 1 mg kg−1 bodyweight barely exceeds the IC50 value for COX-1 at 1.5 hours after application. However, the higher topical dose is likely to cause the desired biological effects on both enzymes for about 15 hours (Fig. 5).
Fig. 5.

Pharmacokinetic profile of diclofenac in male rats after (A) i.p. (1 mg kg−1 bodyweight) and (B) topical (6 mg kg−1 bodyweight) dosing. The values are inter-animal mean ± standard error, n = 6 per group. The dashed line represents the IC50 for COX-1. 40
This method is also well suited for the determination of PK in humans. In a pioneer study with a single male volunteer we obtained adequate data to generate a PK profile following oral administration of DCF. The compound levels were directly analysed from blood and urine with the method and the resulting PK profile was similar to what has been previously described.38 Even though these data are from a single subject, the key feature of the new method is clearly demonstrated in the generation of a full PK profile from a minimally invasive finger prick. The streamlined sample collection/preparation (Section 3.1) and fully automated online-SPE-LC-ESI-MS/MS analysis (Section 3.2–3.4) described here made this analysis of a PK study in human easy to carry out (Fig. 6). These features distinguish this method from all other online-SPE-LC-ESI-MS/MS approaches that do not emphasize the importance of the critical and also time consuming process of sample collection and plasma preparation steps. The only technique which is comparable in this respect is dried blood spot (DBS) sampling in combination with LC-MS for the detection of drug compounds.21 The ease of storage of the DBS sample cards, and the independency of exact sample volumes are unique benefits of this technique. However, for absolute quantification, the quality of dried blood samples is often a concern, because DBS analysis is dependent on blood properties such as hematocrit.21 In contrast, our simple approach of direct dilution assures a reproducible easy sample collection and can be regarded as beneficial if sampling of exact volumes and immediate analysis or storage of the samples in a freezer are possible. Nonetheless, DBS is in many cases a straightforward sampling technique and its combination with the ultra fast online-SPE-LC-MS/MS analysis, such as the one described herein, is a promising field of further research.
Fig. 6.
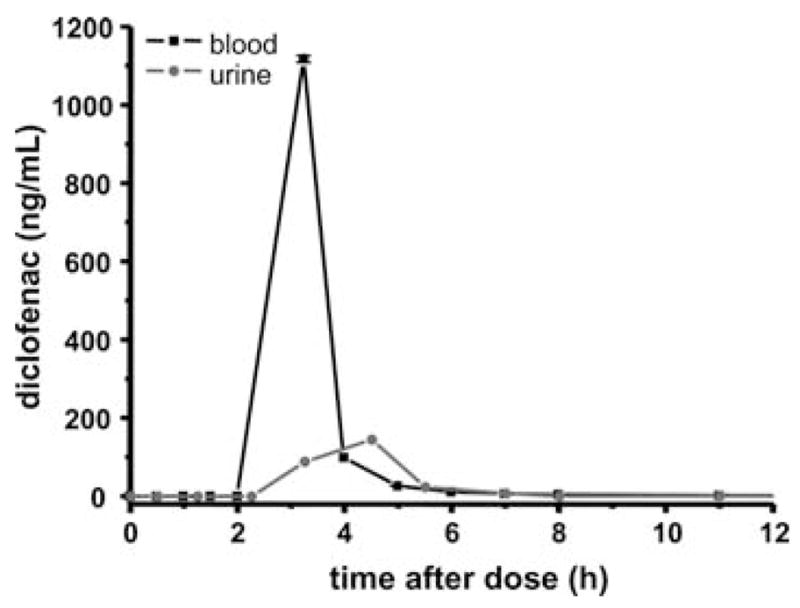
Pharmacokinetic profile of diclofenac in a healthy male human (80 kg bodyweight) after ingesting a single 50 mg oral dose. The values are means and standard deviation of injections in triplicate. Concentrations in whole blood (black line) and urine (grey line).
3.6 Application of the method to other drug compounds
The new online-LC-ESI-MS/MS method described here is not limited to the quantification of DCF. In order to demonstrate the versatility of this method, it was adapted to several structurally different compounds. Firstly, we applied the method for the analysis of rofecoxib (ROF) a selective COX-2 inhibitor. As shown in Fig. 7A and Table 3, ROF was sensitively detected and well separated from D4-DCF, which was used as an I.S. Even though D4-DCF is not an ideal I.S. for ROF, excellent recovery rates (mean: 97.5 ± 2.5%, n = 9) in spiked whole blood (10, 30 100 nM) were obtained (Table S2†). Secondly, the method was utilized for the analysis of inhibitors of the soluble epoxide hydrolase, a promising target for inflammatory and painful diseases.35,41–43 Analysis of sEHi a (1-(1-methylsulfonyl-piperidin-4-yl)-3-(4-trifluoromethoxy-phenyl)-urea) in spiked whole blood leads to a mean recovery rate of 102.3 ± 4.9%, n = 9. Here, sEHi b, a structurally similar urea derivative (Fig. 7), was used as the I.S., and was baseline separated from sEHi a (Fig. 7B). The method was successfully applied to investigate the PK of sEHi a in a group of three rats after an i.p. injection at a dose of 10 mg kg−1 (Fig. S3†). The results indicate a long half-life of more than 50 h, which is consistent with previous findings in other species.34
Fig. 7.

Application of the method on other drug candidates. Normalized SRM chromatograms of standard solutions containing 25 nM of each analyte are shown: (A) rofecoxib using D4-DCF as I.S., (B) the sEHi a and structural similar compound b as I.S., (C) sEHi c and b as I.S. and separation mixture of four sEHi d–g and DCF. The structures of ROF and the sEHi a–g are given below.
Table 3.
Application of the method on rofecoxib (ROF) and inhibitors of soluble epoxide hydrolase (sEHi) a–g (Fig. 7). The retention times, transition used for detection by ESI(−)MS/MS, limit of detection and linear range are shown
| Compound | Retention time/mina | MS/MS transition m/z | Compound MS conditions |
Limit of detection/nM | Linear range/nM | |
|---|---|---|---|---|---|---|
| DP/V | CE/V | |||||
| ROF | 1.488 | 313/285 | −65 | −24 | 0.3 | 1–1000 |
| sEHi a | 1.595 | 380/176 | −100 | −24 | 0.01 | 0.03–300 |
| sEHi b | 1.743 | 394/176 | −100 | −22 | n.d.b (I.S) | n.d.b (I.S) |
| sEHi c | 1.360 | 344/176 | −95 | −20 | 0.1 | 0.3–300 |
| sEHi d | 1.300 | 308/126 | −85 | −20 | 0.01 | 0.03–300 |
| sEHi e | 1.735 | 437/260 | −95 | −22 | 0.1 | 0.3–1000 |
| sEHi f | 1.823 | 411/137 | −115 | −34 | 0.3 | 1–1000 |
| sEHi g | 1.955 | 339/214 | −70 | −34 | 1 | 3–1000 |
RSD < 0.5%.
n.d. = not determined (I.S. compound).
Without any instrumental adaptations, the approach was suitable for the analysis of several other structurally different compounds (Fig. 7). Despite the considerably shorter retention time of sEHi c (Fig. 7) compared to the I.S. (sEHi b), excellent recovery rates of 100.9 ± 4.9% (n = 9) were achieved in whole blood samples. This underlines the extraction efficiency of the analytes from whole blood and the effective reduction of matrix interference with the ESI-MS based quantification. Similar accuracy in whole blood samples was observed when investigating samples spiked with sEHi d and sEHi e (Fig. 7, Table S2†). The successful adaptation of the method to five different compounds demonstrates that this rapid analytical approach is not limited to the detection of DCF, but can be used for various drugs with different physicochemical properties.
Furthermore, the excellent chromatographic resolution of the method allows the simultaneous analysis of multiple analytes as demonstrated in Fig. 7D. Here, four different sEH inhibitors (sEHi d–g) and DCF were separated within 2 minutes including the online-SPE. The average FWHM of 3 s for each peak, which corresponds to 4–9 × 10³ theoretical plates, underlines the extraordinarily high chromatographic resolution of this setup. Thus, the method is not only suitable for the fast quantitative analysis of single compounds. It can also be utilized for PK studies, in which several compounds are administered in a cassette dose.
4 Conclusion
A new ultra fast online-SPE-LC-ESI-MS/MS method designed for PK studies has been developed. By combining a TFC column for online SPE with a fast gradient separation using a sub-2 μm particle filled RP-18 column, a total run time of only 126 s was achieved. A unique feature of the new approach is the direct injection of whole blood after dilution and centrifugation. Only 10 μL sample volume is required, which allows blood collection from human volunteers by finger prick instead of vein puncture. The total time needed for the analysis of a single sample is about 3 minutes including sample collection, dilution and centrifugation (1 min) and online-SPE-LC-MS/MS analysis (2 min). Thus more than 400 samples can be analyzed in a single day, allowing the immediate analysis of complete sample sets for PK studies. As shown for DCF, several sEH inhibitors and rofecoxib, the analysis speed does not compromise analytical performance. The sensitivity, accuracy and precision of the method are better or comparable to previously described methods for DCF and the PK profiles obtained from both rats and humans are consistent with earlier findings.
Another key feature of this method is that no special instrumentation is required. Only a standard LC-MS system with one additional gradient HPLC pump and a six port valve is required. Despite using a sub-2 μm column, the maximum back pressure did not exceed 350 bar, which can be handled by standard LC instrumentation. Thus, the method can easily be set up in other laboratories using off the shelf technology and rapidly adapted to other analytes of interest, as demonstrated here by the analysis of a variety of sEH inhibitors.
The simplicity of this method distinguishes our approach from most of the TFC methods recently described. These other methods utilize a sophisticated column switching system involving another six port valve with a T-rotor.10–12,15,18 The same holds true for many other recently described fast online-SPE-LC-MS/MS methods which utilize special systems including the application of disposable SPE columns.23,26,44 Our findings show that the prolonged use of the same SPE column is possible in our approach. After more than 3 months of use, totaling more than 1000 injections of whole blood, plasma and urine samples there was no observed loss of efficacy. Thus, no costly consumables such as SPE cartridges are needed. Online-SPE uses relatively little solvent in comparison to offline SPE or liquid/liquid extraction. This results in reduced environmental impact in impact, because the online extraction step is carried out with pure water (Fig. 2A), minimizing the generation of hazardous waste.
To the best of our knowledge, this method is one of the fastest online-SPE-LC-ESI-MS/MS methods. Besides approaches that increase throughput by simply applying two systems in parallel, only a few methods are faster, including the approaches of Hsieh et al.45 and Zhou et al.46 with a runtime of 0.8 min and 1.5 min, respectively. However, Zhou et al. used a monolithic separation column at a flow rate of 3000 μL min−1, which is neither suitable for ESI-MS detection, nor environmentally friendly. Hsieh et al. set up a highly effective column switching system using a 10 port valve and two SPE columns, which is equally as simple as our system. The speed of their method is partly dependent on isocratic separation, which may lead to the accumulation of co-extracted non polar compounds on the separation column. Our system utilizes a full gradient separation at ESI-MS/MS compatible flow rates. Considering all of the features of our method from ease of sample collection to full gradient separation it is currently one of the most suitable approaches for an ultra fast analysis of samples in PK studies.
Supplementary Material
Acknowledgments
This study was supported by National Institute of Environmental Health Sciences (NIEHS) Training grant to KW, the NIEHS grant R01 ES002710 to BDH and the NIEHS Superfund Research Program P42 ES004699. The “German Academic Exchange Service” (DAAD, Bonn, Germany) is gratefully acknowledged for financial support in the form of a postdoc scholarship for NHS.
Footnotes
Electronic supplementary information available: Tables and chromatograms showing the performance of the method.
References
- 1.Novakova L, Vlckova H. Anal Chim Acta. 2009;656:8–35. doi: 10.1016/j.aca.2009.10.004. [DOI] [PubMed] [Google Scholar]
- 2.Xu RN, Fan L, Rieser MJ, El-Shourbagy TA. J Pharm Biomed Anal. 2007;44:342–355. doi: 10.1016/j.jpba.2007.02.006. [DOI] [PubMed] [Google Scholar]
- 3.Mullett WM. J Biochem Biophys Methods. 2007;70:263–273. doi: 10.1016/j.jbbm.2006.10.001. [DOI] [PubMed] [Google Scholar]
- 4.Liesener A, Karst U. J Sep Sci. 2005;28:1658–1665. doi: 10.1002/jssc.200500090. [DOI] [PubMed] [Google Scholar]
- 5.Du L, White RL. Rapid Commun Mass Spectrom. 2008;22:3362–3370. doi: 10.1002/rcm.3747. [DOI] [PubMed] [Google Scholar]
- 6.Quinn HM, Takarewski JJ. 97/16724. Int Pat WO. 1997
- 7.Presta MA, Bruyneel B, Zanella R, Kool J, Krabbe JG, Lingeman H. Chromatographia. 2009;69:S167–S173. doi: 10.1365/s10337-009-1132-x. [DOI] [PMC free article] [PubMed] [Google Scholar]
- 8.Siemerink M, Schebb NH, Liesener A, Perchuc AM, Schöni R, Wilmer M, Hayen H, Karst U, Vogel M. Rapid Commun Mass Spectrom. 2010;24:687–697. doi: 10.1002/rcm.4428. [DOI] [PubMed] [Google Scholar]
- 9.Smalley J, Marino AM, Xin B, Olah T, Balimane PV. J Chromatogr, B: Anal Technol Biomed Life Sci. 2007;854:260–267. doi: 10.1016/j.jchromb.2007.04.030. [DOI] [PubMed] [Google Scholar]
- 10.Turnpenny P, Fraier D, Chassaing C, Duckworth J. J Chromatogr, B: Anal Technol Biomed Life Sci. 2007;856:131–140. doi: 10.1016/j.jchromb.2007.05.032. [DOI] [PubMed] [Google Scholar]
- 11.Verdirame M, Veneziano M, Alfieri A, Di Marco A, Monteagudo E, Bonelli F. J Pharm Biomed Anal. 2010;51:834–841. doi: 10.1016/j.jpba.2009.10.005. [DOI] [PubMed] [Google Scholar]
- 12.Xu Y, Willson KJ, Anderson MD, Musson DG, Miller-Stein CM, Woolf EJ. J Chromatogr, B: Anal Technol Biomed Life Sci. 2009;877:1634–1642. doi: 10.1016/j.jchromb.2009.04.006. [DOI] [PubMed] [Google Scholar]
- 13.Krebber R, Hoffend FJ, Ruttmann F. Anal Chim Acta. 2009;637:208–213. doi: 10.1016/j.aca.2008.11.006. [DOI] [PubMed] [Google Scholar]
- 14.Zeng W, Musson DG, Fisher AL, Chen L, Schwartz MS, Woolf EJ, Wang AQ. J Pharm Biomed Anal. 2008;46:534–542. doi: 10.1016/j.jpba.2007.11.003. [DOI] [PubMed] [Google Scholar]
- 15.Xu Y, Willson KJ, Musson DG. J Chromatogr, B: Anal Technol Biomed Life Sci. 2008;863:64–73. doi: 10.1016/j.jchromb.2007.12.017. [DOI] [PubMed] [Google Scholar]
- 16.Wang S, Miller A. Clin Chem Lab Med. 2008;46:1631–1634. doi: 10.1515/CCLM.2008.303. [DOI] [PubMed] [Google Scholar]
- 17.Xin G-Z, Zhou J-L, Qi L-W, Li C-Y, Liu P, Li H-J, Wen X-d, Li P. J Chromatogr, B: Anal Technol Biomed Life Sci. 2010;878:435–441. doi: 10.1016/j.jchromb.2009.12.027. [DOI] [PubMed] [Google Scholar]
- 18.Mottier P, Hammel YA, Gremaud E, Guy PA. J Agric Food Chem. 2008;56:35–43. doi: 10.1021/jf072934d. [DOI] [PubMed] [Google Scholar]
- 19.FDA. Fed Regist. 1995;60:11264. [Google Scholar]
- 20.Rowland M, Emmons GT. AAPS J. 2010;12:290–293. doi: 10.1208/s12248-010-9188-y. [DOI] [PMC free article] [PubMed] [Google Scholar]
- 21.Li W, Tse FL. Biomed Chromatogr. 2010;24:49–65. doi: 10.1002/bmc.1367. [DOI] [PubMed] [Google Scholar]
- 22.Sun Z, Schussler W, Sengl M, Niessner R, Knopp D. Anal Chim Acta. 2008;620:73–81. doi: 10.1016/j.aca.2008.05.020. [DOI] [PubMed] [Google Scholar]
- 23.Alnouti Y, Srinivasan K, Waddell D, Bi H, Kavetskaia O, Gusev AI. J Chromatogr, A. 2005;1080:99–106. doi: 10.1016/j.chroma.2005.04.056. [DOI] [PubMed] [Google Scholar]
- 24.Bones J, Thomas K, Nesterenko PN, Paull B. Talanta. 2006;70:1117–1128. doi: 10.1016/j.talanta.2006.02.026. [DOI] [PubMed] [Google Scholar]
- 25.Suenami K, Lim LW, Takeuchi T, Sasajima Y, Sato K, Takekoshi Y, Kanno S. J Chromatogr, B: Anal Technol Biomed Life Sci. 2007;846:176–183. doi: 10.1016/j.jchromb.2006.08.041. [DOI] [PubMed] [Google Scholar]
- 26.Alnouti Y, Li M, Kavetskaia O, Bi H, Hop CE, Gusev AI. Anal Chem. 2006;78:1331–1336. doi: 10.1021/ac051806q. [DOI] [PubMed] [Google Scholar]
- 27.Suenami K, Lim LW, Takeuchi T, Sasajima Y, Sato K, Takekoshi Y, Kanno S. J Sep Sci. 2006;29:2725–2732. doi: 10.1002/jssc.200600174. [DOI] [PubMed] [Google Scholar]
- 28.Kot-Wasik A, Debska J, Wasik A, Namiesnik J. Chromatographia. 2006;64:13–21. [Google Scholar]
- 29.Dowling G, Gallo P, Malone E, Regan L. J Chromatogr, A. 2009;1216:8117–8131. doi: 10.1016/j.chroma.2009.05.004. [DOI] [PubMed] [Google Scholar]
- 30.Sparidans RW, Lagas JS, Schinkel AH, Schellens JH, Beijnen JH. J Chromatogr, B: Anal Technol Biomed Life Sci. 2008;872:77–82. doi: 10.1016/j.jchromb.2008.07.012. [DOI] [PubMed] [Google Scholar]
- 31.Gebhardt W, Schröder HF. J Chromatogr, A. 2007;1160:34–43. doi: 10.1016/j.chroma.2007.05.075. [DOI] [PubMed] [Google Scholar]
- 32.Vinci F, Fabbrocino S, Fiori M, Serpe L, Gallo P. Rapid Commun Mass Spectrom. 2006;20:3412–3420. doi: 10.1002/rcm.2748. [DOI] [PubMed] [Google Scholar]
- 33.Jones PD, Tsai HJ, Do ZN, Morisseau C, Hammock BD. Bioorg Med Chem Lett. 2006;16:5212–5216. doi: 10.1016/j.bmcl.2006.07.009. [DOI] [PMC free article] [PubMed] [Google Scholar]
- 34.Tsai HJ, Hwang SH, Morisseau C, Yang J, Jones PD, Kasagami T, Kim IH, Hammock BD. Eur J Pharm Sci. 2010;40:222–238. doi: 10.1016/j.ejps.2010.03.018. [DOI] [PMC free article] [PubMed] [Google Scholar]
- 35.Inceoglu B, Jinks SL, Schmelzer KR, Waite T, Kim IH, Hammock BD. Life Sci. 2006;79:2311–2319. doi: 10.1016/j.lfs.2006.07.031. [DOI] [PMC free article] [PubMed] [Google Scholar]
- 36.Schebb NH, Fischer D, Hein EM, Hayen H, Krieglstein J, Kumpp S, Karst U. J Chromatogr, A. 2008;1183:100–107. doi: 10.1016/j.chroma.2008.01.033. [DOI] [PubMed] [Google Scholar]
- 37.Karl-Heinz D, Robin H, David M, Rudolf P, Yvon R, David S, Jean-Marc V, Cor Van De V. J Appl Toxicol. 2001;21:15–23. [Google Scholar]
- 38.Willis JV, Kendall MJ. Scand J Rheumatol. 1978;22:36–41. doi: 10.3109/03009747809097214. [DOI] [PubMed] [Google Scholar]
- 39.Reyes-Gordillo K, Muriel P, Castaneda-Hernandez G, Favari L. Biopharm Drug Dispos. 2007;28:415–422. doi: 10.1002/bdd.569. [DOI] [PubMed] [Google Scholar]
- 40.Barnett J, Chow J, Ives D, Chiou M, Mackenzie R, Osen E, Nguyen B, Tsing S, Bach C, Freire J, et al. Biochim Biophys Acta. 1994;1209:130–139. doi: 10.1016/0167-4838(94)90148-1. [DOI] [PubMed] [Google Scholar]
- 41.Imig JD, Hammock BD. Nat Rev Drug Discovery. 2009;8:794–805. doi: 10.1038/nrd2875. [DOI] [PMC free article] [PubMed] [Google Scholar]
- 42.Inceoglu B, Jinks SL, Ulu A, Hegedus CM, Georgi K, Schmelzer KR, Wagner K, Jones PD, Morisseau C, Hammock BD. Proc Natl Acad Sci U S A. 2008;105:18901–18906. doi: 10.1073/pnas.0809765105. [DOI] [PMC free article] [PubMed] [Google Scholar]
- 43.Schmelzer KR, Inceoglu B, Kubala L, Kim IH, Jinks SL, Eiserich JP, Hammock BD. Proc Natl Acad Sci U S A. 2006;103:13646–13651. doi: 10.1073/pnas.0605908103. [DOI] [PMC free article] [PubMed] [Google Scholar]
- 44.Niederlander HA, Koster EH, Hilhorst MJ, Metting HJ, Eilders M, Ooms B, de Jong GJ. J Chromatogr, B: Anal Technol Biomed Life Sci. 2006;834:98–107. doi: 10.1016/j.jchromb.2006.02.042. [DOI] [PubMed] [Google Scholar]
- 45.Hsieh S, Tobien T, Koch K, Dunn J. Rapid Commun Mass Spectrom. 2004;18:285–292. doi: 10.1002/rcm.1327. [DOI] [PubMed] [Google Scholar]
- 46.Zhou S, Zhou H, Larson M, Miller DL, Mao D, Jiang X, Naidong W. Rapid Commun Mass Spectrom. 2005;19:2144–2150. doi: 10.1002/rcm.2037. [DOI] [PubMed] [Google Scholar]
Associated Data
This section collects any data citations, data availability statements, or supplementary materials included in this article.