

Abstract
Gene duplication is believed to be an important evolutionary mechanism for generating functional diversity within genomes. The accumulated products of ancient duplication events can be readily observed among the genes encoding voltage-dependent Ca2+ ion channels. Ten paralogous genes have been identified that encode isoforms of the α1 subunit, four that encode β subunits, and three that encode α2δ subunits. Until recently, only a single gene encoding a muscle-specific isoform of the Ca2+ channel γ subunit (CACNG1) was known. Expression of a distantly related gene in the brain was subsequently demonstrated upon isolation of the Cacng2 gene, which is mutated in the mouse neurological mutant stargazer (stg). In this study, we sought to identify additional genes that encoded γ subunits. Because gene duplication often generates paralogs that remain in close syntenic proximity (tandem duplication) or are copied onto related daughter chromosomes (chromosome or whole-genome duplication), we hypothesized that the known positions of CACNG1 and CACNG2 could be used to predict the likely locations of additional γ subunit genes. Low-stringency genomic sequence analysis of targeted regions led to the identification of three novel Ca2+ channel γ subunit genes, CACNG3, CACNG4, and CACNG5, on chromosomes 16 and 17. These results demonstrate the value of genome evolution models for the identification of distantly related members of gene families.
[The sequence data described in this paper have been submitted to the GenBank data library under accession numbers AF142618–AF142625 and AF148220.]
Voltage-dependent Ca2+ channels couple membrane depolarization in a wide variety of cellular processes, including action potential generation, neurotransmitter and hormone release, muscle contraction, neurite outgrowth, synaptogenesis, Ca2+-dependent gene expression, synaptic plasticity, and cell death. This broad range of biological activity is regulated by distinct channel subtypes whose biophysical properties are determined predominantly by subunit isoform composition. Ca2+ channels are believed to be heteromultimers of α1, β, α2δ, and γ subunits that associate in a 1:1:1:1 stoichiometry (De Waard et al. 1996). To date, 10 genes have been identified and localized that encode isoforms of the pore-forming α1 subunit (α1A–α1I, α1S; Chin et al. 1991; Powers et al. 1991; Drouet et al. 1993; Gregg et al. 1993a; Iles et al. 1993; Diriong et al. 1995; Fisher et al. 1997; Cribbs et al. 1998; Perez-Reyes et al. 1998; Lee et al. 1999), 4 that encode β subunits (β1–4; Gregg et al. 1993b; Collin et al. 1994; Taviaux et al. 1997), 3 that encode α2δ subunits (α2δ1–3; Powers et al. 1994; Klugbauer et al. 1999), and 2 that encode γ subunits (γ1, γ2; Powers et al. 1993; Letts et al. 1998). All but the two skeletal muscle isoforms, α1S and γ1, are expressed in the central nervous system (CNS).
Until recently, only a single gene encoding a muscle-specific Ca2+ channel γ subunit was known (CACNG1). Subsequent isolation of the molecular defect in the mouse neurological mutant stargazer (stg) identified a second γ subunit gene, Cacng2, expressed exclusively in the CNS (Letts et al. 1998). Expression of a single isoform in neurons distinguishes the γ subunit from other Ca2+ channel subunits, which utilize genetic heterogeneity as an important mechanism for generating functional diversity in these cells. In addition, the expression of significant levels of either CACNG1 or CACNG2 mRNA has not been reported in tissues such as heart, kidney, and testis, which express high levels of other Ca2+ channel subunits and produce measurable Ca2+ currents (Jay et al. 1990; Letts et al. 1998). We therefore hypothesized the existence of additional γ subunit genes. The low level of amino acid identity between the γ1 and γ2 proteins suggested that novel γ subunit paralogs might be difficult to identify using gene isolation methods dependent only on nucleic acid hybridization, such as low-stringency cross-hybridization to known γ subunit cDNA fragments or PCR amplification between conserved domains using degenerate oligonucleotides. An alternative approach based on the use of similarity search algorithms to screen genome-wide sequence databases for homologous genes can be utilized, but this sometimes produces large numbers of ambiguous identifications when low levels of homology are predicted and low-stringency search criteria are employed. We hypothesized that a modification of genome-wide database searching might prove useful under these conditions. To test this, we applied a search paradigm based on sequence similarity analyses but restricted to small genomic regions predicted by gene duplication models as likely locations of unidentified γ subunit genes.
The expansion of gene families through evolution is thought to rely on two principal mechanisms of gene duplication (Ohno 1970; Nadeau and Sankoff 1997). Tandem duplication generates paralogs that often remain in close proximity on the same chromosome. Chromosome or whole-genome duplication results in the simultaneous duplication of many genes, which retain their initial order on paralogous daughter chromosomes. Both models were used to predict the most likely locations of additional γ subunit genes. We then performed an extensive low-stringency comparative analysis of CACNG1 and CACNG2 cDNA and amino acid sequences to all available genomic sequences localized to the predicted regions. We report the identification of three novel Ca2+ channel γ subunit genes, CACNG3, CACNG4, and CACNG5, on chromosomes 16 and 17. Phylogenetic analysis supports a complex model of γ subunit gene family evolution requiring a minimum of two ancient tandem duplications that preceded at least two chromosome duplication events. The identification of expressed sequences in the brain corresponding to CACNG3 and CACNG4 suggests that the γ subunit, like the α1, β, and α2δ subunits, regulates Ca2+ currents in the CNS from multiple genetic loci.
RESULTS
Three Novel Members of the Ca2+ Channel γ Subunit Gene Family
The Ca2+ channel γ subunit genes CACNG1 and CACNG2 are located on chromosome bands 17q24 and 22q12–q13, respectively (Iles et al. 1993; Powers et al. 1993; Letts et al. 1998). We reasoned that any unidentified paralogous genes generated by tandem duplication would most likely have remained close to CACNG1 and CACNG2 in these regions throughout evolution. Chromosome band 16p11–p13 was the only additional genomic region we identified that contained several genes with paralogs on 17q11–q25 and 22q11–q24 (Giles et al. 1998) and was therefore a good candidate location for γ subunit genes created by ancient chromosome or whole-genome duplications. A target sequence database was constructed that contained only those human genomic sequences from the GenBank database that could be localized unambiguously to the paralogous chromosome bands 17q11–q25, 22q11–q24, and 16p11–p13 (Methods). The estimated number of nonredundant sequence residues contained in this target region database (∼1.5 × 10⁷) comprised <0.6% of the total number of sequence residues contained in the concurrent release of GenBank (release 110.0; 2.57 × 10⁹).
Low-stringency similarity searches of the target database with human CACNG1 and mouse Cacng2 sequences identified exons of the genes CACNG1 (17q24) and CACNG2 (22q12–q13), as expected. Several additional related sequences were identified that were clearly distinct from CACNG1 and CACNG2 but were organized into similar gene structures. One of these putative genes was identical to a gene product located on chromosome band 16p12–p13.1 that had been predicted previously by automated gene identification programs associated with large-scale genome sequencing efforts (GenBank accession no. AAC15246). Because this gene shared significant sequence similarity with the Ca2+ channel γ1 and γ2 subunits, was organized into an intron–exon configuration identical to CACNG1 and CACNG2, and was located within a paralogous chromosome region, we tentatively designated it CACNG3 as a novel member of this gene family. The remaining sequences with similarity to CACNG1 and CACNG2 were all located on chromosome 17 and were derived from two partially overlapping bacterial artificial chromosome (BAC) clones that also contained the CACNG1 gene. These sequences were organized into two putative genes that were nearly identical in structure to CACNG1, CACNG2, and CACNG3 and were designated CACNG4 and CACNG5 (Fig. 1).
Figure 1.
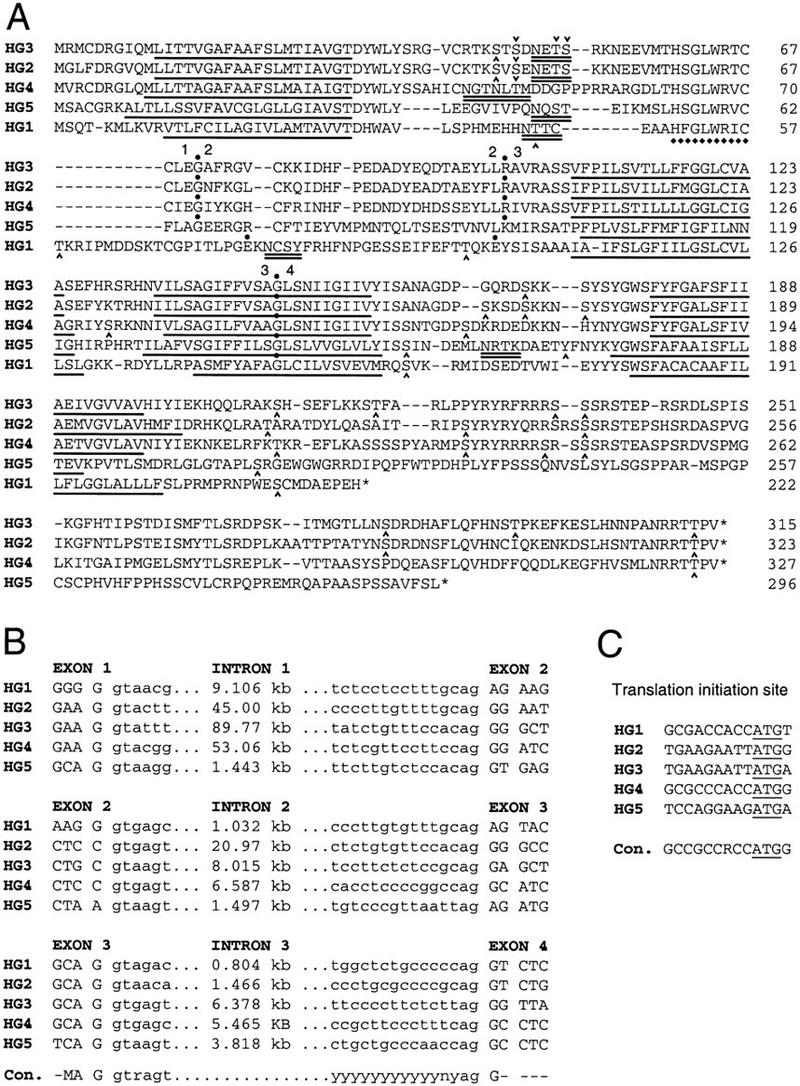
(A) Amino acid alignment of the voltage-dependent Ca2+ channel γ1–5 subunits. The relative positions of the three introns are indicated by dots, and the adjacent exons are numbered 1–4. The location of putative transmembrane domains predicted by the program TMpred (Hofmann and Stoffel 1993) are underlined (see Fig. 2). Dashes indicate gaps introduced to maintain optimal alignment. HG1, 2, 3, 4, and 5 were translated from sequences of the human genes CACNG1–CACNG5, respectively, with conceptual splicing at positionally conserved splice sites. Consensus N-glycosylation sites are double-underlined. Potential phosphorylation sites, indicated by carets (^), are consensus targets for one or more of the following: cAMP/cGMP-dependent protein kinase (Prosite PDOC00004), protein kinase C (PDOC00005), casein kinase II (PDOC00006), and tyrosine kinase (PDOC00007). Potential protein kinase C phosphorylation sites at amino acids 50 and 51 of HG2 are not marked. A single nontransmembrane region of well-conserved amino acid sequence is indicated by diamonds (♦). (B) Comparison of the intron–exon splice junctions and intron sizes of the human CACNG1–5 genes (HG1–5). Exon sequences are in uppercase letters; intron sequence in lowercase. Consensus splice acceptor and donor motifs (Mount 1982) are indicated at the bottom. (C) Alignment of CACNG1–5 translation initiation sites. The consensus translation initiation motif (Kozak 1984) is shown at the bottom. The putative first methionine codon is underlined. The sequences of the CACNG2 and CACNG3 genes are identical for 9 nucleotides preceding the start codon; however, this sequence is a poor match to the consensus (thymine is the most uncommon residue at positions −1 and −2 of vertebrate translation start sites, 9% and 11%, respectively). (M) A or C; (R) purine; (Y) pyrimidine; (N) any base.
The existing annotation of CACNG3 as an unknown gene product within its larger genomic sequence database entry distinguished it from CACNG4 and CACNG5 sequences, which were not annotated as potential genes. This difference reflects the fact that a subset of sequencing centers do not routinely perform or report gene identification analysis of large genomic sequences using methods such as XGRAIL, Genefinder, and Genscan. To determine if these analyses would have predicted CACNG4 and CACNG5, we analyzed the relevant genomic sequences (GenBank accession nos. AC005544 and AC005988) with the Genscan program (Burge and Karlin 1997, 1998). Using default parameters, Genscan predicted the structure of both CACNG4 and CACNG5. The accuracy was generally high, although variable among different exons. The borders of exons 1, 2, and 3 were predicted exactly as shown in Figure 1, while the Genscan-predicted end of exon 4 was 6 bp short for CACNG4 and 321 bp short for CACNG5. P values were >0.99 for each of the predicted exons except exon 4 of CACNG4 (P = 0.128) and exon 1 of CACNG5 (P = 0.425). Genscan also predicted the promoter region of both genes upstream of the first exon.
Identification of Expressed Sequences from CACNG3, CACNG4, and CACNG5
Although comparisons based on sequence, gene structure, open reading frame, and chromosome location supported the inclusion of CACNG3, CACNG4, and CACNG5 in the Ca2+ channel γ subunit gene family, we sought additional evidence that these loci encoded functional genes rather than pseudogenes. The identification of several expressed sequence tags (ESTs) representing CACNG3 and CACNG4 was consistent with transcription and splicing of these genes as predicted by the genomic sequence motifs. ESTs corresponding to the 5′ UTR (GenBank accession nos. H38324 and T07086) and 3′ UTR (H38292, T23680, H04803, and H11477) of CACNG3 were identified by sequence similarity searches of GenBank. Three of the four 3′ ESTs terminated in poly(A) sequences 31 bp downstream of a consensus polyadenylation motif, ATTAAA. Three additional ESTs spanned the coding region of CACNG3 (W29095, H11833, and H04905) and confirmed the splicing of all three predicted introns. The mRNA source of the ESTs was fetal adult brain tissue (except for a single cDNA derived from adult retina) and suggested that CACNG3 was expressed in neurons or glia. CACNG4 was also represented in GenBank by multiple human ESTs, corresponding to the 3′ UTR (M78316 and AI207906) and the protein coding region (AA970202, AI423159, and AI146595). The sequence of one EST spanned exons 3 and 4 of CACNG4 and confirmed that mRNA from this gene was also spliced as predicted. The CACNG4 ESTs were derived from fetal brain, glioblastoma, and oligodendroglioma cDNA libraries, suggesting that this gene, like CACNG3, was also expressed in neurons or glia. We did not identify any EST or cDNA sequences in GenBank or other sequence databases corresponding to CACNG5. To determine if this gene was expressed, we generated oligonucleotide primers corresponding to exon 3 and exon 4 of the CACNG5 genomic sequence and screened cDNA libraries by PCR. A single product of the expected size was amplified from a human fetal kidney cDNA library. Sequencing of this product demonstrated that it was identical to the predicted spliced cDNA of CACNG5, and confirmed that this gene was transcribed and the mRNA was processed (GenBank accession no. AF148220).
We further sought to determine if sequence from the promoter regions of CACNG3, CACNG4, and CACNG5 contained consensus transcription factor binding motifs that might be useful for predicting tissue-specific expression patterns. However, although web-based promoter analysis programs (Methods) were successful in identifying numerous potential binding sites for various proteins, we did not identify any patterns that predicted the preferred transcription of these genes in specific tissues or in response to specific stimuli (data not shown).
Phylogenetic Relationships
Although the skeletal muscle γ1 and neuronal γ2 subunits exhibited low amino acid identity (∼25%), the predicted transmembrane topologies were nearly indistinguishable (Letts et al. 1998), suggesting strong selective constraints on this aspect of secondary structure. We extended this analysis to include the γ3, γ4, and γ5 subunits. Examination of all five isoforms predicted very similar transmembrane topologies for γ1, γ2, γ3, γ4, and γ5 (Fig. 2). The presence of greater amino acid identity within the putative transmembrane domains, as compared to other regions of the protein, was consistent with selective conservation of sequence identity in these regions (Fig. 1). Comparison of the hydrophobicity plots indicated that γ2, γ3, and γ4 were more similar to each other in secondary structure than to γ1 or γ5, and that γ5 was intermediate in structure between γ1 and the others. This was somewhat unexpected, because CACNG2, CACNG3, and CACNG4 are each located on different chromosomes (chromosomes 22, 16, and 17, respectively), and CACNG4 is located between CACNG1 and CACNG5 on chromosome 17.
Figure 2.

Comparison of transmembrane topologies of Ca2+ channelγ1–5 subunits predicted by the TMpred program (Hofmann and Stoffel 1993). Positive TMpred values (y-axis, ×1000) indicate likely membrane spanning segments. Amino acid position is shown on the x-axis. All five γ subunit isoforms are predicted to contain four transmembrane domains with amino and carboxyl termini located intracellularly.
To clarify the evolutionary relationship among these genes, a phylogenetic analysis of γ subunit amino acid sequences was conducted under the assumption of maximum parsimony (Fig. 3A). The mouse protein Claudin 4, which we determined to be distantly related to the Ca2+ channel γ subunits by comparative sequence analysis, was defined as the out- group. The recently identified Claudin proteins comprise a family of four-transmembrane-domain proteins believed to be important in the formation of tight junctions (Morita et al. 1999). The topology of the inferred tree was consistent with the hydrophobicity analysis and strongly supported a close relationship between γ2 and γ3. The remaining branchpoints were also inferred with high confidence levels and indicated the branching of γ4, γ5, and γ1 in reverse chronological order from the γ2 − γ3 node. These relationships were concordant with the levels of pairwise amino acid identity among the proteins (Fig. 3B).
Figure 3.
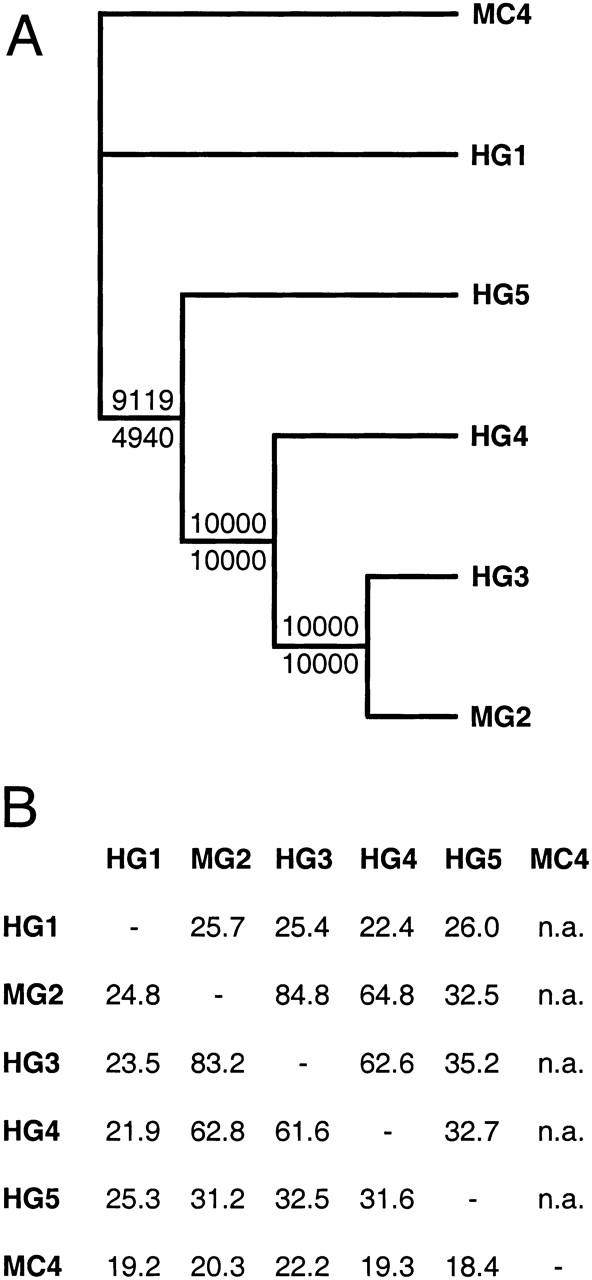
(A) Molecular phylogeny of the Ca2+ channel γ subunit family. The alignment used to infer the tree was done independently for full-length proteins and for conserved regions alone (defined as translation start to the final residue of the fourth predicted transmembrane domain), and resulted in identical topologies. The number of trees with a particular node among 10,000 bootstrap replicates is indicated at the node (values for conserved domain trees shown above the horizontal line and for full length proteins below). A member of the related Claudin protein family, Claudin 4, was included in the comparison and defined as the out-group. Branch lengths are arbitrary and do not correspond to genetic distances. This tree is unrooted. (B) Pair-wise amino acid identity among the Ca2+ channel γ1–5 subunits and mouse Claudin 4. Percent identity determined after alignment by the BLAST2 program is shown above the horizontal and by the ALIGN program below the horizontal. Homology between Claudin 4 and the γ subunits was below the threshold of detection by BLAST2. (MC4) Mouse Claudin 4; HG1, 3, 4, and 5 refer to human Ca2+ channel γ subunits; MG2 refers to the mouse γ2 subunit; (n.a.), not applicable.
Our data suggested a model of Ca2+ channel γ subunit gene family evolution in which at least two ancient tandem gene duplications preceded the chromosome duplication events that led to the modern chromosome regions 17q11–q25, 22q11–q24, and 16p11–p13 (Fig. 4). The phylogenetic clustering of γ2 (chromosome 22) with γ3 (chromosome 16), and their more distant relationship to γ4 (chromosome 17), could be interpreted as evidence of more recent divergence between chromosomes 22 and 16. A logical extrapolation would be that other paralogous genes on chromosomes 16 and 22 would also be more closely related to each other, on average, than to any paralogs on chromosome 17. To investigate this hypothesis further, we examined sequences immediately surrounding the γ subunit genes on these three chromosomes. Several additional genes were identified, but comparisons among these failed to support a more recent divergence between chromosomes 16 and 22. In fact, the presence of paralogous protein kinase C genes (PRKCB1 and PRKCA) immediately telomeric of CACNG3 and CACNG5, respectively, and the absence of a PRKC paralog telomeric of CACNG2 on chromosome 22,supported a greater similarity between chromosomes 16 and 17 in these regions (Fig. 5). To resolve this ambiguity, we carried out a comprehensive comparison of paralogous genes located on chromosome bands 17q11–q25, 22q11–q24, and 16p11–p13, including some novel loci that were identified through analysis of our regionally restricted target sequence database (Table 1). However, although the data demonstrated a clear relationship among all three chromosome regions, their ancestral relationships remained equivocal and additional studies will be needed to clarify this issue.
Figure 4.

A model of Ca2+ channel γ subunit gene family evolution. Integration of chromosome locations and molecular phylogeny data suggest a minimum of two tandem duplications of an ancestral γ subunit gene, followed by two duplications of the precursor of modern chromosome bands 16p11–p13, 17q11–q25, and 22q11–q24. Four potential genes suggested by the model (C′, C′′, A′, and A′′) but not identified in this study may have been lost during evolution sometime after the duplication indicated by arrow 3. Arrows 1 and 2 indicate tandem gene duplication events. Arrows 3 and 5 indicate regional (chromosome or whole genome) duplications. Letters (A, B, C) and symbols (′ , ′′) designate inferred ancestors of modern γ subunit genes.
Figure 5.

(A–C) Physical maps of the region surrounding the human Ca2+ channel γ subunit genes. Genomic sequences are indicated by thin lines below the name of the associated clone, with selected markers shown below. (●) Sequence overlap; (○) end sequences associated only with a single parent clone in GenBank. Characterized genes are represented by thick lines, with transcriptional orientation indicated by arrowheads. PRKCB1 is interrupted by a gap in the genomic sequence of unknown length. Only the 3′ ends of PRKCA and ORFA05 are currently represented in GenBank. (CBP–P22) calcineurin-related gene; (PRKCB1) protein kinase C β1; (CACNG3) calcium channel γ3; CSF2RB colony-stimulating factor 2 receptor β; (NCF4) neutrophil cytosolic factor 4; (PVALB) parvalbumin; (HSRASR) similar to H. sapiens RAY1 gene; (CACNG2) calcium channel γ2; (HPSP1) Hermansky–Pudlak syndrome pseudogene; (EIF3–P66) eukaryotic translation initiation factor 3, subunit 7 (ζ, 66/67 kD); (TRX2) thioredoxin 2; (PRKCA) protein kinase C α; (G6PDP1) formerly G6PDL, glucose-6-phosphate dehydrogenase pseudogene 1; (CACNG5) calcium channel γ5; (CACNG4) calcium channel γ4; (CACNG1), calcium channel γ1; (ORFA05) hypothetical myeloid cell line protein 5. StsG25737 represents an EST of CACNG3. Complete clone names and database accession numbers are given in Methods. (D–F) Comparison of the intron–exon structure of CACNG1–5. The scale bar in D applies to D–F.
Table 1.
Paralogous Genes Located Within Duplicated Regions on Chromosomes 16p11–p13, 17q11–q25, and 22q11–q24
| Chromosome 16 | Chromosome 17 | Chromosome 22 | ||||||
|---|---|---|---|---|---|---|---|---|
| gene | RH map | cytologenetic | gene | RH map | cytologenetic | gene | RH map | cytologenetic |
| ARHGDIG | 19.85 | 16p13.3 | ARHGDIA | 537.27 | 17q25.3 | |||
| CSNK1D | 501.76–539.58 | 17q25 | CSNK1E | 131.36 | 22q12–q13 | |||
| SSTR5 | 25.14 | 16p13.3 | SSTR2 | 460.32 | 17q24 | SSTR3 | 111.72–124.01 | 22q13.1 |
| CACNA1H | 44.93–65.94 | 16p13.3 | CACNA1G | 347.18–351.66 | 17q22 | CACNA1I | 137.86–138.61 | 22q12.3–q13.2 |
| SYNGR3 | 65.01–65.33 | 16p13.3 | SYNGR2 | N.D. | 17qtel | SYNGR1 | 138.19 | 22q13 |
| RPL3L | 65.01 | 16p13.3 | RPL3 | 138.19 | 22q13 | |||
| CREBBP | 62.52–68.90 | 16p13.3 | EP300 | N.D. | 22q13.2 | |||
| SOX9 | 448.88–466.09 | 17q24.3–q25.1 | SOX10 | 115.15 | 22q13 | |||
| GRIN2A | 95.4–100.92 | 16p13.2 | GRIN2C | N.D. | 17q24–q25 | |||
| PMM2 | N.D. | 16p13.3–p13.2 | PMM1 | 126.67–138.78 | 22q13.1 | |||
| TOP3L** | 191.15 | 16p11.2 | TOP3B | N.D. | 22q11 | |||
| CRYM | 191.25–192.97 | 16p13.11–p12.3 | CRYBA1 | N.D. | 17q11.1–q12 | CRYBA4 | 72.13–76.42 | 22q12.1 |
| CRYBB1 | 72.13–76.42 | 22q11.2–q12.1 | ||||||
| CRYBB2 | 72.13–76.42 | 22q11.2–q12.1 | ||||||
| CRYBB3 | 72.13–76.42 | 22q11.2–q12.1 | ||||||
| PRKCB1 | 197–200.56 | 16p11.2 | PRKCA | 421.67 | 17q22–q23.2 | |||
| CACNG3** | 197 | 16p12–13.1 | CACNG5** | 421.16 | 17q24 | CACNG2 | 112 | 22q12–q13 |
| CACNG4** | 421.16 | 17q24 | ||||||
| CACNG1 | 421.16 | 17q24 | ||||||
| TBX6 | N.D. | 16p11.2 | TBX2 | 371.45 | 17q23 | TBX1 | N.D. | 22q11.2 |
| TBX4* | 385.31 | 17q23 | ||||||
| TBRL** | 338.95 | 17q23 | ||||||
| CLTC | 376.31–377.45 | 17q11–qter | CLTCL | N.D. | 22q11.2 | |||
RH map values refer to 3000 cR on the Genebridge4 (GB4) radiation hybrid mapping panel (Gyapay et al. 1996; Deloukas et al. 1998; GeneMap '98). Cytogenetic locations are from OMIM. (*) Previously identified but not mapped. (**) Novel genes identified in this study. (ARHGDI) Rho gdp-dissociation inhibitor; (CSNK) casein kinase; (SOX) SRY (Sex determining region Y)-box; (SSTR) somatostatin receptor; (SYNGR) synaptogyrin; (RPL3L) ribosomal protein, L3-like; (RPL3) ribosomal protein L3; (CREBBP) CREB-binding protein; (EP300) E1A binding protein p300; (CACN) voltage-gated calcium channel; (GRIN) ionotropic glutamate receptor; (PMM) phosphomannomutase; (TOP) topoisomerase; (CRY) crystallin; (PRKC) protein kinase C; (TBX) T-box transcription factor; (TBR) T-box brain protein; (CLT) clathrin; (N.D.) not determined. New gene symbols were approved by the HUGO/GDB Nomenclature Committee.
DISCUSSION
We applied two models of gene family expansion, tandem duplication and chromosome duplication, to facilitate the identification of three novel members of the Ca2+ channel γ subunit gene family: CACNG3, CACNG4, and CACNG5. The aim of this approach was to maximize the likelihood of correct gene identifications by low-stringency similarity searches of localized DNA sequences and reduce the large number of biologically irrelevant matches usually generated by genome-wide database analysis. The amino acid identity between the γ1 subunit and the γ3, γ4, and γ5 subunits was 22%–26%. This low degree of similarity may explain why the CACNG3, CACNG4, and CACNG5 genes were previously undetected by standard whole-genome database searches, which often employ higher stringency alignment parameters as the default criteria for defining similarity. In contrast, the amino acid identity between the γ2 subunit and the γ3, γ4, and γ5 subunits was variable, measuring 84%, 64%, and 32%, respectively. Recently, Black and Lennon (1999) also identified the CACNG3 gene by computer similarity searches of genomic sequence databases using the human CACNG2 sequence as the query. The high degree of similarity between γ2 and γ3 (84%), and the pre-existing GenBank annotation of γ3 as an unknown gene product, may have facilitated identification of CACNG3 using standard search parameters. The fact that the CACNG4 and CACNG5 genes were not detected by that approach, although they are both located within 100 kb of CACNG1, demonstrates the value of gene duplication models for predicting gene location and improving gene identification efficiency. The additional observation that both CACNG4 and CACNG5 would have been predicted by gene identification software such as Genscan, underscores the importance of improved genomic sequence annotation.
Although our approach was successful in identifying CACNG3, CACNG4, and CACNG5, there are important limitations to its efficacy. Foremost, many paralogous members of gene families are not located in tandem or in duplicated chromosomal regions that exhibit conserved gene order with other family members. Some of these paralogs may have been generated by gene duplication mechanisms not considered in the model we employed. For example, genes duplicated by retrotransposition via an mRNA intermediate could theoretically insert anywhere in the genome with respect to the parental gene. In most cases, however, it seems probable that complex genomic rearrangements occurring over large time scales have obliterated the initial positional relationships among distantly related genes. Predictions of paralogous gene locations based on common duplication models will, by design, exclude such genes. This approach should therefore be considered primarily as a complement to other sequence-based gene identification techniques.
Role of γ Subunits in Ca2+ Channel Function
Two of the three genes identified in this study, CACNG3 and CACNG4, were represented by several ESTs derived from brain mRNA. We found expressed sequences corresponding to CACNG5 by PCR amplification of a human fetal kidney cDNA library but did not exclude the possibility of CACNG5 expression in the brain or other tissues. It is worth noting that several tissues that express multiple α1, β, and α2δ subunit isoforms, including testes, ovary, lung, pancreas, spleen, liver, and kidney, do not express γ1 or γ2 (Biel et al. 1990; Jay et al. 1990; Castellano and Perez-Reyes 1994; Yu 1995; Williams et al. 1999). The γ3, γ4, and γ5 isoforms are possible components of Ca2+ channels in these tissues. The coexpression of multiple isoforms of α1, β, and α2δ subunits in individual neurons is a valuable mechanism for generating functional variability among Ca2+ channels in brain, and our data suggest that the γ subunit could contribute to channel diversity in a similar manner. For example, the mouse Cacng2 gene is widely expressed in the brain (Letts et al. 1998) and may be coexpressed in some regions with the mouse homologs of CACNG3 and CACNG4. If this is confirmed, then it will be important to examine the relative contributions of each γ subunit isoform to the structure and function of distinct Ca2+ channel types in vivo. A comprehensive comparative analysis of γ subunit gene expression in the brain and other tissues will provide insight into the physiological role of these isoforms. Confirmation will ultimately require the demonstration that the predicted γ3, γ4, and γ5 proteins can directly modulate channel biophysical properties, or influence the stability or subcellular localization of the channel complex.
Less is understood about the function of the Ca2+ channel γ subunit than about α1, β, and α2δ. Coexpression of the cardiac α1 subunit (α1C) with the skeletal muscle γ1 isoform was used to demonstrate that it shifted the inactivation curve of the channel to negative potentials and accelerated current inactivation without significantly affecting other voltage-dependent properties (Singer et al. 1991; Eberst et al. 1997). Another study indicated that the γ1 subunit did not have a significant effect on α1C-mediated channel currents unless coexpressed with a β subunit (Wei et al. 1991). Coexpression analysis of the γ2 subunit, which is disrupted in the mouse neurological mutant stg, showed that it increased the steady-state inactivation of α1A-containing Ca2+ channels (Letts et al. 1998). Sequence similarity to γ1 and γ2 supports a prediction that the γ3, γ4, and γ5 proteins may also regulate the inactivation properties of Ca2+ channels. In general, the effects of γ subunit regulation on Ca2+ currents that have been described are small in magnitude (Walker and De Waard 1998). However, if modulation of channel properties is dependent on the coexpression of specific α1 and γ isoforms, the experimental results described above may not accurately represent γ subunit function in vivo. For example, the skeletal muscle γ1 isoform is not expressed at high levels in heart with the cardiac α1C isoform, and it is not known whether the γ2 isoform actually associates with α1A in the brain, although both are widely coexpressed (Tanaka et al. 1995; Letts et al. 1998). Instead, it is possible that other γ subunit isoforms associate preferentially with α1C and α1A in vivo. Functional coexpression of γ3, γ4, and γ5 in combination with various α1, β, and α2δ isoforms in vitro may illustrate distinct regulatory functions for the γ subunit, whereas coimmunoprecipitation analysis of different tissues or brain regions will be helpful in determining which isoforms are associated preferentially in vivo. It is also worth noting that Ca2+ channel γ subunits exhibit a low level of amino acid identity and similar hydrophobicity profiles to several Claudin proteins, to the lens intrinsic membrane protein MP20, and to peripheral myelin protein PMP22 (data not shown). However, it is not known whether any functional similarities exist among the members of this extended family of four-transmembrane domain proteins.
The chromosome locations of the γ subunit genes, CACNG3, CACNG4, and CACNG5, suggests they could be candidates for involvement in hereditary disease. CACNG3 is located on chromosome band 16p12–p13.1 in the vicinity of the ICCA locus [infantile convulsions and paroxysmal choreoathetosis; Online Mendelian Inheritance in Man (OMIM) no. 602066]. CACNG3 is expressed in the brain and it is worth noting that mutation of the closely related Cacng2 gene in the stg mouse results in epilepsy and ataxia (Noebels et al. 1990; Letts et al. 1998). The mouse ortholog of CACNG3 is predicted to map to chromosome 7 near Szv2, a quantitative trait locus (QTL) influencing seizure response to kainic acid (Ferraro et al. 1997). CACNG4 and CACNG5 are located on chromosome band 17q24 in tight physical linkage to CACNG1. A locus for neuralgic amyotrophy with brachial predilection (NAPB; OMIM 162100) has been mapped to 17q24–q25 and is characterized by severe pain, weakness, wasting, depression of reflexes, and sensory loss (Jacob et al. 1961). However, NAPB was localized close to marker D17S939 (Pellegrino et al. 1997), whereas CACNG1 (and CACNG4 and CACNG5 by association) was significantly more centromeric, near D17S807, and is therefore an unlikely candidate for this disorder. Comparison of conserved linkage groups suggests that mouse Cacng1, Cacng4, and Cacng5 are probably located near Pkca, which is on the consensus map of chromosome 11 at 68 cM [Mouse Genome Informatics (MGI) database]. Interestingly, this position is near a second locus for seizure susceptibility, Szs3, at 66 cM (Ferraro et al. 1997). The close association of epilepsy and ataxia with mutations in other neuronal voltage-dependent Ca2+ channels (Burgess and Noebels 1999) suggests these are potential candidate phenotypes for defects in the CACNG3, CACNG4, or CACNG5 genes.
METHODS
Target Region Sequence Database Construction
A database of human genomic sequences derived from chromosome bands 17q11–q25, 22q11–q24, and 16p11–p13 (target regions) was constructed using Microsoft Excel '97. Sequences were compiled from two sources: the Human Genome Sequencing Index (HGSI) database contains sequences from large clones (cosmids, BACs, or PACs), and clone contigs that have been localized unambiguously to specific genomic regions. Additional sequences were obtained by screening GenBank for genomic sequences identical to genes or cDNA that were localized previously to the target regions, using the programs BLASTN or TBLASTN (release 2.0; Altschul et al. 1997). Approximately 200–400 bp of nonrepetitive sequence from the ends of each genomic sequence obtained in this way was used for additional rounds of database screening and sequence contig extension, terminating when no additional sequences were identified.
Electronic Database Information
Data presented are consistent with the following databases as of September 1999: GenBank (GB), http://www.ncbi.nlm.nih.gov/Web/Genbank/; GeneMap'98, http://www.ncbi.nlm.nih.gov/genemap/; Genestream, http://vega.crbm.cnrs–mop.fr/home.html; Genscan, http://gnomic.stanford.Edu/∼chris/GENSCANW.html; HUGO/GDB Human Gene Nomenclature, http://www.gene.ucl.ac.uk/nomenclature/; LocusLink, http://www.ncbi.nlm.nih.gov/LocusLink/; Human Genome Sequencing Index (HGSI), http://www.ncbi.nlm.nih.gov/HUGO/; Mouse Genome Informatics (MGI), http://www.informatics.jax.org/; National Center for Biotechnology Information (NCBI), http://www.ncbi.nlm.nih.gov/; Online Mendelian Inheritance in Man (OMIM), http://www.ncbi.nlm.nih.gov/Omim/; Prosite, http://www.expasy.ch/prosite/.
Accession Numbers
Genes referred to in the text and figures are listed in alphabetical order, followed by genomic sequences listed by chromosome. Genes identified within larger genomic sequences are identified by base-pair (bp) position in the genomic sequence. All accession numbers refer to GenBank unless otherwise indicated: CACNG1 (AC005544), CACNG2 (Z83733, AL022313, AL031845), CACNG3 (AC004125), CACNG4 (AC005544, AC005988, AF142622, AF142623, AF142624, AF142625), CACNG5 (AC005988, AF142618, AF142619, AF142620, AF142621, AF148220), CBP-P22 (2695572), CSF2RB (OMIM 138981), EIF3–P66 (U54558), G6PDP1 (M12996; AC005988, bp 8473–9248), HSRASR (AL022729), HPSP1 (U65676; AL022313, bp 90054–88792), NCF4 (AH004909), ORFA05 (D29677), PRKCA (X52479), PRKCB1 (M13975), PVALB (OMIM 168890), TRX2 (U78678). Chromosome 16 genomic sequences: CIT987–SKA–345G4 (AC002302), CIT987–SKA–113A6 (AC002299), CIT987SK–625P11 (AC004125). Chromosome 17 genomic seqences: hCIT.187_K_10 (AC006263), hRPK.115_C_3 (AC006947), hRPK.74_H_8 (AC005918), hRPK.299_G_24 (AC005988), hRPK.349_A_8 (AC005544). Chromosome 22 genomic seqences: E132D12 (Z80897), 833B7 (AL008637), 24E5 (Z82185), 566H6 (AL031845), 1119A7 (AL022313), 126G10 (Z82184), 293L6 (Z82197; Z83733; Z83732), 4G12 (Z70289).
Low Stringency Similarity Searches
Low-stringency similarity searches for novel Ca2+ channel γ subunit genes were limited to sequences contained in the target region database. The BLASTN program (NCBI) was utilized for pairwise comparisons between large genomic sequences (10–150 kb) and cDNA sequences. Default filters used to mask sequences of low compositional complexity were turned off. The BLOSUM62 alignment scoring matrix was used. Alignment parameters were adjusted to reduce stringency (default value, value used): expectation value, −e (10.0, 100.0); gap-opening penalty, −G (5, 3); gap-extension penalty, −E (2, 1); mismatch penalty in the blast portion of the run, −q (−2, −1); word size (11, 7).
Sequence Analysis of Promoter Regions
Analysis of promoter region sequence for transcription factor binding sites utilized the web-based programs: PatSearch 1.1, utilizing the TRANSFAC 3.4 and TRRD 3.5 databases (Heinemeyer et al. 1998, 1999); MatInspector Version 2.2 (Quandt et al. 1995), utilizing the TRANSFAC 3.5 database; TFSEARCH (Yutaka Akiyama, http://www.rwcp.or.jp/papia/), utilizing the TRANSFAC 3.3 database; and TESS (J. Schug and G. Christian Overton, http://www.cbil.upenn.edu/tess/), utilizing the TRANSFAC 3.3 database.
Multiple Sequence Alignments and Phylogenetic Analysis
Protein sequences were aligned for phylogenetic analysis using the ClustalX multiple alignment package (Thompson et al. 1997) with default values. Alignments were carried out using full length sequences or only conserved regions as indicated in the text. Pair-wise percent amino acid identity was calculated following local alignment by BLASTP (release 2.0) using the BLOSUM62 scoring matrix and gap opening/extension penalties of 8 and 2, and following global alignment with the ALIGN program (Genestream) using the codaa.mat scoring matrix and gap opening/extension penalties of 12 and 2. The sequence alignment shown in Figure 1 was manually edited for display but not for phylogenetic analysis or amino acid identity calculations. Phylogenetic relationships were inferred using the neighbor-joining method (Saitou and Nei 1987) of the ClustalX multiple alignment package (Thompson et al. 1997). The reliability of tree topology was evaluated using bootstrap analysis (Felsenstein 1985) with 10,000 iterations to provide confidence levels. Unrooted trees were plotted as rectangular cladograms using the TreeView program (Page 1996).
Identification of CACNG5 cDNA
Oligonucleotide PCR primers predicted to amplify a 283-bp cDNA product were designed according to the sequence of the CACNG5 gene: HG5-F (exon 3): 5′-GATACTGGCCTTTGTCTCTGG-3′; HG5-R (exon 4): 5′-TTGTGGAATGTCCCTTCTCC-3′. A single product of ∼283 bp was amplified from a PCR reaction containing 1 μl of phage suspension from a human fetal kidney cDNA library (Clontech, HL5004a) as template in a 50-μl reaction volume, 50 mm KCl, 10 mm Tris-HCl, 1.5 mm MgCl2, 0.1% Triton X-100, 25 mm dNTPs, 0.8 μm each oligonucleotide (HG5-F and HG5-R), and 1 Unit of Taq polymerase (Promega). The reaction was carried out using a PTC-100 thermocycler (MJ Research) with an initial denaturation of 94°C for 2 min, followed by 35 cycles of 94°C (30 sec), 55°C (60 sec), 72°C (60 sec), and a final extension of 72°C for 10 min. Following agarose gel electrophoresis, the PCR product was isolated using the QIAquick gel extraction kit (Qiagen) and sequenced by the Baylor College of Medicine DNA Sequencing Core Facility.
Acknowledgments
This research was supported by an American Epilepsy Society postdoctoral fellowship and a Methodist Hospital Foundation (Houston, TX) grant to D.L.B. and National Institutes Health grant NS29709 to J.L.N. We thank T. Cormier in the laboratory of Dr. Huda Zoghbi for providing a sample of the Clontech fetal kidney cDNA library.
The publication costs of this article were defrayed in part by payment of page charges. This article must therefore be hereby marked “advertisement” in accordance with 18 USC section 1734 solely to indicate this fact.
Footnotes
E-MAIL dburgess@bcm.tmc.edu; FAX (713) 798-7528.
REFERENCES
- Altschul SF, Madden TL, Schaffer AA, Zhang J, Zhang Z, Miller W, Lipman DJ. Gapped BLAST and PSI-BLAST: A new generation of protein database search programs. Nucleic Acids Res. 1997;25:3389–3402. doi: 10.1093/nar/25.17.3389. [DOI] [PMC free article] [PubMed] [Google Scholar]
- Biel M, Ruth P, Bosse E, Hullin R, Stuhmer W, Flockerzi V, Hofmann F. Primary structure and functional expression of a high voltage activated calcium channel from rabbit lung. FEBS Lett. 1990;269:409–412. doi: 10.1016/0014-5793(90)81205-3. [DOI] [PubMed] [Google Scholar]
- Black JL, III, Lennon VA. Identification and cloning of putative human neuronal voltage-gated calcium channel γ2 and γ3 subunits: Neurologic implications. Mayo Clin Proc. 1999;4:357–361. doi: 10.4065/74.4.357. [DOI] [PubMed] [Google Scholar]
- Burge C, Karlin S. Prediction of complete gene structures in human genomic DNA. J Mol Biol. 1997;268:78–94. doi: 10.1006/jmbi.1997.0951. [DOI] [PubMed] [Google Scholar]
- ————— Finding the genes in genomic DNA. Curr Opin Struct Biol. 1998;8:346–354. doi: 10.1016/s0959-440x(98)80069-9. [DOI] [PubMed] [Google Scholar]
- Burgess, D.L. and J.L. Noebels 1999. Voltage-dependent Ca2+ Channel Mutations in Neurological Disease. J.N.Y. Acad. Sci. (in press). [DOI] [PubMed]
- Castellano A, Perez-Reyes E. Molecular diversity of Ca2+ channel β subunits. Biochem Soc Trans. 1994;22:483–488. doi: 10.1042/bst0220483. [DOI] [PubMed] [Google Scholar]
- Chin HM, Kozak CA, Kim HL, Mock B, McBride OW. A brain L-type calcium channel α1 subunit gene (CCHL1A2) maps to mouse chromosome 14 and human chromosome 3. Genomics. 1991;11:914–919. doi: 10.1016/0888-7543(91)90014-6. [DOI] [PubMed] [Google Scholar]
- Collin T, Lory P, Taviaux S, Courtieu C, Guilbault P, Berta P, Nargeot J. Cloning, chromosomal location and functional expression of the human voltage-dependent calcium-channel β3 subunit. Eur J Biochem. 1994;220:257–262. doi: 10.1111/j.1432-1033.1994.tb18621.x. [DOI] [PubMed] [Google Scholar]
- Cribbs LL, Lee J-H, Yang J, Satin J, Zhang Y, Daud A, Barclay J, Williamson MP, Fox M, Rees M, et al. Cloning and characterization of α1H from human heart, a member of the T-type calcium channel gene family. Circ Res. 1998;83:103–109. doi: 10.1161/01.res.83.1.103. [DOI] [PubMed] [Google Scholar]
- Deloukas P, Schuler GD, Gyapay G, Beasley EM, Soderlund C, Rodriguez-Tomé P, Hui L, Matise TC, McKusick KB, Beckmann JS, et al. A physical map of 30,000 human genes. Science. 1998;282:744–746. doi: 10.1126/science.282.5389.744. [DOI] [PubMed] [Google Scholar]
- De Waard M, Gurnett CA, Campbell KP. Structural and functional diversity of voltage-activated calcium channels. In: Naharashi T, editor. Ion Channels. New York, NY: Plenum Press; 1996. pp. 41–87. [DOI] [PubMed] [Google Scholar]
- Diriong S, Lory P, Williams ME, Ellis SB, Harpold MM, Taviaux S. Chromosomal localization of the human genes for alpha 1A, alpha 1B, and alpha 1E voltage-dependent Ca2+ channel subunits. Genomics. 1995;30:605–609. doi: 10.1006/geno.1995.1284. [DOI] [PubMed] [Google Scholar]
- Drouet B, Garcia L, Simon-Chazottes D, Mattei MG, Guenet J-L, Schwartz A, Varadi G, Pincon-Raymond M. The gene coding for the α-1 subunit of the skeletal dihydropyridine receptor (Cchl1a3=mdg) maps to mouse chromosome 1 and human 1q32. Mamm Genome. 1993;4:499–503. doi: 10.1007/BF00364784. [DOI] [PubMed] [Google Scholar]
- Eberst R, Dai S, Klugbauer N, Hofmann F. Identification and functional characterization of a calcium channel γ subunit. Pflügers Arch. 1997;433:633–637. doi: 10.1007/s004240050324. [DOI] [PubMed] [Google Scholar]
- Felsenstein J. Confidence limits on phylogenies: An approach using the bootstrap. Evolution. 1985;39:783–791. doi: 10.1111/j.1558-5646.1985.tb00420.x. [DOI] [PubMed] [Google Scholar]
- Ferraro TN, Golden GT, Smith GG, Schork NJ, St Jean P, Ballas C, Choi H, Berrettini WH. Mapping murine loci for seizure response to kainic acid. Mamm Genome. 1997;8:200–208. doi: 10.1007/s003359900389. [DOI] [PubMed] [Google Scholar]
- Fisher SE, Ciccodicola A, Tanaka K, Curci A, Desicato S, D'urso M, Craig IW. Sequence-based exon prediction around the synaptophysin locus reveals a gene-rich area containing novel genes in human proximal Xp. Genomics. 1997;45:340–347. doi: 10.1006/geno.1997.4941. [DOI] [PubMed] [Google Scholar]
- Giles RH, Dauwerse HG, van Ommen GJ, Breuning MH. Do human chromosomal bands 16p13 and 22q11–13 share ancestral origins? Am J Hum Genet. 1998;63:1240–1242. doi: 10.1086/302044. [DOI] [PMC free article] [PubMed] [Google Scholar]
- Gregg RG, Couch F, Hogan K, Powers PA. Assignment of the human gene for the α1 subunit of the skeletal muscle DHP-sensitive Ca2+ channel (CACNL1A3) to chromosome 1q31–q32. Genomics. 1993a;15:107–112. doi: 10.1006/geno.1993.1017. [DOI] [PubMed] [Google Scholar]
- Gregg RG, Powers PA, Hogan K. Assignment of the human gene for the β subunit of the voltage-dependent calcium channel (CACNLB1) to chromosome 17 using somatic cell hybrids and linkage mapping. Genomics. 1993b;15:185–187. doi: 10.1006/geno.1993.1029. [DOI] [PubMed] [Google Scholar]
- Gyapay G, Schmitt K, Fizames C, Jones H, Vega-Czarny N, Spillett D, Muselet D, Prud'Homme JF, Dib C, Auffray C, et al. A radiation hybrid map of the human genome. Hum Mol Genet. 1996;5:339–346. doi: 10.1093/hmg/5.3.339. [DOI] [PubMed] [Google Scholar]
- Heinemeyer T, Wingender E, Reuter I, Hermjakob H, Kel AE, Kel OV, Ignatieva EV, Ananko EA, Podkolodnaya OA, Kolpakov FA, et al. Databases on Transcriptional Regulation: TRANSFAC, TRRD, and COMPEL. Nucleic Acids Res. 1998;26:264–370. doi: 10.1093/nar/26.1.362. [DOI] [PMC free article] [PubMed] [Google Scholar]
- Heinemeyer T, Chen X, Karas H, Kel AE, Kel OV, Liebich I, Meinhardt T, Reuter I, Schacherer F, Wingender E. Expanding the TRANSFAC database towards an expert system of regulatory molecular mechanisms. Nucleic Acids Res. 1999;27:318–322. doi: 10.1093/nar/27.1.318. [DOI] [PMC free article] [PubMed] [Google Scholar]
- Hofmann K, Stoffel W. TMBASE—A database of membrane spanning protein segments. Biol Chem Hoppe-Seyler. 1993;374:166. [Google Scholar]
- Iles DE, Segers B, Weghuis DO, Suikerbuijk R, Wieringa B. Localization of the gamma-subunit of the skeletal muscle L-type voltage-dependent calcium channel gene (CACNLG) to human chromosome band 17q24 by in situ hybridization and identification of a polymorphic repetitive DNA sequence at the gene locus. Cytogenet Cell Genet. 1993;64:227–230. doi: 10.1159/000133583. [DOI] [PubMed] [Google Scholar]
- Jacob JC, Andermann F, Robb JP. Heredofamilial neuritis with brachial predilection. Neurology. 1961;11:1025–1033. doi: 10.1212/wnl.11.12.1025. [DOI] [PubMed] [Google Scholar]
- Jay SD, Ellis SB, McCue AF, Williams ME, Vedvick TS, Harpold MM, Campbell KP. Primary structure of the gamma subunit of the DHP-sensitive calcium channel from skeletal muscle. Science. 1990;248:490–492. doi: 10.1126/science.2158672. [DOI] [PubMed] [Google Scholar]
- Klugbauer N, Lacinova L, Marais E, Hobom M, Hofmann F. Molecular diversity of the calcium channel α2δ subunit. J Neurosci. 1999;19:684–691. doi: 10.1523/JNEUROSCI.19-02-00684.1999. [DOI] [PMC free article] [PubMed] [Google Scholar]
- Kozak M. Compilation and analysis of sequences upstream from the translational start site in eukaryotic mRNAs. Nucleic Acids Res. 1984;12:857–872. doi: 10.1093/nar/12.2.857. [DOI] [PMC free article] [PubMed] [Google Scholar]
- Lee JH, Daud AN, Cribbs LL, Lacerda AE, Pereverzev A, Klockner U, Schneider T, Perez-Reyes E. Cloning and expression of a novel member of the low voltage-activated T-type calcium channel family. Neuroscience. 1999;19:1912–1921. doi: 10.1523/JNEUROSCI.19-06-01912.1999. [DOI] [PMC free article] [PubMed] [Google Scholar]
- Letts VA, Felix R, Biddlecome GH, Arikkath J, Mahaffey CL, Valenzuela A, Bartlett FS, II, Mori Y, Campbell KP, Frankel WN. The mouse stargazer gene encodes a neuronal Ca2+-channel gamma subunit. Nat Genet. 1998;19:340–347. doi: 10.1038/1228. [DOI] [PubMed] [Google Scholar]
- Morita K, Furuse M, Fujimoto K, Tsukita S. Claudin multigene family encoding four-transmembrane domain protein components of tight junction strands. Proc Natl Acad Sci. 1999;96:511–516. doi: 10.1073/pnas.96.2.511. [DOI] [PMC free article] [PubMed] [Google Scholar]
- Mount SM. A catalogue of splice junction sequences. Nucleic Acids Res. 1982;10:459–472. doi: 10.1093/nar/10.2.459. [DOI] [PMC free article] [PubMed] [Google Scholar]
- Nadeau JH, Sankoff D. Comparable rates of gene loss and functional divergence after genome duplications early in vertebrate evolution. Genetics. 1997;147:1259–1266. doi: 10.1093/genetics/147.3.1259. [DOI] [PMC free article] [PubMed] [Google Scholar]
- Noebels JL, Qiao X, Bronson RT, Spencer C, Davisson MT. Stargazer: A new neurological mutant on chromosome 15 in the mouse with prolonged cortical seizures. Epilepsy Res. 1990;7:129–135. doi: 10.1016/0920-1211(90)90098-g. [DOI] [PubMed] [Google Scholar]
- Ohno S. Evolution by gene duplication. Heidelberg, Germany: Springer Verlag; 1970. [Google Scholar]
- Page RDM. TREEVIEW: An application to display phylogenetic trees on personal computers. Comput Appl Biosci. 1996;12:357–358. doi: 10.1093/bioinformatics/12.4.357. [DOI] [PubMed] [Google Scholar]
- Pellegrino JE, George RAV, Biegel J, Farlow MR, Gardner K, Caress J, Brown MJ, Rebbeck TR, Bird TD, Chance PF. Hereditary neuralgic amyotrophy: Evidence for genetic homogeneity and mapping to chromosome 17q25. Hum Genet. 1997;101:277–283. doi: 10.1007/s004390050629. [DOI] [PubMed] [Google Scholar]
- Perez-Reyes E, Cribbs LL, Daud A, Lacerda AE, Barclay J, Williamson MP, Fox M, Rees M, Lee JH. Molecular characterization of a neuronal low-voltage-activated T-type calcium channel. Nature. 1998;391:896–900. doi: 10.1038/36110. [DOI] [PubMed] [Google Scholar]
- Powers PA, Gregg RG, Lalley PA, Liao M, Hogan K. Assignment of the human gene for the α1 subunit of the cardiac DHP-sensitive Ca2+ channel (CCHL1A1) to chromosome 12p12–pter. Genomics. 1991;10:835–839. doi: 10.1016/0888-7543(91)90471-p. [DOI] [PubMed] [Google Scholar]
- Powers PA, Liu S, Hogan K, Gregg RG. Molecular characterization of the gene encoding the γ subunit of the human skeletal muscle 1,4-dihydropyridine-sensitive Ca2+ channel (CACNLG), cDNA sequence, gene structure, and chromosomal location. J Biol Chem. 1993;268:9275–9279. [PubMed] [Google Scholar]
- Powers PA, Scherer SW, Tsui LC, Gregg RG, Hogan K. Localization of the gene encoding the α 2/δ subunit (CACNL2A) of the human skeletal muscle voltage-dependent Ca2+ channel to chromosome 7q21–q22 by somatic cell hybrid analysis. Genomics. 1994;19:192–193. doi: 10.1006/geno.1994.1044. [DOI] [PubMed] [Google Scholar]
- Quandt K, Frech K, Karas H, Wingender E, Werner T. MatInd and MatInspector—New fast and versatile tools for detection of consensus matches in nucleotide sequence data. Nucleic Acids Res. 1995;23:4878–4884. doi: 10.1093/nar/23.23.4878. [DOI] [PMC free article] [PubMed] [Google Scholar]
- Saitou N, Nei M. The neighbor-joining method: A new method for reconstructing phylogenetic trees. Mol Biol Evol. 1987;4:406–425. doi: 10.1093/oxfordjournals.molbev.a040454. [DOI] [PubMed] [Google Scholar]
- Singer D, Biel M, Lotan I, Flockerzi V, Hofmann F, Dascal N. The roles of the subunits in the function of the calcium channel. Science. 1991;253:1553–1557. doi: 10.1126/science.1716787. [DOI] [PubMed] [Google Scholar]
- Tanaka O, Sakagami H, Kondo H. Localization of mRNAs of voltage-dependent Ca2+-channels: Four subtypes of α1 and β-subunits in developing and mature rat brain. Brain Res Mol Brain Res. 1995;30:1–16. doi: 10.1016/0169-328x(94)00265-g. [DOI] [PubMed] [Google Scholar]
- Taviaux S, Williams ME, Harpold MM, Nargeot J, Lory P. Assignment of human genes for β2 and β4 subunits of voltage-dependent Ca2+ channels to chromosomes 10p12 and 2q22–q23. Hum Genet. 1997;100:151–154. doi: 10.1007/pl00008704. [DOI] [PubMed] [Google Scholar]
- Thompson JD, Gibson TJ, Plewniak F, Jeanmougin F, Higgins DG. The ClustalX windows interface: Flexible strategies for multiple sequence alignment aided by quality analysis tools. Nucleic Acids Res. 1997;24:4876–4882. doi: 10.1093/nar/25.24.4876. [DOI] [PMC free article] [PubMed] [Google Scholar]
- Walker D, De Waard M. Subunit interaction sites in voltage-dependent Ca2+ channels: Role in channel function. Trends Neurosci. 1998;21:148–154. doi: 10.1016/s0166-2236(97)01200-9. [DOI] [PubMed] [Google Scholar]
- Wei XY, Perez-Reyes E, Lacerda AE, Schuster G, Brown AM, Birnbaumer L. Heterologous regulation of the cardiac Ca2+ channel α1 subunit by skeletal muscle β and α subunits. Implications for the structure of cardiac L-type Ca2+ channels. J Biol Chem. 1991;266:21943–21947. [PubMed] [Google Scholar]
- Williams ME, Washburn MS, Hans M, Urrutia A, Brust PF, Prodanovich P, Harpold MM, Stauderman KA. Structure and functional characterization of a novel human low-voltage activated calcium channel. J Neurochem. 1999;72:791–799. doi: 10.1046/j.1471-4159.1999.0720791.x. [DOI] [PubMed] [Google Scholar]
- Yu AS. Identification and localization of calcium channel α1 and β subunit isoforms in the kidney. Kidney Int. 1995;48:1097–1101. doi: 10.1038/ki.1995.393. [DOI] [PubMed] [Google Scholar]