

Abstract
The availability of comprehensive sets of genes has prompted the researchers to carry out systematic collection of gene expression data. RT–PCR has the highest specificity and sensitivity for transcript detection among all available methods. Low throughput, especially when quantitative data are desired, has precluded RT–PCR from genome-wide application. Here we report a PCR-based expression profiling method, introduced amplified fragment length polymorphism (iAFLP), that has the same specificity and sensitivity as RT–PCR and a throughput level comparable to that of DNA–microarray hybridization. In this method, restricted ends of total cDNAs from six sources were ligated with adaptors having various length of short insertions to a common sequence (polymorphic adaptors). Amplification of a pool of these differentially adapted cDNAs with a gene-specific primer and an adaptor primer allows us to quantitate the abundance of any transcript in six mRNA sources. Using three different primer colors this technique allows quantitation of expression of 864 genes across six different sources per day with a single autosequencer, which is comparable to the throughput of microarray analysis in terms of number of genes × number of sources.
To date, the complete genome sequences of 17 organisms have been reported and expressed sequence tags (ESTs) collection for the last decade has produced partial sequence of at least 50,000 human genes (Deloukas et al. 1998).
Availability of a comprehensive set of genes has prompted the researchers to carry out systematic collection of gene expression data. Various methods for analyzing gene expression (Adams et al. 1992; Liang and Pardee 1992; Okubo et al. 1992; Kato 1995), hybridization of high-density arrays of DNA, oligomers (McGall et al. 1996; Wodicka et al. 1997) or PCR products (Lockhart et al. 1996; Iyer et al. 1999), have been used, because they provide high throughput in the numbers of genes tested at one time. Although a single transcript in a cell theoretically may be detected (Duggan et al. 1999), it is still unclear what proportion of arrayed DNAs give informative signals. Individual gene probes in labeled cDNA/cRNA have unique secondary structures, melting temperatures, and reassociation rates (Southern et al. 1999), which makes hybridization of all gene probes under optimum condition nearly impossible. In contrast, RT–PCR is the most sensitive and specific of all techniques available for transcript detection (Becker-Andre et al. 1989). The major drawback of genome-wide application of RT–PCR is low throughput, especially when quantitative data are desired. For the analysis of thousands of transcripts with concentrations that differ as much as 1000-fold (Okubo et al. 1992), noncompetitive PCR has the critical disadvantage that it requires a standard curve for every primer pair (Singer-Sam et al. 1990) and quantitation by competitor fragments for each gene is not realistic. Kato proposed that engineered total cDNA from different sources replace the competitor DNA for every transcript species (Kato 1997). We have expanded this idea and developed a protocol to provide high throughput. Here we report a novel PCR-based protocol, introduced-amplified fragment length polymorphism (iAFLP), that allows relative quantitation of transcript concentration across as many as six mRNA sources in a single PCR reaction. We also describe a method to apply this protocol to minute amounts of sample and to increase the throughput to levels comparable to those of DNA chip hybridization.
RESULTS
Expression Profiling With iAFLP
A set of adaptors that mimic a length-polymorphic locus were designed. These adaptors have common sequences at both ends and sequences of different lengths internally. The polymorphic portion of the adaptors was composed with degenerate A, C, and T residues to neutralize sequence-specific effects of the adaptors on the amplification kinetics (Fig. 1B). Ligation of these adaptors to restricted cDNA fragments from multiple sources yielded source-specific length-polymorphism on the cDNA ends. From a pool of such adapted cDNAs, any gene sequence can be amplified as length-polymorphic fragments when a gene-specific primer and an adaptor primer [F-T7(25)] are used (Fig. 1A).
Figure 1.
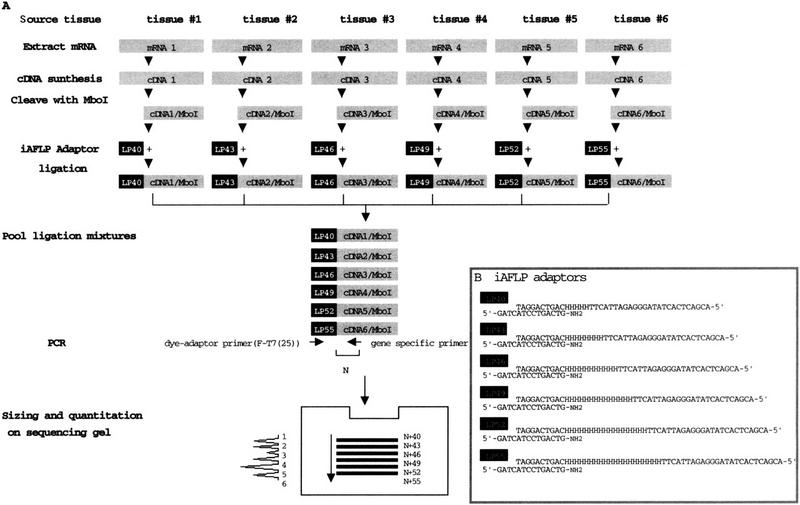
(A) A schematic diagram of expression profiling by iAFLP. For details, see text. (B) iAFLP adaptors.
Because of the nearly identical sequence content and common primer annealing sites, the polymorphic fragments should have similar amplification efficiencies. Therefore, the relative concentrations of the transcript from different sources should be reflected in the amount of corresponding polymorphic products. The relationship between the ratio of polymorphic products (iAFLP profile) and the ratio of targets in mRNAs was confirmed by two methods. First, MboI-digested human hepatoblastoma hepG2 cDNA was divided between six tubes and ligated to different iAFLP adaptors. These ligation mixtures were pooled at 24 different ratios by adding two- to fivefold excess of one of each adapted cDNA into an even mixture of all adapted cDNAs. In these mixtures, every transcript has controlled relative abundance across differentially adapted cDNAs. As an example, the concentration of GAPDH was measured by PCR with antisense GAPDH primer and dye-labeled adaptor primer F-T7(25) (Fig. 2A). Within the mixing range of 1:2 to 1:5, all cDNA pools gave iAFLP profiles proportional to the original mixing ratios (Fig. 2B). Similar profiles were obtained with other gene-specific primers tested (data not shown). The quantitation errors for the highest peaks [(observed excess ratio/true excess ratio) − 1] in 24 pools were +12% on average with a standard deviation of 4.2%.
Figure 2.
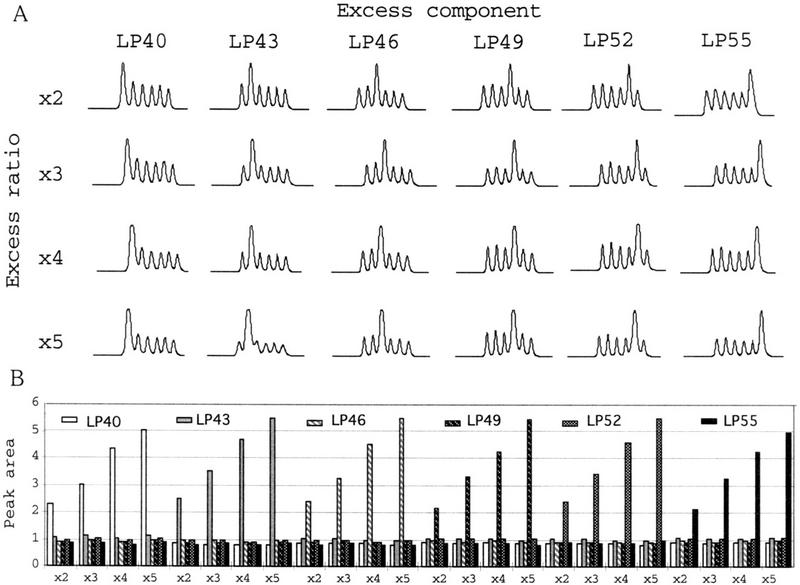
iAFLP profiles of standard template pools. Twenty-four standard template pools of different composition were made by adding one- (x2) to fourfold (x5) excess of each component to the even pool of six differentially adapted hepG2 cDNAs (LP40 through LP55). The GAPDH primer and 5-Fam T7(25) primer were used for amplification. Chromatographic pattern of PCR products (A) and the normalized area for each peak (B). Excess component (LP40 through LP55) and excess ratio (x2 through x5) are indicated.
Then, the results of iAFLP profiles were compared with results of Northern hybridization. Equal amounts of poly(A) RNAs from six human tissues were converted to cDNAs and ligated with one of the polymorphic adaptors after cleavage with MboI. These six ligation mixtures were pooled equally and used as a template. The iAFLP profiles of four genes with various expression patterns, GAPDH, troponin C, neurofilament L, and cathepsin L, were compared with Northern hybridization signals from the corresponding probes (Fig. 3). The intensities of hybridization signals and peak areas of polymorphic fragments correlated very well within a wide range of expression levels.
Figure 3.
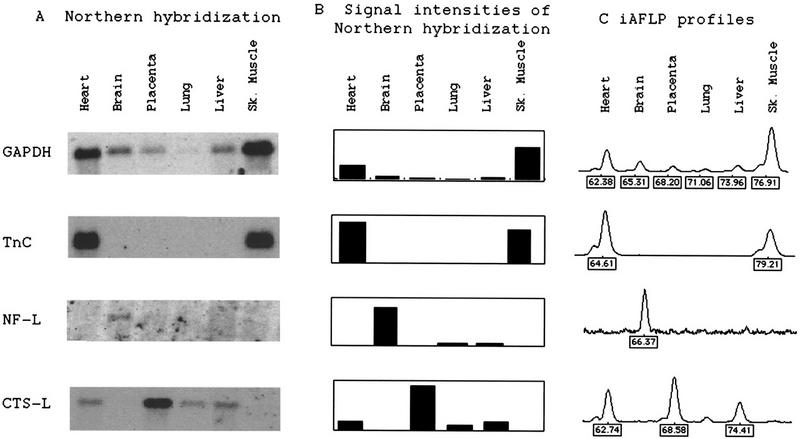
Comparison of Northern hybridization results with iAFLP profiles. The same set of six human tissue poly(A) RNAs was used for Northern blotting and cDNA synthesis in template pool preparation for iAFLP profiling. For each gene, Northern hybridization signals (A), intensities of those signals (B), and an iAFLP profile (C) are shown. Values below the iAFLP profile are sizes assigned for peaks by the GenScan software (PE Biosystems). On the x-axis is fluorescence intensities in arbitrary units measured by 377 sequencer (PE Biosystems). (GAPDH) Glyceraldehyde-3-phosphodehydrogenase; (Tn C) cardiac troponin C; (NF-L) neurofilament L; (CTS-L) cathepsin L.
Enhancing the Throughput of iAFLP
Using the present protocol, which allows direct comparison of six sources, unlimited numbers of RNAs can be compared by including one reference cDNA sample in different pools. We tested the relative quantitation of transcript in 30 tissues by making six pools (pools A to F) of six adapted cDNAs (Fig. 4B). As a reference cDNA, we pooled 30 cDNAs before adaptor ligation and included in every pool as one component. Antisense primers were designed based on the sequence of the most 3′ MboI fragment of cDNAs for GAPDH, apolipoproten B, neurofilament L, and troponin C. Each primer was used to amplify pools A through F with F-T7 primer (Fig.4A). To save the lanes required for the analysis, a primer with 5-Fam (blue) label was used for pools A and D, Hex (green) for B and E, and Tamra (yellow) for C and F. After PCR, reactions with different dyes were pooled and loaded onto one lane. By normalizing the peak area for each source relative to the reference peak in the same pool, concentrations of transcripts in different pools can be compared (Fig.4C). The relative concentration of gene transcripts in 30 human tissues were determined (Fig.4C). The sum of normalized peak areas across 30 tissues were 25 (NF-L, Apo B), 28 (troponin C), and 32 (GAPDH). Because the reference is an even pool of 30 cDNAs, these values, which were close to the expected value of 30, suggest that quantitation is reliable. Moreover, the reference allowed accurate comparison by dividing the difference in expression levels into two smaller factors. For example, the very weak expression of troponin C in adipose tissue probably originated from a rich vascular bed (pool F, third position), is titrated as 1:75 of expression in skeletal muscle (pool E, second position).
Figure 4.
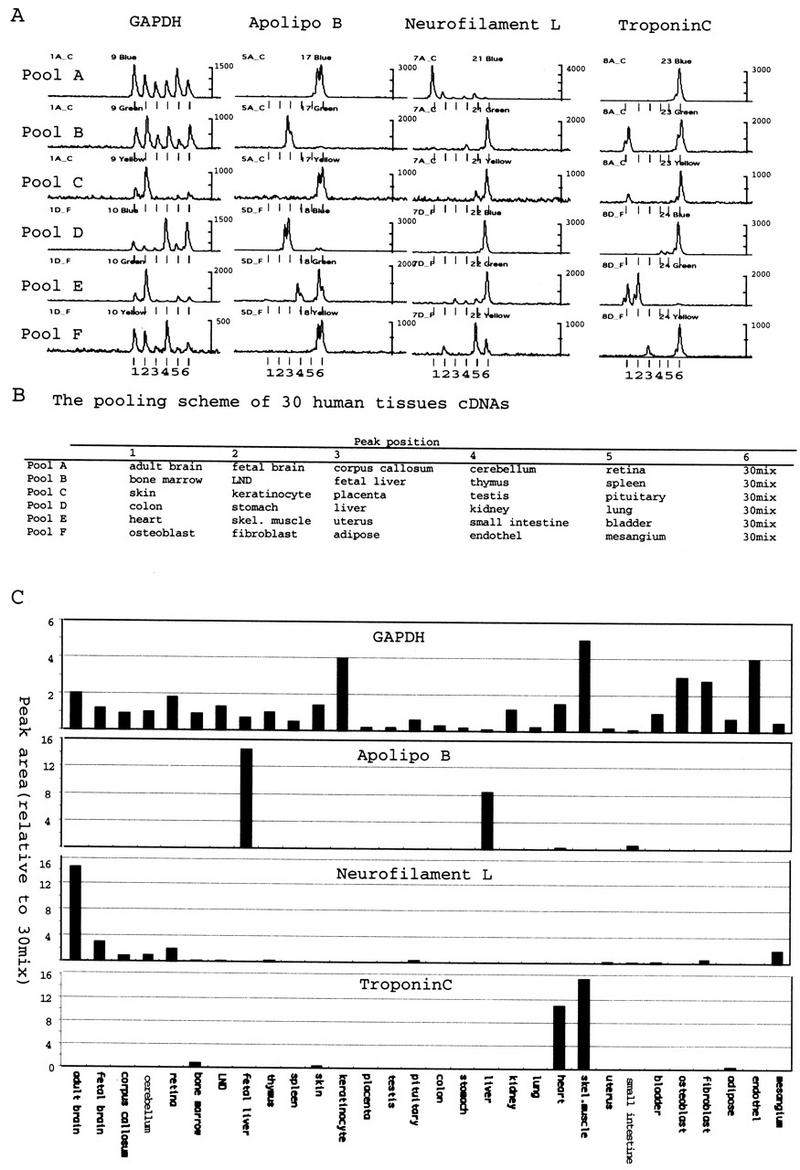
Expression pattern of genes across 30 human tissues, profiled by iAFLP. (A) An antisense primer for each of four genes was used to amplify six template pools (pools A through F) of human cDNAs adapted with iAFLP cassettes. The split peak represents partial terminal single nucleotide addition by Taq polymerase. (B) The pooling scheme to prepare six template pools with 30 human cDNAs. (C) Peak areas in each iAFLP profile were normalized relative to the peak area for reference cDNA mixture (30 mix). Note that the sum of normalized peak areas is close to the expected value of 30.
Application to Microsamples
To expand the application of this protocol to minute amounts of sample, we tested PCR amplification of total cDNA before iAFLP adaptor ligation. First, we evaluated the distortion in composition of total cDNA made by PCR amplification. From a fraction of an adapted total hepG2 cDNA, the most 3′ fragments were amplified ∼1000-fold with primers that anneal to the adaptor and vector-primer. After amplification, the adaptor portion was cleaved off with MboI and replaced with another iAFLP adaptor. From the 3′ ESTs of hepG2 cells deposited in GenBank, 192 independent sequences were selected for analysis. The concentrations of these 192 sequences in the cDNA before and after the amplification were compared by iAFLP (Fig.5). Among 192 gene-specific primers, 175 primers yielded PCR products with expected sizes. The ratios of post-PCR to pre-PCR concentration of these 175 sequences ranged from 0.6 to 1.5, with an average of 1.1 and standard deviation of 0.24. We found a moderate correlation between amplification efficiency and lengths of cDNA fragments. If concentrations are compared between amplified total cDNAs, the error would probably be smaller because the preferred sequence would be amplified efficiently in any sample. For example, a mouse embryo at 9.5 dpc (13 somite stage) was dissected into five different parts and the anatomical distribution of two morphogenic gene transcripts, hindbrain-specific krox (Nonchev et al. 1996) and somite-specific Mox-1 (Candia et al. 1992), were monitored with amplified iAFLP. The reported distribution of each of these transcripts is well reproduced (Fig. 6). For krox20 gene, second primer (krox20-2), which anneals to 18 bp distal to the first one (krox20), was used to confirm the expression pattern.
Figure 6.
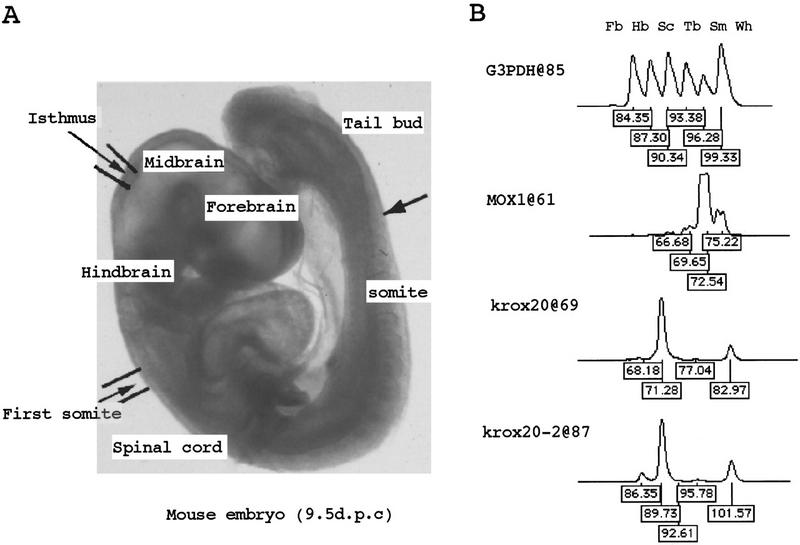
(A) Dissection scheme of a 9.5 dpc embryo (13-somite stage). An embryo was dissected into four segments [(Fb) forebrain; (Hb) hindbrain; (Tb) trunk; and tail bud] by cutting at the isthmus, first somite, and the last somite. Then, the trunk was further divided into two parts, the somite (Sm) and the spinal cord (Sc). Using Trizol solution (BRL, Bethesda, MD) total RNAs were extracted from each of these body parts and used in cDNA synthesis for profiling template preparation. As a reference, RNA from a whole embryo (Wh) was included in the cDNA pool. (B) The iAFLP profiles and size assignment for each peak showing anatomical distribution of three mouse genes. Expected peak positions of the shortest products (Fb) are indicated with gene names separated by . Sizes for 5-Fam-labeled fragments, assigned by Rox-labeled size markers, are always ∼0.5 nucleotides shorter than true length.
DISCUSSION
In competitive PCR, the ratio of products sometimes does not reflect the ratio of competitor to target when the reactions are run to saturation (Volkenandt et al. 1992; Pannetier et al. 1993) . Morrison and Gannon (1994) clearly demonstrated that the plateau onset is simultaneous for all amplicons. Therefore, if the competitor and target have similar amplification efficiencies, the ratio of products reflects the ratio of targets well after the reaction reaches saturation. McCulloch et al. (1995) showed that homologous fragments with size differences smaller than 50 bp meet this requirement. In our protocol, the ratio of differentially adapted gene-specific amplicons in the PCR product, with size differences of at most 15 bp, reflected very well the initial ratio of targets.
In comparative gene expression analysis, throughput should be compared in terms of number of genes tested × number of sources compared. Obviously, the throughput of our protocol is limited by the separation and detection of PCR products on an autosequencer. The necessity of size separation precluded the possibility of using colorimetric detection or real-time quantitation. Nevertheless, we can use three colors for dye-primers that permit the application of 288 reactions on a single sequencing gel, leaving one color for size standards. As shown in Figure 4, spectrum leaks in the neighboring windows can be eliminated by using a properly calculated matrix. Therefore, the throughput for a single 2-hr run is 96 genes × 6 sources × 3 colors = 1728 gene × sources. Assuming three runs a day, 5184 genes × sources can be analyzed per day per machine. This throughput is comparable to that of a single microarray hybridization. The number of PCR reactions required for sample preparation is 864, which is easily generated by one thermocycler that accepts two 384-well plates.
There are several advantages of our protocol over microarray-based expression studies. The signal for any gene-specific primer is first validated by the size of the PCR product, which is determined to a single nucleotide resolution in our protocol. If necessary, further confirmation is obtained by using another primer to the same gene, as shown for krox20. The quantitative aspect is validated by calculating the ratio of the total amount of products from individual sources to the product from the mixture of these sources. This is advantageous over microarray hybridization, which is weak in gene-by-gene data validation.
Moreover, the system setup is much simpler than microarray. When cDNA sequences or 3′ EST sequences are selected, primers can be designed using simple computer programs and custom primers are available from many manufacturers in the 96-well format at properly adjusted concentrations. Thus, once the pool of adapted cDNAs are made, the PCR reactions are simply set up by adding the primers to the master mix. Gene selection is highly flexible, and newly discovered genes are easily tested by researchers. For a single microarray hybridization, 2–5 μg of poly(A) RNA is required for probe preparation (Duggan et al. 1999), in which up to 10,000 genes can be tested. Using our protocol, a similar number of genes can be tested from 1 μg of poly(A) RNA without any preamplification step.
In summary, we developed the protocol iAFLP which allows highly specific and sensitive profiling of gene expression. One autosequencer can produce expression data for 5184 genes × sources per day. Once an antisense oligomer is synthesized for all genes in the scale of micromoles, it will become a permanent resource for expression tests in genomes. Unlike microarrays, the genes tested at one time are flexible in variety and number.
METHODS
Oligomers
iAFLP oligomers are as follows: LP40, 5′-ACGACTCACTATAGGGAGATTACTTHHHHHCAGTCAGGAT; LP43, 5′-ACGACTCACTATAGGGAGATTACTTHHHHHHHHCAGTCAGGAT; LP46, 5′-ACGACTCACTATAGGGAGATTACTTHHHHHHHHHHHCAGTCAGGAT; LP49, 5′-ACGACTCACTATAGGGAGATTACTTHHHHHHHHHHHHHHCAGTCAGGAT; LP52, 5′-ACGACTCACTATAGGGAGATTACTTHHHHHHHHHHHHHHHHHCAGTCAGGAT; LP55, 5′-ACGACTCACTATAGGGAGATTACTTHHHHHHHHHHHHHHHHHHHHCAGTCAGGAT (H = A, C, or T). NH2-terminated oligomer (NH1400: GATCATCCTGACTG-NH2) complement to the 3′ termini of iAFLP oligonucleotides was kinated by T4 kinase and mixed with equimolar amounts of iAFLP oligomer. These pairs of oligomers were used as iAFLP adaptors.
5-Fam-, Hex-, and Tamra-labeled T7 primers [F-T7(25): F-ACGACTCACTATAGGGAGATTACTT] were custom-made by PE Biosystems. Bam7T:5′-GACGCGGATCCAAGCTTGCATGCCTGCATTTTTTT Gene-specific antisense primers were designed based on cDNA sequences in GenBank. The distance from the GATC to the annealing site is indicated: human GAPDH (GenBank accession no. M17851), GTGCTAAGCAGTTGGTGGT (23 nucleotides from GATC); human apolipoprotein B(J02775); CAAGTTTAGCAAAATAACTCAGA (3 nucleotides); human neurofilament L(X05608), GATGATTCACATTGCCGTAGA (3 nucleotides); human troponin C(M37984), GATTTGCATCCCCCAGGACAGA (3 nucleotides); mouse GAPDH(M32599), TGTCATCATACTTGGCAGGT (23 nucleotides); mouse krox20 (X06746) 1, GTTAACCTTTGACTCATTTCAAGAGA (3 nucleotides) and 2, CCCCCTTTAAATAAGTTAGTT (24 nucleotides) mouse MOX1 (Z15103), GTAAACACTCACAATCAGATC (1 nucleotide); and mouse WNT3a (X56842), GACAGGGTGGTGGCCAACGGA (3 nucleotides).
Preparation of Template Pools
Human RNAs were purchased from Clontech. RNA from hepG2 cells was described previously (Okubo et al. 1992). For all cDNA synthesis, a pUC19-based vector primer (Okubo et al. 1992) was used to monitor synthesis and cleavage of cDNA on agarose gel. Poly(A) RNA or total RNA was annealed with an equal amount or 1:20 amount of vector primer, respectively, in 13 μl of distilled water at 37°C and 2× reaction mixture was added to yield final concentration of 0.5 mm dNTP, 1× RT buffer, and 0.1 U/μl of SuperscriptII and incubated at 42°C for 60 min. Second strand was synthesized as recommended by the manufacturer's instructions (GIBCO-BRL, MD). After purification by phenol–chloroform extraction and ethanol precipitation, cDNA was dissolved in an appropriate volume of distilled water. Concentrations of cDNAs were adjusted by staining with cybergreen I and measuring the fluorescence intensities using a fluoroimage analyzer (Fuji LAS1000). A standard curve made with samples of known concentrations of DNAs was used for calculation of DNA concentrations from fluorescence intensities. One microgram of cDNA was cleaved with 5 units of MboI [New England Biolabs (NEB), MA] in 20 μl of recommended buffer for 60 min at 37°C. After heat inactivation for 20 min at 70°C, 1 μl of 10 mm ATP and 100 pmoles of kinated adaptor cassette, 100 units of T4 ligase (NEB) were added to the reaction mixture and incubated at 16°C for 3 hr. Equal volumes of ligation reaction were pooled and the concentration of the pools of cDNAs was adjusted to 1 ng/μl with 0.1 μg/μl of glycogen solution before use.
Profiling PCR Reactions
The profiling PCR reactions contained 2 pmoles each of F-T7(25) and a gene-specific antisense primer, 0.1 ng of template pool, and 0.1 unit of Platinum Taq polymerase (GIBCO-BRL) in 10 μl of reaction mixture recommended by the manufacturer. The template concentration was set to detect 1 in 100,000 transcript in a source RNA. Thermal profile was 35 cycles of 94°C, 55°C, and 72°C for 30 sec each with an initial 2 min at 94°C and a final 72°C for 7 min. An autosequencer 377XL and GeneScan program (PE Biosystems) were used for sizing and quantitation of dye-labeled fragments.
PCR mixture (0.25 μl) was mixed with 3 μl of formamide-loading buffer (PE Biosystems, CA) containing 1/4 volume of internal size marker (Tamra 350, PE Biosystems). After denaturation at 96°C for 3 min, 0.5 μl of sample was separated on 10% acrylamide 6 m urea gel with a 15-cm well-to-detector distance. Analysis was done according to the manufacturer's instructions for GeneScan.
Northern Hybridization
Human poly(A) RNAs were purchased from Clontech. Two micrograms each of poly(A) RNA was separated on formalin–agarose gels and transferred to Hybond-N membrane (Amersham Pharmacia). Probes were synthesized by PCR with appropriate sets of gene-specific primers. Biotin-dUTP was incorporated by random-priming DNA synthesis using a commercial kit (Boehringer Mannheim). Hybridization was performed according to the manufacturer's instructions. Chemiluminescence signals were detected and analyzed by Fuji LAS1000.
Amplification of Total cDNA
After adaptor ligation, 1 ng of adapted vector-primed cDNA was added to the 100 μl of PCR mixture containing 5 units of Platinum Taq (GIBCO BRL), 0.2 mm dNTP, 1× Platinum Taq buffer, and 10 pmoles each of primers T7(25) and Bam7T. Amplification conditions were 94°C for 3 min, 15 cycles of 94°C for 30 sec, 55°C for 30 sec, 72°C for 2 min, and final incubation at 72°C for 10 min. After cleavage with 10 units of MboI for 1 hr at 37°C, reaction mixture was extracted once with phenol and once with chloroform. DNA was recovered by ethanol precipitation. After dissolving in 100 μl of distilled water, DNA concentration was measured by LAS1000 as described above.
Independent 192 3′ ESTs from hepG2 cells were selected from GenBank and one antisense primer was synthesized for each. Accession numbers of ESTs and primer sequences are obtainable through the world wide web at http://imcb.osaka-u.ac.jp/okubo/materials/primer_GR
Figure 5.
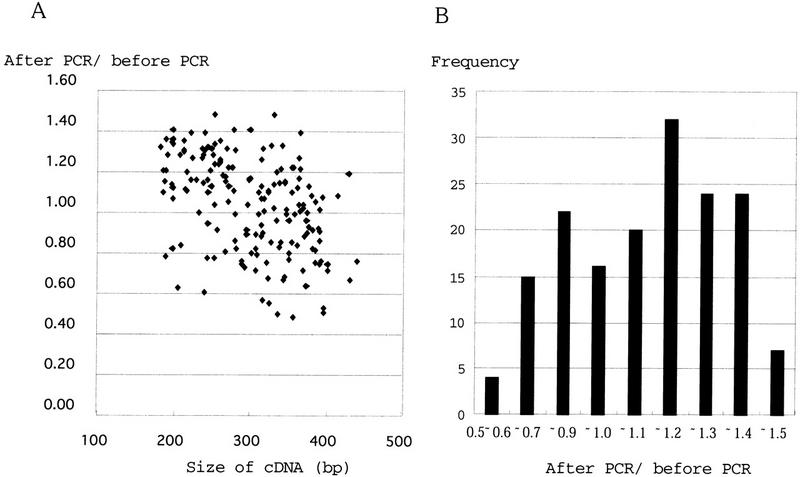
(A) Amplification ratios of 175 cDNAs and their sizes. Correlation between amplification ratio (after PCR/before PCR) and insert size was tested by Spearman's correlation coefficient by rank test (StatView 4.0, ABACUS Concepts, Inc., MA) and a moderate correlation was suggested. The correlation coefficient (r) with risk <0.5% was −0.47. P = 7.6 × 10⁻¹⁰; Z = −6.15, Z (0.975) = 1.96. (B) Frequency distribution of amplification ratios. The average of ratio was 1.1 with standard deviation of 0.24.
Acknowledgments
This work was supported by grant 08283105, Grant-in-Aid for Scientific Research on Priority Areas from the Ministry of Education, Science and Culture of Japan and grant 96L00104 from the Research for the Future (RFTF) of Japan Society for the Promotion of Science.
The publication costs of this article were defrayed in part by payment of page charges. This article must therefore be hereby marked “advertisement” in accordance with 18 USC section 1734 solely to indicate this fact.
Footnotes
Corresponding author.
E-MAIL kousaku@imcb.osaka-u.ac.jp; FAX +81-6-877-1922.
REFERENCES
- Adams MD, Dubnick M, Kerlavage AR, Moreno R, Kelley JM, Utterback TR, Nagle JW, Fields C, Venter JC. Sequence identification of 2,375 human brain genes [see comments] Nature. 1992;355:632–634. doi: 10.1038/355632a0. [DOI] [PubMed] [Google Scholar]
- Becker-Andre M, Hahlbrock K. Absolute mRNA quantification using the polymerase chain reaction (PCR). A novel approach by a PCR aided transcript titration assay (PATTY) Nucleic Acids Res. 1989;17:9437–9446. doi: 10.1093/nar/17.22.9437. [DOI] [PMC free article] [PubMed] [Google Scholar]
- Candia AF, Hu J, Crosby J, Lalley PA, Noden D, Nadeau JH, Wright CV. Mox-1 and Mox-2 define a novel homeobox gene subfamily and are differentially expressed during early mesodermal patterning in mouse embryos. Development. 1992;116:1123–1136. doi: 10.1242/dev.116.4.1123. [DOI] [PubMed] [Google Scholar]
- Deloukas P, Schuler GD, Gyapay G, Beasley EM, Soderlund C, Rodriguez-Tome P, Hui L, Matise TC, McKusick KB, Beckmann JS, Bentolila S, et al. A physical map of 30,000 human genes. Science. 1998;282:744–746. doi: 10.1126/science.282.5389.744. [DOI] [PubMed] [Google Scholar]
- Duggan DJ, Bittner M, Chen Y, Meltzer P, Trent JM. Expression profiling using cDNA microarrays. Nature Genet. 1999;21:10–14. doi: 10.1038/4434. [DOI] [PubMed] [Google Scholar]
- Iyer VR, Eisen MB, Ross DT, Schuler G, Moore T, Lee JCF, Trent JM, Staudt LM, Hudson J, Jr, Boguski MS, et al. The transcriptional program in the response of human fibroblasts to serum [see comments] Science. 1999;283:83–87. doi: 10.1126/science.283.5398.83. [DOI] [PubMed] [Google Scholar]
- Kato K. Description of the entire mRNA population by a 3′ end cDNA fragment generated by class IIS restriction enzymes. Nucleic Acids Res. 1995;23:3685–3690. doi: 10.1093/nar/23.18.3685. [DOI] [PMC free article] [PubMed] [Google Scholar]
- ————— Adaptor-tagged competitive PCR: A novel method for measuring relative gene expression. Nucleic Acids Res. 1997;25:4694–4696. doi: 10.1093/nar/25.22.4694. [DOI] [PMC free article] [PubMed] [Google Scholar]
- Liang P, Pardee AB. Differential display of eukaryotic messenger RNA by means of the polymerase chain reaction [see comments] Science. 1992;257:967–971. doi: 10.1126/science.1354393. [DOI] [PubMed] [Google Scholar]
- Lockhart DJ, Dong H, Byrne MC, Follettie MT, Gallo MV, Chee MS, Mittmann M, Wang C, Kobayashi M, Horton H, Brown EL. Expression monitoring by hybridization to high-density oligonucleotide arrays [see comments] Nat Biotechnol. 1996;14:1675–1680. doi: 10.1038/nbt1296-1675. [DOI] [PubMed] [Google Scholar]
- McCulloch RK, Choong CS, Hurley DM. An evaluation of competitor type and size for use in the determination of mRNA by competitive PCR. PCR Methods Appl. 1995;4:219–226. doi: 10.1101/gr.4.4.219. [DOI] [PubMed] [Google Scholar]
- McGall G, Labadie J, Brock P, Wallraff G, Nguyen T, Hinsberg W. Light-directed synthesis of high-density oligonucleotide arrays using semiconductor photoresists. Proc Natl Acad Sci. 1996;93:13555–13560. doi: 10.1073/pnas.93.24.13555. [DOI] [PMC free article] [PubMed] [Google Scholar]
- Morrison C, Gannon F. The impact of the PCR plateau phase on quantitative PCR. Biochim Biophys Acta. 1994;1219:493–498. doi: 10.1016/0167-4781(94)90076-0. [DOI] [PubMed] [Google Scholar]
- Nonchev S, Vesque C, Maconochie M, Seitanidou T, Ariza-McNaughton L, Frain M, Marshall H, Sham MH, Krumlauf R, Charnay P. Segmental expression of Hoxa-2 in the hindbrain is directly regulated by Krox-20. Development. 1996;122:543–554. doi: 10.1242/dev.122.2.543. [DOI] [PubMed] [Google Scholar]
- Okubo K, Hori N, Matoba R, Niiyama T, Fukushima A, Kojima Y, Matsubara K. Large scale cDNA sequencing for analysis of quantitative and qualitative aspects of gene expression [see comments] Nature Genet. 1992;2:173–179. doi: 10.1038/ng1192-173. [DOI] [PubMed] [Google Scholar]
- Pannetier C, Delassus S, Darche S, Saucier C, Kourilsky P. Quantitative titration of nucleic acids by enzymatic amplification reactions run to saturation. Nucleic Acids Res. 1993;21:577–583. doi: 10.1093/nar/21.3.577. [DOI] [PMC free article] [PubMed] [Google Scholar]
- Southern E, Mir K, Shchepinov M. Molecular interactions on microarrays. Nature Genet. 1999;21:5–9. doi: 10.1038/4429. [DOI] [PubMed] [Google Scholar]
- Volkenandt M, Dicker AP, Banerjee D, Fanin R, Schweitzer B, Horikoshi T, Danenberg K, Danenberg P, Bertino JR. Quantitation of gene copy number and mRNA using the polymerase chain reaction. Proc Soc Exp Biol Med. 1992;200:1–6. doi: 10.3181/00379727-200-43387. [DOI] [PubMed] [Google Scholar]
- Wodicka L, Dong H, Mittmann M, Ho MH, Lockhart DJ. Genome-wide expression monitoring in Saccharomyces cerevisiae. Nat Biotechnol. 1997;15:1359–1367. doi: 10.1038/nbt1297-1359. [DOI] [PubMed] [Google Scholar]