

SUMMARY
We created a whole-mount in situ hybridization (WISH) database, termed EMBRYS, containing expression data of 1520 transcription factors and cofactors expressed in E9.5, E10.5, and E11.5 mouse embryos—a highly dynamic stage of skeletal myogenesis. This approach implicated 43 genes in regulation of embryonic myogenesis, including a transcriptional repressor, the zinc-finger protein RP58 (also known as Zfp238). Knockout and knockdown approaches confirmed an essential role for RP58 in skeletal myogenesis. Cell-based high-throughput transfection screening revealed that RP58 is a direct MyoD target. Microarray analysis identified two inhibitors of skeletal myogenesis, Id2 and Id3, as targets for RP58-mediated repression. Consistently, MyoD-dependent activation of the myogenic program is impaired in RP58 null fibroblasts and downregulation of Id2 and Id3 rescues MyoD’s ability to promote myogenesis in these cells. Our combined, multi-system approach reveals a MyoD-activated regulatory loop relying on RP58-mediated repression of muscle regulatory factor (MRF) inhibitors.
INTRODUCTION
Spatiotemporal expression of transcription factors (TFs) plays a central role in cell differentiation and organ development during embryogenesis (Burke et al., 1995; Gray et al., 2004; Jessell, 2000). Combinatorial activity of TFs positively or negatively regulates specific gene expression patterns essential for tissue development and cell fate determination.
Skeletal myogenesis, in which myogenic precursors differentiate into myoblasts and then form multinucleated myotubes, is an ideal system to understand multistaged transcriptional regulatory networks functioning during vertebrate development (Arnold and Braun, 1996). During skeletal myogenesis, distinct subsets of genes are expressed with partially overlapping kinetics to form a complex network of interdependent pathways (Blais et al., 2005; Cao et al., 2006; Penn et al., 2004). The muscle-specific basic helix-loop-helix (bHLH) transcription factors, MyoD, Myf5, Myogenin (Myog), and MRF4, initiate and perpetuate the myogenic program in collaboration with MEF2. Genetic evidence indicates that MyoD and/or Myf5 are critical for myogenic cell fate (Braun et al., 1992; Rudnicki et al., 1992), whereas Myog regulates terminal differentiation (Hasty et al., 1993; Nabeshima et al., 1993). MRF4 is suggested to act at both early determination and terminal differentiation stages (Kassar-Duchossoy et al., 2004; Zhang et al., 1995). Muscle bHLH proteins bind the E-box sequence (CANNTG) on regulatory elements of muscle genes, often in close proximity with MEF2 binding sites (Puri and Sartorelli, 2000). Heterodimerization of bHLH proteins with E-proteins (E12/E47) allows productive interaction with the E-box (Blackwell et al., 1990; Blackwell and Weintraub, 1990; Murre et al., 1989) and is regulated indirectly by Id proteins, which are HLH transcription factors lacking DNA-binding basic domains (Benezra et al., 1990). These proteins sequester E-proteins into inactive complexes, thereby preventing formation of bHLH/E-proteins heterodimers and their DNA-binding and transcriptional activities. Consistent with a proposed role for Id proteins as inhibitors of terminal differentiation, Id mRNAs are detected in proliferating skeletal muscle and are downregulated in differentiated muscle cultures (Benezra et al., 1990; Chen et al., 1997).
Recent genome-wide approaches using chromatin immunoprecipitation (ChIP) to assess binding activity of MyoD and Myog to a promoter array reveal a complex mechanism coordinating expression of distinct subsets of genes by these critical activators during skeletal myogenesis (Blais et al., 2005; Cao et al., 2006). At an early differentiation stage, MyoD alone activates direct downstream genes and then maintains activation of the myogenic program (Blais et al., 2005; Cao et al., 2006). However, how MyoD acts to repress transcriptional programs, such as those mediated by Id proteins, which would otherwise inhibit skeletal myogenesis, is not well known.
One postgenomic strategy used to identify molecular networks functioning in tissue development is microarray analysis of individual cell types or tissues followed by in situ hybridization to identify temporal and spatial gene expression patterns. A disadvantage of this approach is that it does not detect gene expression restricted to small areas. In addition, it is difficult to identify common or specific developmental molecular networks from in situ hybridization data collected separately by independent researchers.
To obtain comprehensive spatiotemporal profiles of transcription factors during embryonic development, we created a whole-mount in situ hybridization database, called “EMBRYS” (http://embrys.jp/), for 1520 transcription factors and cofactors, using whole mouse embryos at midgestational stages (Embryonic Days [E] 9.5, 10.5, and 11.5), during which striking dynamic changes in pattern formation and organogenesis occur. Using this database, we annotated gene expression patterns underlying critical developmental events. Specifically, we identified a gene cluster expressed during limb skeletal myogenesis. Among 43 transcription regulators showing myogenic expression in the limb bud, we identified the transcriptional repressor RP58 and found that myogenesis was severely perturbed in RP58 null mice, in C2C12 cells expressing RP58 shRNA, and in RP58 null fibroblasts, in which myogenesis is induced by ectopic expression of MyoD. We utilized high-throughput, cell-based transfection assays and found that MyoD promotes RP58 gene expression. DNA microarray analysis with bioinformatics identified Id2 and Id3 as direct RP58 targets. Overall our combined systems approach identified RP58 as an effector included in MyoD-activated positive feedback and enabling progression of skeletal myogenesis by repressing expression of Id2 and Id3, inhibitors of myogenesis.
RESULTS
Database Construction
To identify and characterize effectors of the transcriptional network regulating developmental processes, we developed a web-based comprehensive WISH database for transcriptional regulators using E9.5, 10.5, and 11.5 mouse embryos (Figure 1). To do so, we combined published databases (Kanamori et al., 2004; Thomas et al., 2003) to generate a list of 2911 transcription regulators (see Figure S1 available online). We then prepared from cDNA libraries 1520 digoxigenin-labeled RNA probes (Table S1). Using WISH results, we constructed a database, termed “EMBRYS”, covering these 3 embryonic days (Figure 1A and Tables S1–S3, available at http://embrys.jp/embrys/html/MainMenu.html).
Figure 1. Myogenic Expression of RP58 Based on the WISH Database.

(A) Flow chart of database construction.
(B) Representation of annotated gene expression. Gene expression detected by WISH was evaluated in several anatomical structures. (Left) Lateral views of embryos at E9.5, 10.5, and 11.5. Hybridization signals detected in colored areas were evaluated visually. Magnification of each photo is not uniform. (Upper Right) Anatomical drawing of the brain at each stage. (Bottom Right) Dorsal view of trunk. Boxed area is enlarged and detailed structures are visualized by WISH performed with markers of each structure. PSM, presomitic mesoderm.
(C) Signal intensity is evaluated as follows: 2, intense (as in the posterior part of the forelimb bud); 1, moderate (as in Progress Zone, PZ); or blank, no signal or not determined. Areas showing no detectable signal, such as the regions of brain, are annotated “Not Stained,” and staining that could not be interpreted is evaluated as “Not Determined” and indicated as blank cells in Table S4.
(D) Gene expression patterns in the developing limb bud are shown in detail, and colored areas are individually evaluated. AER, apical ectodermal ridge; PZ, progress zone.
Annotation of Gene Expression
We annotated expression patterns of each gene in the EMBRYS database as defined in Figures 1B–1D and Table S4. In particular, WISH enables analysis of limb development in three-dimensional axes during embryogenesis and provides highly precise gene expression information (Kawakami et al., 2003; Mariani and Martin, 2003). Our analysis indicated that 962 genes showed detectable signals in the entire embryo over these 3 days and that 691 were expressed in the limb bud. Information relative to these expression patterns is summarized in Table S5.
RP58 Is Expressed in Skeletal Muscle Tissues and in C2C12 Cells
Based on EMBRYS, we identified 43 genes showing myogenesis-related expression patterns in the limb bud from E9.5–E11.5 (Table 1 and Figure S2). Among them, RP58 was one of the few genes whose function in skeletal myogenesis has not been previously characterized (Figure 2A).
Table 1.
Profile of Genes Expressed in Limb Muscle
| NCBI Gene ID | Symbol | Alternative | Domain | Expression | |
|---|---|---|---|---|---|
| 1 | 218490 | Btf3 | 1700054E11Rik | 2 | |
| 2 | 59035 | Carm1 | Prmt4 | 1 | |
| 3 | 107951 | Cdk9 | PITALRE | 1 | |
| 4 | 56449 | Csda | MSY4 | 2 | |
| 5 | 269713 | Clip2 | Cyln2 | 1 | |
| 6 | 13194 | Ddb1 | AA408517 | 1 | |
| 7 | 226049 | Dmrt2 | Terra | DM | 1 |
| 8 | 15205 | Hes1 | Hry | bHLH | 1 |
| 9 | 55927 | Hes6 | AI326893 | bHLH | 2 |
| 10 | 15384 | Hnrnpab | Hnrpab | 2 | |
| 11 | 15516 | Hsp90ab1 | Hspcb | 2 | |
| 12 | 15902 | Id2 | Idb2 | bHLH | 2 |
| 13 | 15903 | Id3 | Idb3 | bHLH | 2 |
| 14 | 16468 | Jarid2 | Jmj | ARID | 2 |
| 15 | 50868 | Keap1 | INRF2 | 1 | |
| 16 | 16814 | Lbx1 | Lbx1h | Homeobox | 2 |
| 17 | 17220 | Mcm7 | Mcmd7 | 2 | |
| 18 | 17258 | Mef2a | A430079H05Rik | MADS-box | 1 |
| 19 | 17260 | Mef2c | 5430401D19Rik | MADS-box | 2 |
| 20 | 17261 | Mef2d | MGC31718 | MADS-box | 1 |
| 21 | 17283 | Men1 | AW045611 | 1 | |
| 22 | 17286 | Meox2 | Mox2 | Homeobox | 2 |
| 23 | 18432 | Mybbp1a | p67MBP | 2 | |
| 24 | 17869 | Myc | c-myc | bHLH | 2 |
| 25 | 17877 | Myf5 | Myf-5 | bHLH | 2 |
| 26 | 17927 | Myod1 | MyoD | bHLH | 2 |
| 27 | 17928 | Myog | Myogenin | bHLH | 2 |
| 28 | 110109 | Nop2 | Nol1 | 2 | |
| 29 | 23967 | Osr1 | Odd1 | ZF C2H2 | 2 |
| 30 | 18505 | Pax3 | splotch | Homeobox | 2 |
| 31 | 18742 | Pitx3 | Ptx3 | Homeobox | 2 |
| 32 | 19401 | Rara | Nr1b1 | NR | 2 |
| 33 | 56190 | Rbm38 | Rnpc1 | 1 | |
| 34 | 67097 | Rps10 | 2210402A09Rik | 1 | |
| 35 | 20471 | Six1 | BB138287 | Homeobox | 2 |
| 36 | 12180 | Smyd1 | Bop | ZF MYND | 2 |
| 37 | 64406 | Sp5 | ZF C2H2 | 2 | |
| 38 | 20901 | Strap | AW557906 | 1 | |
| 39 | 21413 | Tcf4 | E2-2 | bHLH | 2 |
| 40 | 21416 | Tcf7l2 | Tcf-4 | HMG | 2 |
| 41 | 21681 | Thoc4 | REF1 | 2 | |
| 42 | 22608 | Ybx1 | YB-1 | 2 | |
| 43 | 30928 | Zfp238 | RP58 | ZF C2H2 | 2 |
Total profiles of genes expressed in the E11.5 muscle-forming region. Forty-three genes were identified as muscle transcription factors by EMBRYS database. NCBI gene ID (http://www.ncbi.nlm.nih.gov/), gene symbol, alternative gene name, representative predicted DNA binding domain (domain), and intensity of expression in limb muscle (expression) based on EMBRYS analysis are shown in each column, respectively. Although migration of myogenic cells from trunk to forelimb starts around E9.5, we cannot identify the signal as being derived from muscle cells at E9.5 and E10.5 limb middle mesenchyme. However, we did classify muscle expression genes based on expression patterns of MyoD and Myog at E11.5 (cf Figure 2A; Figure S2; Table S4). We screened, collected, and annotated “muscle genes” using this pattern in E11.5 limb bud. Thus, these 43 genes are identified. In the Expression column, “2” indicates an intense signal and “1” indicates moderate expression in limb muscle (cf Figure 1C). Abbreviations: DM, dsx and mab-3; bHLH, basic helix-loop-helix; ARID, AT-rich interaction domain; MADS, MCM1, Agamous, Deficiens, and SRF; ZF, zinc finger; NR, nuclear receptors; HMG, high-mobility group. Blank indicates genes do not encode TFs.
Figure 2. RP58 Expression in Mouse Limb Bud and in C2C12 Culture.
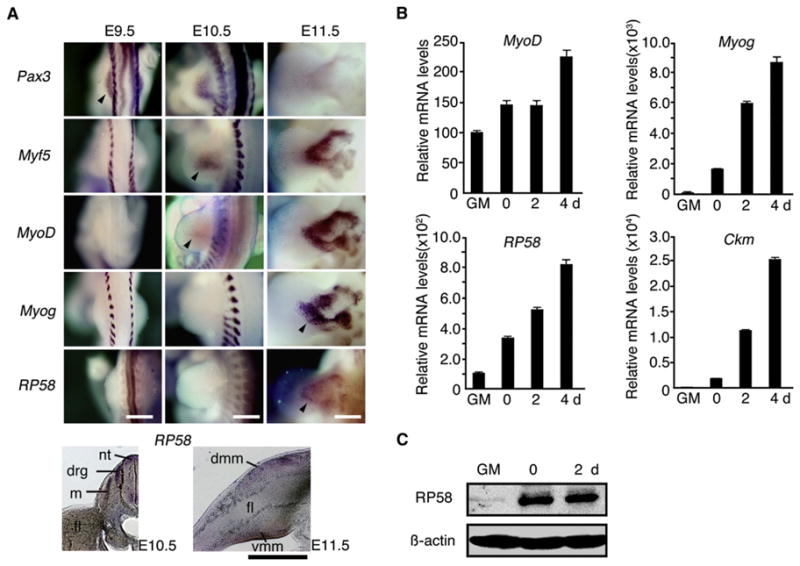
(A) Expression patterns of muscle-related transcription factors (Pax3, Myf5, MyoD, and Myog) and RP58 in mouse limb bud at E9.5, 10.5, and 11.5, as determined by WISH. At the bottom are sections of an E10.5 (Left) or E11.5 (Right) embryo showing RP58 expression. Abbreviations: m, myotome; drg, dorsal root ganglia; nt, neural tube; dmm, dorsal muscle mass; vmm, ventral muscle mass; fl, forelimb. Bar, 500 μm.
(B) Real-time PCR analysis of RP58 and myogenesis-associated genes in C2C12 cells cultured in GM or DM for 0, 2, or 4 days (d). Error bars, SEM (n = 3).
(C) Western blotting for RP58 during C2C12 cell myogenic stages.
RP58 mRNA expression was first detectable at E11.5 in the limb bud in a pattern typical of myogenesis (Figure 2A) and coincident with upregulation of Myog (Figure 2A). By contrast, Pax3, a marker of myogenic precursors (Bober et al., 1994; Williams and Ordahl, 1994), is expressed in the limb bud at E9.5, and Myf5 and MyoD are expressed at E10.5 (Figure 2A). In Splotch mutant mice (Pax3Sp/Sp), in which muscle tissues do not form in limb buds because of defects in migration of myogenic precursors from somites (Daston et al., 1996), no RP58 signals were observed in limb buds by WISH analysis, confirming myogenic expression of RP58 (Figure S3). RP58 was also expressed in brain and spinal cord, as previously reported (Ohtaka-Maruyama et al., 2007; Okado et al., 2009). Collectively, these data indicate that RP58 is a potential downstream target of muscle lineage and determination factors.
We used C2C12 muscle cells (Blau et al., 1983; Yaffe and Saxel, 1977) to monitor RP58 expression during muscle differentiation in vitro. RP58 mRNA and protein expression was upregulated at early stages of C2C12 differentiation (on differentiation day 0 [0d]; Figures 2B and 2C), with an expression pattern overlapping that of Myog and prior to expression of late muscle markers, such as Ckm (creatine kinase, muscle). These data suggest that RP58 is an early muscle differentiation gene.
RP58 Knockdown Results in Differentiation Defects in Skeletal Muscle
We first examined the role of RP58 in myogenesis by generating C2C12 cell lines stably expressing RP58 shRNA. RP58 knockdown in C2C12 myoblasts (on differentiation day 4 [4d]; Figure 3A) severely impaired their ability to form multinucleated myotubes and to induce the late-muscle gene Myosin Heavy Chain (MyHC) at differentiation day 4 (4d) (Figures 3B and 3C).
Figure 3. RP58 Knockdown Inhibits Myogenesis.

(A) Western blotting for RP58 in C2C12 lines stably expressing RP58 shRNA (shRP58) or control shRNA (Ctl) on differentiation day 2.
(B) Immunocytochemistry for MyHC and DAPI staining in C2C12 lines stably expressing RP58 shRNA (shRP58) or control shRNA (Ctl) on differentiation day 4. Bar, 200 μm.
(C) Percentage of MyHC-positive nuclei in RP58 knockdown (shRP58) or control (Ctl) C2C12 cells of (B) in three independent fields. Error bars, SD (n = 3).
(D) H&E staining of hindlimb muscles from WT and RP58−/− mice (E18.5). Higher magnifications of boxed regions in left panels are shown in right panels. Arrowheads indicate an abnormal population of mononucleate cells in RP58−/− skeletal muscle tissues. Bar, 50 μm.
(E) Haematoxylin and eosin staining of diaphragm from WT and RP58−/− mice (E18.5, arrow). Lu, lung; Li, liver. Bars, 50 μm.
To determine the role of RP58 during skeletal myogenesis in vivo, we analyzed skeletal muscle phenotypes in RP58 null mice (Okado et al., 2009). RP58 null mice died immediately after birth. At E18.5 the size of wild-type and null embryos was equivalent (data not shown); however, muscle differentiation of RP58 null mice was severely disrupted, as revealed by hematoxylin and eosin (H&E) staining (Figure 3D and 3E and Figure S4). In knockout mice, regions of the hindlimb normally populated by multinucleate muscle fibers instead exhibited large areas of mononucleate cells and showed a striking reduction in the number of myofibers (Figure 3D and Figure S4). A dramatic reduction in the size of the diaphragm and other skeletal muscle was apparent in RP58−/− mice, as compared with wild-type mice (Figure 3E and Figure S4). MyHC and troponin T-positive cells in RP58−/− mice are significantly reduced, although the few remaining myofibers in the limb field showed normal morphology (Figure S4).
Next, to determine whether muscle impairment seen in RP58 null mice was caused by inhibition of myogenic precursor migration from the dermomyotome to appendicular muscle tissues, we examined expression of Pax3, a marker of the migratory myogenic precursors, in RP58 null mice. The Pax3 expression pattern was not altered in limb of RP58 knockout mice at E10.5, indicating that migration of muscle precursors to the limb field was not affected by loss of RP58 (Figure S5).
Cell-Based HTS Reveals that MyoD Functions Upstream of RP58
Next we asked what upstream factors promote RP58 expression in muscle cells. To do so, we generated a system in which 6049 cDNA expression vectors were arrayed on 384-well plates and used to transfect 293T cells along with a reporter plasmid containing RP58 control sequences, and monitored for luciferase activity. To construct the reporter, the human RP58 promoter sequence (−5K to +3K) was compared with that of mouse, chimpanzee, dog, chicken, Xenopus, and zebrafish by VISTA browser (Frazer et al., 2004). A 3.4Kb region (from −3180 to +170 of mouse RP58), which is highly conserved in mammalian species, was identified and subcloned into the pGL4.12 luciferase vector in front of a luciferase cassette (Figure 4A).
Figure4. High-Throughput TransfectionScreening of RP58 Initiators.

(A) HTS scheme.
(B) Luciferase activity of pGL4.12, pGL4.12-RP58-1.6K, or pGL4.12-RP58-3.4K reporters in 293T cells tranected with MyoD-, NEUROD1-, NEUROG1-, NEUROG2-expressing vectors or empty vector. Error bars, SD (n = 3).
(C) (Upper panel) Reporter vector pGL4.12-RP58-1.6K and the corresponding upstream region of RP58. Relative positions and sequences of E-boxes E1, E2, and E3, which are potential MyoD binding sites, are shown with mutations introduced into these regions. (Lower panel) Luciferase activity of various reporters, mutated either individually or in combination, in 293T cells transfected with MyoD-expressing or empty vector. Error bars, SD (n = 3).
(D) Quantitative ChIP analysis using anti-MyoD or anti-acetyl-histone 3 antibody (α-Ac-H3) on E1 and E2, potential MyoD binding sites on RP58 promoter, in C2C12 cells cultured in GM or DM. Error bars, SEM (n = 3).
(E) Immunohistochemistry of transverse sections of fore-limb level somites in E10.5 wild-type (WT) or RP58−/− mice using anti-MyoD or -Myog antibodies. Counterstaining was performed using DAPI. Bar, 100 μm.
On the first screen, 11 of 6049 clones showed a greater than 1.5-fold increase in RP58 promoter activity compared with empty plasmid controls. An additional screen was performed using both the RP58 3.4K and a shorter 1.6K promoter (−1596 to −1). This screen identified the bHLH proteins MyoD, NEUROG1, NEUROG2, and NEUROD1 as transcriptional activators of the RP58 promoter (Figure 4B). All of these proteins increased the 3.4K promoter activity more than 5-fold and the 1.6K promoter activity more than 20-fold (Figure 4B). These data place RP58 as a potential target of muscle- and neural-specific bHLH factors and suggest that RP58 functions in transcriptional networks regulating both skeletal myogenesis and neurogenesis. Sequence-specific bHLH transcription factors, such as MyoD, typically activate transcription by binding to E-box sequences (CANNTG). A TFSEARCH (http://mbs.cbrc.jp/research/db/TFSEARCH.html) identified three E-boxes (E1-3) within the 1.6K RP58 promoter region (Figure 4C). Disruption of E1 or E2, but not E3, by point mutations reduced MyoD-dependent promoter activity, and disruption of both E1 and E2 almost completely abrogated MyoD-dependent promoter activity (Figure 4C), indicating that E1 and E2 are critical for MyoD-dependent RP58 expression. To investigate MyoD binding to the E1 and E2 sites, we undertook ChIP analysis using an anti-MyoD antibody in C2C12 cells cultured in growth medium (GM) or differentiation medium (DM) (Figure 4D). We found that MyoD bound to the RP58 promoter in DM more strongly than in GM and that the histone acetylation state of RP58 in DM was higher than in GM.
Significantly, MyoD and its target, Myog, are both expressed in the myotome of RP58 null mice at the protein level at E10.5 (Figure 4E). Furthermore, RP58 mRNA is detected in Myog KO mice (Figure S6). These results suggest that MyoD-Myog pathway and MyoD-RP58 pathway may represent two distinct branches functioning in skeletal myogenesis.
Id2 and Id3 Are Directly Repressed by RP58 in Myogenesis
RP58 was originally identified as a DNA-binding transcriptional repressor associated with transcriptionally silent heterochromatin (Aoki et al., 1998). However, its physiological target genes were unidentified. We confirmed that RP58 functions as a transcriptional repressor in C2C12 cells using a putative RP58 binding sequence reporter system (Fuks et al., 2001) (data not shown). To identify RP58-regulated genes involved in myogenesis, profiling experiments were performed comparing RNA derived from C2C12 cells with or without expression of RP58 shRNA. In C2C12 cells stably expressing shRNA-RP58, 271 genes were upregulated relative to control cells (Figure 5A and Table S6). Given its repressor function, these upregulated genes are potential targets of RP58 repression. In parallel, we evaluated dynamic gene expression patterns during myogenesis by microarray at four different differentiation stages of wild-type C2C12 cells (GM, and differentiation days 0, 2, and 4). This analysis identified 399 genes downregulated as differentiation proceeded (Figure 5A and Table S7). Strikingly, we observed high overlap between those genes and genes upregulated in C2C12 cells expressing RP58 shRNA (195 genes; Figure 5A; Tables S8, S10, and S11). To identify direct targets of RP58 among the above candidates, we screened for predicted RP58 binding sites in candidate promoters (from −7K to +3K; Table S9). If RP58 binds to such sequences, the binding sites would likely be conserved. To search for such sites, sequences were compared among mouse, human, and opossum using UCSC BLAT (Kent, 2002). Highly conserved consensus RP58 binding sequences were seen in four genes (Id2, Id3, Pea3 [Etv4], and Tubb3; Figure 5A), all of which were significantly downregulated in differentiating C2C12 cells and upregulated in RP58 knockdown C2C12 cells (Figure 5B; data not shown).
Figure 5. Microarray Analysis for RP58 shRNA-Expressing C2C12 Cells.

(A) Venn diagram of genes upregulated by treatment with RP58 shRNA (“shRNA”) and downregulated as C2C12 cells differentiate (“timecourse”).
(B) Real-time PCR of Id2, Id3, and Ckm in C2C12 cells cultured in growth (GM) or differentiation (DM) medium at 0, 2, or 4 days (d) or in control- (Ctl) or RP58- (sh) shRNA-expressing C2C12 cells. Error bars, SEM (n = 3).
(C) Real-time PCR of Id2 and Id3 in C2C12 cells infected with RP58-expressing or control adenovirus. Error bars, SEM (n = 3).
(D) Real-time PCR of Id2, Id3, and Ckm in diaphragm of RP58 KO or WT mice (E18.5). Error bars, SEM (n = 3).
(E) Immunohistochemistry of transverse section of wild-type (RP58+/+) and RP58 KO (RP58−/−) mice at E10.5 (Left panel) and E13.5 (Right panel), using anti-Id2 (for both E10.5 and E13.5) or -Id3 (for E10.5) antibodies. Counterstaining was performed using DAPI. In E13.5, boxed areas are enlarged in the right panel. Bars, 100 μm (E10.5), and 200 μm (E13.5), respectively.
Among them, Id2 and Id3 were of particular interest as they are known inhibitors of skeletal myogenesis (Chen et al., 1997; Kurabayashi et al., 1994; Melnikova and Christy, 1996). We confirmed that constitutive overexpression of Id2 and Id3 in C2C12 cells severely inhibits fusion of myoblasts into myotubes, in agreement with other reports (Figure S7; Chen et al., 1997; Kurabayashi et al., 1994; Melnikova and Christy, 1996). Significantly, infection of C2C12 cells with RP58-expressing adenovirus reduced Id2 and Id3 expression levels compared with control adenovirus (Figure 5C).
Our EMBRYS database also detected Id2 and Id3 mRNA expression in limb skeletal muscle (Table 1 and Figure S2). RP58 is further expressed in limb muscle at E12.5 and 13.5, but Id2 and Id3 expression is downregulated at these stages (Figure S8). Consistently, we detected abnormally higher levels of Id2 and Id3 in E18.5 diaphragm muscle from RP58 null mice (Figure 5D). On the contrary, decreased levels of Ckm mRNA in the same samples further support a functional link between RP58-mediated repression of Id proteins and activation of late stages of skeletal myogenesis (Figure 5D). The upregulated Id2 and Id3 expression was also observed at earlier stages of myogenesis in the somite at E10.5 and limb at E13.5 of RP58 null mice compared with wild-type mice (Figure 5E).
To determine whether Id2 and Id3 are directly downregulated by RP58, we performed transfection assays with luciferase reporters and ChIP assays (Figures 6A–6C). The activities of a luciferase reporter gene fused to putative RP58 binding sites (in Id2 −2576 to −2966 or in Id3 −3318 to −3028) were reduced following RP58 expression in C2C12 cells (Figures 6A and 6B). ChIP analysis of C2C12 cells using an anti-Flag antibody showed that Flag-RP58 bound to chromatin of Id2 and Id3 regulatory sequences (Figure 6C). We further explored the “MyoD-RP58-Id2, 3” cascade by evaluating the ability of MyoD to activate the myogenic program in 10T1/2 fibroblasts derived from either wild-type (WT) or RP58−/− mouse embryonic fibroblasts (MEF). Ectopic expression of MyoD efficiently converts WT 10T1/2 fibroblasts into muscle cells, as previously reported (Weintraub et al., 1989), but fails to activate the myogenic program in RP58−/− 10T1/2 fibroblasts (Figure 6D). The resistance of RP58−/− 10T1/2 fibroblasts to MyoD-mediated myogenic conversion correlated with increased levels of Id2 and Id3, which are otherwise downregulated by ectopic expression of MyoD in WT 10T1/2 fibroblasts (Figure 6D). Knockdown of Id2 and Id3 by siRNA restored MyoD-dependent activation of the myogenic program in RP58−/− 10T1/2 fibroblasts (Figure 6E) leading to the formation of multinucleated myotubes (Figure S9).
Figure 6. Id2 and Id3 Are Direct Targets of RP58.

(A) Location and sequence (in mouse, human, and opossum) of highly conserved putative RP58 binding sites in Id2 (upper) or Id3 (bottom) promoters.
(B) Luciferase activity of TK-Luc (Empty), BS10-Luc (BS10), Id2-Luc (Id2), or Id3-Luc (Id3) reporters in C2C12 cells transfected with RP58-expressing or empty vector. Error bars, SD (n = 3).
(C) Quantitative ChIP assay in C2C12 cells infected with Flag-RP58-expressing adenovirus. Error bars, SEM (n = 3).
(D) (Upper) Immunofluorescence for MyHC expression in WT or RP58 null 10T1/2 fibroblasts in which the myogenic program is activated upon ectopic expression of MyoD on differentiation day 3 (3d). (Lower) Real-time PCR of Ckm, Id2, and Id3 in WT or RP58 null 10T1/2 fibroblasts expressing MyoD on differentiation day 3 (3d). Error bars, SEM (n = 3).
(E) (Upper) Immunofluorescence for MyHC expression in WT or RP58 null 10T1/2 fibroblasts in which the myogenic program is activated upon ectopic expression of MyoD and siRNA-mediated downregulation of Id2 and Id3 on differentiation day 2 (2d). (Lower) Real-time PCR of Ckm (Left) and Id2, Id3 (Right) in WT or RP58 null 10T1/2 fibroblasts in the same conditions described above on differentiation day 2 (2d). Error bars, SEM (n = 3).
(F) Proposed myogenesis regulatory network.
These data support the existence of MyoD-activated positive feedback that allows the progression of skeletal myogenesis, via RP58-mediated transcriptional repression of two key inhibitors of muscle differentiation, Id2 and Id3 (Figure 6F).
DISCUSSION
Our systems approach, in which WISH database construction and annotation were integrated with cell-based, high-throughput transfection screening and microarray analysis, identified RP58 as part of a MyoD-activated positive feedback mechanism that enables progression of skeletal myogenesis by repressing myogenic inhibitors. EMBRYS construction successfully provided annotated gene expression information that led to identification of RP58 as a critical transcription factor in the myogenic program. In addition, application of cell-based high-throughput transfection screening to identify factors that upregulate specific promoters constituted an unbiased functional assay. Overall we have determined a pathway whereby the repressor RP58 negatively regulates Id expression.
Advantages of the WISH Database, EMBRYS
Compared with microarray analysis, the systematic in situ hybridization database presented here provides more detailed information on the spatial regulation of gene expression and allows identification of discrete clusters of transcribed genes. This advantage was demonstrated by previous studies of brain tissues (Gray et al., 2004; Lein et al., 2007). The importance of identifying gene clusters in each tissue’s dynamic development was also emphasized by the recent discovery of reprogramming techniques to generate iPS cells (Takahashi and Yamanaka, 2006) and β-cells (Zhou et al., 2008), in which combined forced expression of transcription factors appearing in each differentiation program can alter cell fate and differentiation status.
Our EMBRYS database combined with WISH images of E9.5, E10.5, and E11.5 mouse embryos, which annotates gene expression patterns, is advantageous in identifying embryonic transcriptional networks compared to existing techniques (Figure 1, Tables S1–S5). Using this approach, we identified 43 genes showing myogenic expression patterns (Table 1 and Figure S2). We also annotated dynamic gene expression patterns in other tissues and organs, which should be useful to analyze other developmental or regenerative networks (Figure 1B and Tables S4 and S5).
Limb development in particular is an excellent model to study patterning and examine molecular networks underlying three dimensional axes because of the existence of well characterized signaling centers such as the apical ectodermal ridge (AER), an ectodermal structure at the most distal end of the limb indispensable for induction of proximodistal limb outgrowth (Saunders, 1948), and the zone of polarizing activity (ZPA), a posterior margin of the limb important for determining anteroposterior patterning (Riddle et al., 1993; Wolpert, 1969). We extensively analyzed gene expression patterns in limb fields relative to these axes (Figure 1D). Thus the EMBRYS database provides us a means to examine molecular networks functioning in both differentiation and polarity programs (Table S4).
Cell-Based High-Throughput Functional Screening Identifies MyoD as an RP58 Activator
Currently, signals activating gene expression are identified by examining potential transcription factor binding sequences in a specific promoter using bioinformatics and cell-based reporter assays. If a factor’s potential recognition motif is unknown, one-hybrid or south-western screening can be used to identify molecules directly associated with the specific sequence; however, these methods are limited to identifying direct targets. Application of a comprehensive set of cDNAs in an expression library allows high-throughput screening not only for direct transcriptional regulators but also for other factors, such as cell-signaling molecules, receptors, or growth factors (Iourgenko et al., 2003).
Here we utilized around 6000 arrayed and addressable cDNA clones, which allowed systematic, efficient, and unbiased screening of cDNAs’ encoding factors that could activate the RP58 promoter (Figure 4A). Our screen revealed MyoD, NEUROG1, NEUROG2, and NEUROD1 as potential activators of the RP58 promoter. Consistent with our findings, recently two independent genome-wide approaches identified RP58 as a downstream target of MyoD (Di Padova et al., 2007) and Neurod1 and Neurog2 (Seo et al., 2007). Thus, we and others have confirmed that RP58 expression in myogenesis and neurogenesis is likely regulated by tissue-specific bHLH transcription factors. Our findings also support the idea that genome-wide functional approaches are useful to identify critical molecular networks functioning in different tissues or developmental stages.
Di Padova et al. have also indicated that acetylation-activated MyoD promotes RP58 expression in the early phase of myogenesis (Di Padova et al., 2007), when we found MyoD to be recruited to the RP58 promoter (Figure 4D). Chromatin association of MyoD and activation of downstream genes is typically promoted by recruitment of p300 and PCAF acetyltransferases (McKinsey et al., 2001; Puri et al., 1997; Sartorelli et al., 1999) and other chromatin-modifying complexes (Guasconi and Puri, 2009). In myoblasts, most of the promoters are not occupied by MyoD, possibly because of the high levels of Ids which preclude MyoD heterodimerization with E12/47, an event required for robust MyoD binding to DNA (Guasconi and Puri, 2009). Taken together, these data suggest that MyoD activates RP58 in DM more strongly than in GM because it uses a mode of activation similar to that of other “differentiation genes,” such as Myogenin.
RP58, a Transcriptional Repressor of Id2 and Id3 in the Myogenic Program
We found that RP58 directly represses the Id2 and Id3 expression. Extensive evidence indicates that temporal control of muscle gene transcription by direct activation of downstream targets (early genes) by MyoD enables subsequent transcription of late genes (Cao et al., 2006; Penn et al., 2004). MyoD directly upregulates numerous targets, including Myog, Ckm, and MyHC, with distinct kinetics (Blais et al., 2005; Cao et al., 2006; Di Padova et al., 2007). For instance, Myog is expressed at an early stage of differentiation, while Ckm and MyHC are considered late muscle genes. Recent work indicates that the ability of MyoD to support transcription of late genes is tightly controlled by downstream early target genes (Blais et al., 2005; Cao et al., 2006). On the other hand, earlier work established that the ability of MyoD to activate late stage genes is antagonized by Id proteins. Overexpression of Id2 and Id3 in muscle cells inhibits myoblast fusion to myotubes (Figure S7) and represses expression of late myogenic targets, such as Ckm and MyHC (Benezra et al., 1990; Jen et al., 1992; Langlands et al., 1997; Melnikova et al., 1999; Neuhold and Wold, 1993). Our finding of an Ids-repressing pathway by MyoD-dependent RP58 signaling may play a critical role for temporally patterned expression of early and late genes.
It has been reported that the Ids reduction during myogenesis is initiated by serum depletion in vitro (Chen et al., 1997; Kurabayashi et al., 1994; Wu and Lim, 2005). We detected reduced levels of Id2 and Id3 in RP58 knockdown C2C12 cells (data not shown), indicating the importance of RP58-mediated down-regulation of Id2 and Id3, as mechanism of maintenance of Ids repression that is initiated by serum depletion. This is consistent with the in vivo data showing that in RP58 null embryos Id2 and Id3 expression is upregulated in muscle regions (Figure 5E). Here we propose that this Ids downregulation is governed by two independent pathways: (1) In proliferating myoblasts (cultured in high serum-containing medium), Id2 and Id3 expression is induced by serum mitogens, possibly via different mechanisms (Chen et al., 1997; Kurabayashi et al., 1994; Wu and Lim, 2005); (2) MyoD-dependent RP58 signaling maintains Id2 and Id3 in a repressed state.
Taken together, identification of RP58 as a critical effector in a myogenic feedback mechanism is intriguing because it suggests that MyoD activates parallel programs, leading to both “activation” and “repression” of distinct subsets of genes and permitting progression of skeletal myogenesis toward late differentiation stages (Blais et al., 2005; Cao et al., 2006; Chen et al., 1997).
EXPERIMENTAL PROCEDURES
EMBRYS Construction
The list of transcription factors and cofactors was created as described in Figure S1. Whole-mount in situ hybridization was performed as described (Yokoyama et al., 2008). DIG-RNA signals were photographed under a light microscope (OLYMPUS SZX12) equipped with a CCD camera (OLYMPUS DP70). Specimens were embedded in agarose gel to capture images from any direction. Generally, three photos were taken for each embryo: the embryo at low magnification, the forelimb and hindlimb at medium magnification, and the forelimb at high magnification. Additional photos were taken if gene expression was clearly detected in specific tissues (i.e., brain, spinal cord, pharyngeal arches, eye, olfactory placode, somite, heart, liver, tail bud, otic pit, external genitalia) at appropriate magnifications. Images were converted to .jpeg format and deposited in the gene expression pattern database “EMBRYS” (http://embrys.jp/).
Constructs
pGL4.12-RP58-3.4K or pGL4.12-RP58-1.6K were constructed by inserting the −3180 to +170 or −1596 to −1 region of mouse RP58 into the pGL4.12 vector (Promega). Mutations were introduced into various sites between −1255 and −1250 (E1), −220 and −215 (E2), and −190 and −185 (E3) of pGL4.12-RP58-1.6K using a QuikChange site direct mutagenesis kit (Stratagene). pGL-TK was constructed by inserting the TK promoter of pRL-TK (Promega) into the BglII-HindIII site of pGL4.12. BS10-Luc, a reporter containing 10 copies of RP58 binding sites fused to the TK promoter and the luciferase gene, was constructed by ligating the KpnI-SacI fragment of BS10-pGL2C (Aoki et al., 1998) into the KpnI-SacI site of pGL-TK. Id2-Luc or Id3-Luc vectors were constructed by inserting the −2576 to −2966 region of Id2 or the −3318 to 3028 region of Id3, respectively, into pGL-TK. Expression vectors were constructed by inserting respective ORFs into pcDNA3.1 (+) (Invitrogen), p3xFlag-CMV-7.1 (SIGMA) or pcDNA3-HA, in which an HA-tag was inserted upstream of the multicloning site. A vector expressing RP58 shRNA was constructed using the BLOCK-iT Inducible H1 RNAi Entry Vector Kit (Invitrogen). Three RP58 target sequences were designed using Invitrogen webpage guidelines. They were: 5′-GCTTCATGCAGCATGTATTTC-3′, 5′-GCCCAGTGA TGAAGATGAAGG-3′, and 5′-GCTAGCAGCTGCCAGTTATCT-3′. Flag-RP58-expressing adenovirus vector was produced by ViraPower Adenoviral Expression System (Invitrogen).
Cell Culture, Transfection, and Adenovirus Infection
C2C12 murine skeletal muscle cells and 293T human embryonic kidney cells were purchased from American Type Culture Collection (ATCC). Cells were maintained in Growth Medium (GM: DMEM supplemented with 10% FBS). For C2C12 culture, cells were grown in GM and, after reaching full confluence, medium was switched to Differentiation Medium (DM: DMEM supplemented with 2% horse serum) and further incubated. All C2C12 cell culture was performed using cells within five passages. Transfection was performed using Lipofectamine 2000 (Invitrogen). Stable transfectants were obtained by selection of cells using G418 or Zeocine for 2 weeks. Adenovirus infection was performed in C2C12 cells at a multiplicity of infection (MOI) of 50–100, and cells were incubated 2 days in DM after reaching confluence and then assayed by real-time PCR or ChIP.
RNA Isolation and Quantitative Real-Time PCR
Total RNAs were isolated from cultured cells or tissue using ISOGEN (Nippon-gene) and reverse transcribed using Ready-To-Go You-Prime First-Strand Beads (GE Healthcare). cDNAs were used for quantitative real-time PCR, which was performed using the SYBR GREEN PCR Master Mix (Applied Biosystems). Gapdh expression served as a control for mRNA expression. Gene expression changes were quantified using the delta-delta CT method. Primer sequences are available upon request.
Histology, Immunostaining, and Western Blotting
Hindlimbs from E18.5 were dissected, embedded in tragacanth gum (Wako), and snap-frozen in liquid nitrogen-cooled isopentane, followed by cryostat sectioning at 6 μm. Whole E13.5 embryos were embedded in OCT compound (Sakura Finetek) and frozen rapidly in liquid nitrogen. Specimens were sectioned at 10 μm. Cryosections were air-dried and stained with H&E. For E10.5 myotome immunohistochemistry, embryos were fixed by 4% paraformaldehyde (PFA) in PBS and embedded in paraffin, followed by microtome sectioning at 7 μm. Anti-MyoD (1:100; clone 5.8A, BD), anti-Myog (1:50; F5D, DSHB), anti-Id2 (1:100; C-20, sc-489, Santa Cruz), anti-Id3 (1:100; C-20, sc-490, Santa Cruz), and anti-cardiac troponin T antibody (1:50; CT3, DSHB) antibodies were used. DAPI served as a counterstain. To immunostain C2C12 cells, anti-fast MyHC antibody (1:50; F59, DSHB) served as first antibody, followed by Alexa 594 (1:400; Molecular Probes) as second antibody. Nuclei were stained with DAPI. Whole cell extracts were prepared for western blotting. Rabbit polyclonal antisera for mouse RP58 (which recognizes the TVRDWTLEDSSQEC epitope) was obtained from Protein Purity, Ltd. (Japan).
Cell-Based HTS
We arrayed 6049 different expression vectors from the MGC (Mammalian Gene Collection) human cDNA expression vector library plus pcDNA3.1 (+) as a negative control on 384-well plates using 50 ng plasmid per well. High-throughput transfection assays were undertaken by incubation with 20 μl OPTI-MEM containing 0.1 μl of Lipofectamine 2000 and 20 ng of the pGL4.12-RP58-3.4k reporter vector for 20 min. Then we added 5 × 10³ of 293T cells in 40 μl GM to each well and cultured for 48 hr. Luciferase activity was measured using the Steady-Glo luciferase assay system (Promega).
Luciferase Assay
Cells in 48-well plates at 50% confluence were transfected using FugeneHD (Roche). A firefly luciferase reporter gene construct (50 ng), an effector gene construct (50 ng), and 5 ng of pGL4.74 Renilla luciferase construct for normalization (Promega) were cotransfected per well. Cell extracts were prepared 36–48 hr after transfection and luciferase activity measured using the Dual-Luciferase Reporter Assay System (Promega).
Microarray Analysis
Sample RNAs were obtained from C2C12 cells stably expressing RP58-shRNA or control-shRNA cells, and from C2C12 cells cultured either in GM or in DM for 0, 2, and 4 days. Five micrograms of RNA was reverse transcribed using SuperScript II and a second strand cDNA was synthesized. Biotinylated antisense cRNAs were amplified and transcribed using the BioArray RNA Amplification and Labeling system (Enzo Life Science, NY, USA). Finally, 10 μg of cRNAs were hydrolyzed and hybridized to the GeneChip (R) Mouse Genome 430 2.0 array (Affymetrix). Microarray data were summarized using the Robust Multichip Average (RMA) method, and statistical analysis was performed using NIA Array Analysis (http://Igusun.grc.nia.nih.gov/ANOVA/; Chapman et al., 2002; Sharov et al., 2005). Upregulated genes were defined as showing a signal intensity elevated more than 1.5-fold compared with control cells. To identify genes downregulated in C2C12 myogenesis, principal component analysis (PCA) was performed and downregulated genes were identified. Microarray data are deposited in the Gene Expression Omnibus (GEO) under accession number GSE12993.
ChIP Assay
C2C12 cells infected with Flag-RP58-expressing adenovirus were cultured in DM for 2 days. Cells were crosslinked with 1% formaldehyde for 10 min and quenched with 0.125 M glycine for 5 min. Cells were washed with cell lysis buffer (5 mM PIPES [pH 8.0]; 85 mM KCl; 0.5% NP-40) and resuspended in nuclear lysis buffer (50 mM Tris-HCl [pH 8.1]; 10 mM EDTA; 1% SDS). Chromatin was sheared to approximately 300–500 bp by sonication and diluted 5 times with ChIP dilution buffer (16.7 mM Tris-HCl [pH 8.1]; 167 mM NaCl; 1.2 mM EDTA; 0.01% SDS; 1.1% Triton X-100). The chromatin solution was incubated with 2 μg anti-Flag-M2 (SIGMA) antibody or normal mouse IgG (Santa Cruz) and Dynabeads Protein G (Invitrogen) at 4°C. Beads were washed with ChIP wash buffer (50 mM HEPES-KOH [pH 7.0]; 0.5 M LiCl; 1 mM EDTA; 0.7% sodium deoxycholate; 1% NP-40) 3 times and once with TE buffer (10 mM Tris-HCl [pH 8.0]; 1 mM EDTA), and immune-complexes were eluted from beads with ChIP elution buffer (50 mM Tris-HCl [pH 8.0]; 10 mM EDTA; 1% SDS) at 65°C. Eluates were additionally incubated at 65°C to reverse crosslinking and then incubated with 0.5 mg/ml proteinase K at 55°C. DNA was purified by phenol-chloroform extraction and ethanol precipitation. In ChIP of MyoD or acetyl-histone 3, ChIP assay was performed with C2C12 cells cultured in GM until fully confluent or with cells incubated in DM for 2 days after reaching full confluence, using a SimpleChIP Enzymatic Chromatin IP Kit (Cell Signaling), according to the manufacturer’s instructions. Protein-DNA complexes were precipitated with 2 μg of anti-MyoD antibody (sc-760; Santa Cruz), anti-acetyl-histone 3 antibody (06–598; Millipore), or normal rabbit IgG (Santa Cruz). Aliquots and whole-cell extracts (serving as input samples) were analyzed by PCR or quantitative real-time PCR amplification with the following primer pairs: (Id2-Forward) 5′-CGCGGGC GAGTCTCAAGGTC-3′, (Id2-Reverse) 5′-CAGGGATCACTCGGGGGGTC-3′; (Id3-Forward) 5′-CACGCATCCCTGTGTGAACG-3′, (Id3-Reverse) 5′-GAGGA ATCCGCTCCTTTGCC-3′; (RP58-E1-Forward) 5′-CTGGTGGCAGGAGTGTA GAG-3′, (RP58-E1-Reverse) 5′-CCGCACACACTAACTCCCTG-3′; (RP58-E2-Forward) 5′-GGCCAGACAGCTGTAATCGC-3′, (RP58-E2-Reverse) 5′-CAGA GGGACGAAGAAGGAAGC-3′.
MyoD-Dependent Myogenic Conversion of 10T1/2 Fibroblasts
10T1/2 fibroblasts were generated from wild-type and RP58 null mouse embryonic fibroblasts (MEFs). Myogenesis assays were performed using these newly established fibroblasts by ectopic expression of adenoviral MyoD. The activation of the myogenic program in these cells was induced by low serum conditions (DM, supplemented with insulin) and was monitored by the formation of myotubes expressing muscle-specific genes, such as Ckm and MyHC. Rescue experiments were performed by downregulating endogenous Id2 and Id3, by transfection of specific siRNA (purchased from QIAGEN). For immunostaining of MyHC, MF20 antibody (DSHB) was used.
Knockout Mice Embryos
C57BL/6J-Pax3Sp/J mice were purchased from Jackson Laboratory (Bar Harbor, ME). Homozygous mice (Pax3Sp/Sp) embryos were identified by appearance of spina bifida and by PCR genotyping. Myog (Myogenin) knockout+/− mice were kindly provided from Y. Nabeshima. Homozygous Myog−/− and WT mice were identified by PCR. All embryos were obtained by timed mating. The morning of the appearance of the vaginal plug was designated E0.5.
Statistical Analysis
The two-tailed independent Student’s t test was used to calculate all P values. Asterisks in figures indicate differences with statistical significance as follows: *p < 0.05, **p < 0.01, and ***p < 0.001.
Supplementary Material
Acknowledgments
We thank H. Naito, T. Suzuki, D. Kozaki, H. Ishitobi, M. Horiuchi, K.Sakuma, J. Hasegawa, and all other Asahara lab members for help with construction of EMBRYS; M. Asada, T. Watanabe, and T. Yoshitaka for construction and assistance with HTS; G. Lindman for assistance with vector construction; Y. Kawakami and J.C. Belmonte for technical advice; Y. Takahashi and K. Yanagisawa for help with bioinformatics information and construction of the webpage; N. Hashimoto for help with setting up microarray instruments; A. Miwa for help with collecting RP58 mutant embryos; Y. Nabeshima for sharing Myog mutant mice; and T. Tanaka, S. Hiraoka, and G. Lindman for critical reading of the manuscript and discussion. Y. Ito and H. Asahara are associate scientists of Tokyo Medical & Dental University. This project was supported by Grants from the Genome Network Project (MEXT) and partially from SORST (JST), Grants from the Ministry of Health, Labour and Welfare, Grants-in Aid for Scientific Research (MEXT), and Grant ID 05-24 from the National Institute of Biomedical Innovation. P.L.P is an associate scientist of Telethon Dulbecco Institute and of Sanford Children’s Health Center and was partially supported by AIRC and NIAMS (RO1AR052779).
Footnotes
Supplemental Data include nine figures and eleven tables and can be found with this article online at http://www.cell.com/developmental-cell/supplemental/S1534-5807(09)00433-X.
References
- Aoki K, Meng G, Suzuki K, Takashi T, Kameoka Y, Nakahara K, Ishida R, Kasai M. RP58 associates with condensed chromatin and mediates a sequence-specific transcriptional repression. J Biol Chem. 1998;273:26698–26704. doi: 10.1074/jbc.273.41.26698. [DOI] [PubMed] [Google Scholar]
- Arnold HH, Braun T. Targeted inactivation of myogenic factor genes reveals their role during mouse myogenesis: a review. Int J Dev Biol. 1996;40:345–353. [PubMed] [Google Scholar]
- Benezra R, Davis RL, Lockshon D, Turner DL, Weintraub H. The protein Id: a negative regulator of helix-loop-helix DNA binding proteins. Cell. 1990;61:49–59. doi: 10.1016/0092-8674(90)90214-y. [DOI] [PubMed] [Google Scholar]
- Blackwell TK, Weintraub H. Differences and similarities in DNA-binding preferences of MyoD and E2A protein complexes revealed by binding site selection. Science. 1990;250:1104–1110. doi: 10.1126/science.2174572. [DOI] [PubMed] [Google Scholar]
- Blackwell TK, Kretzner L, Blackwood EM, Eisenman RN, Weintraub H. Sequence-specific DNA binding by the c-Myc protein. Science. 1990;250:1149–1151. doi: 10.1126/science.2251503. [DOI] [PubMed] [Google Scholar]
- Blais A, Tsikitis M, Acosta-Alvear D, Sharan R, Kluger Y, Dynlacht BD. An initial blueprint for myogenic differentiation. Genes Dev. 2005;19:553–569. doi: 10.1101/gad.1281105. [DOI] [PMC free article] [PubMed] [Google Scholar]
- Blau HM, Chiu CP, Webster C. Cytoplasmic activation of human nuclear genes in stable heterocaryons. Cell. 1983;32:1171–1180. doi: 10.1016/0092-8674(83)90300-8. [DOI] [PubMed] [Google Scholar]
- Bober E, Franz T, Arnold HH, Gruss P, Tremblay P. Pax-3 is required for the development of limb muscles: a possible role for the migration of dermomyotomal muscle progenitor cells. Development. 1994;120:603–612. doi: 10.1242/dev.120.3.603. [DOI] [PubMed] [Google Scholar]
- Braun T, Rudnicki MA, Arnold HH, Jaenisch R. Targeted inactivation of the muscle regulatory gene Myf-5 results in abnormal rib development and perinatal death. Cell. 1992;71:369–382. doi: 10.1016/0092-8674(92)90507-9. [DOI] [PubMed] [Google Scholar]
- Burke AC, Nelson CE, Morgan BA, Tabin C. Hox genes and the evolution of vertebrate axial morphology. Development. 1995;121:333–346. doi: 10.1242/dev.121.2.333. [DOI] [PubMed] [Google Scholar]
- Cao Y, Kumar RM, Penn BH, Berkes CA, Kooperberg C, Boyer LA, Young RA, Tapscott SJ. Global and gene-specific analyses show distinct roles for Myod and Myog at a common set of promoters. EMBO J. 2006;25:502–511. doi: 10.1038/sj.emboj.7600958. [DOI] [PMC free article] [PubMed] [Google Scholar]
- Chapman S, Schenk P, Kazan K, Manners J. Using biplots to interpret gene expression patterns in plants. Bioinformatics. 2002;18:202–204. doi: 10.1093/bioinformatics/18.1.202. [DOI] [PubMed] [Google Scholar]
- Chen B, Han BH, Sun XH, Lim RW. Inhibition of muscle-specific gene expression by Id3: requirement of the C-terminal region of the protein for stable expression and function. Nucleic Acids Res. 1997;25:423–430. doi: 10.1093/nar/25.2.423. [DOI] [PMC free article] [PubMed] [Google Scholar]
- Daston G, Lamar E, Olivier M, Goulding M. Pax-3 is necessary for migration but not differentiation of limb muscle precursors in the mouse. Development. 1996;122:1017–1027. doi: 10.1242/dev.122.3.1017. [DOI] [PubMed] [Google Scholar]
- Di Padova M, Caretti G, Zhao P, Hoffman EP, Sartorelli V. MyoD acetylation influences temporal patterns of skeletal muscle gene expression. J Biol Chem. 2007;282:37650–37659. doi: 10.1074/jbc.M707309200. [DOI] [PubMed] [Google Scholar]
- Frazer KA, Pachter L, Poliakov A, Rubin EM, Dubchak I. VISTA: computational tools for comparative genomics. Nucleic Acids Res. 2004;32:W273–W279. doi: 10.1093/nar/gkh458. [DOI] [PMC free article] [PubMed] [Google Scholar]
- Fuks F, Burgers WA, Godin N, Kasai M, Kouzarides T. Dnmt3a binds deacetylases and is recruited by a sequence-specific repressor to silence transcription. EMBO J. 2001;20:2536–2544. doi: 10.1093/emboj/20.10.2536. [DOI] [PMC free article] [PubMed] [Google Scholar]
- Gray PA, Fu H, Luo P, Zhao Q, Yu J, Ferrari A, Tenzen T, Yuk DI, Tsung EF, Cai Z, et al. Mouse brain organization revealed through direct genome-scale TF expression analysis. Science. 2004;306:2255–2257. doi: 10.1126/science.1104935. [DOI] [PubMed] [Google Scholar]
- Guasconi V, Puri PL. Chromatin: the interface between extrinsic cues and the epigenetic regulation of muscle regeneration. Trends Cell Biol. 2009;19:286–294. doi: 10.1016/j.tcb.2009.03.002. [DOI] [PMC free article] [PubMed] [Google Scholar]
- Hasty P, Bradley A, Morris JH, Edmondson DG, Venuti JM, Olson EN, Klein WH. Muscle deficiency and neonatal death in mice with a targeted mutation in the myogenin gene. Nature. 1993;364:501–506. doi: 10.1038/364501a0. [DOI] [PubMed] [Google Scholar]
- Iourgenko V, Zhang W, Mickanin C, Daly I, Jiang C, Hexham JM, Orth AP, Miraglia L, Meltzer J, Garza D, et al. Identification of a family of cAMP response element-binding protein coactivators by genome-scale functional analysis in mammalian cells. Proc Natl Acad Sci USA. 2003;100:12147–12152. doi: 10.1073/pnas.1932773100. [DOI] [PMC free article] [PubMed] [Google Scholar]
- Jen Y, Weintraub H, Benezra R. Overexpression of Id protein inhibits the muscle differentiation program: in vivo association of Id with E2A proteins. Genes Dev. 1992;6:1466–1479. doi: 10.1101/gad.6.8.1466. [DOI] [PubMed] [Google Scholar]
- Jessell TM. Neuronal specification in the spinal cord: inductive signals and transcriptional codes. Nat Rev Genet. 2000;1:20–29. doi: 10.1038/35049541. [DOI] [PubMed] [Google Scholar]
- Kanamori M, Konno H, Osato N, Kawai J, Hayashizaki Y, Suzuki H. A genome-wide and nonredundant mouse transcription factor database. Biochem Biophys Res Commun. 2004;322:787–793. doi: 10.1016/j.bbrc.2004.07.179. [DOI] [PubMed] [Google Scholar]
- Kassar-Duchossoy L, Gayraud-Morel B, Gomes D, Rocancourt D, Buckingham M, Shinin V, Tajbakhsh S. Mrf4 determines skeletal muscle identity in Myf5:Myod double-mutant mice. Nature. 2004;431:466–471. doi: 10.1038/nature02876. [DOI] [PubMed] [Google Scholar]
- Kawakami Y, Rodriguez-Leon J, Koth CM, Buscher D, Itoh T, Raya A, Ng JK, Esteban CR, Takahashi S, Henrique D, et al. MKP3 mediates the cellular response to FGF8 signalling in the vertebrate limb. Nat Cell Biol. 2003;5:513–519. doi: 10.1038/ncb989. [DOI] [PubMed] [Google Scholar]
- Kent WJ. BLAT–the BLAST-like alignment tool. Genome Res. 2002;12:656–664. doi: 10.1101/gr.229202. [DOI] [PMC free article] [PubMed] [Google Scholar]
- Kurabayashi M, Jeyaseelan R, Kedes L. Doxorubicin represses the function of the myogenic helix-loop-helix transcription factor MyoD. Involvement of Id gene induction. J Biol Chem. 1994;269:6031–6039. [PubMed] [Google Scholar]
- Langlands K, Yin X, Anand G, Prochownik EV. Differential interactions of Id proteins with basic-helix-loop-helix transcription factors. J Biol Chem. 1997;272:19785–19793. doi: 10.1074/jbc.272.32.19785. [DOI] [PubMed] [Google Scholar]
- Lein ES, Hawrylycz MJ, Ao N, Ayres M, Bensinger A, Bernard A, Boe AF, Boguski MS, Brockway KS, Byrnes EJ, et al. Genome-wide atlas of gene expression in the adult mouse brain. Nature. 2007;445:168–176. doi: 10.1038/nature05453. [DOI] [PubMed] [Google Scholar]
- Mariani FV, Martin GR. Deciphering skeletal patterning: clues from the limb. Nature. 2003;423:319–325. doi: 10.1038/nature01655. [DOI] [PubMed] [Google Scholar]
- McKinsey TA, Zhang CL, Olson EN. Control of muscle development by dueling HATs and HDACs. Curr Opin Genet Dev. 2001;11:497–504. doi: 10.1016/s0959-437x(00)00224-0. [DOI] [PubMed] [Google Scholar]
- Melnikova IN, Christy BA. Muscle cell differentiation is inhibited by the helix-loop-helix protein Id3. Cell Growth Differ. 1996;7:1067–1079. [PubMed] [Google Scholar]
- Melnikova IN, Bounpheng M, Schatteman GC, Gilliam D, Christy BA. Differential biological activities of mammalian Id proteins in muscle cells. Exp Cell Res. 1999;247:94–104. doi: 10.1006/excr.1998.4330. [DOI] [PubMed] [Google Scholar]
- Murre C, McCaw PS, Baltimore D. A new DNA binding and dimerization motif in immunoglobulin enhancer binding, daughterless, MyoD, and myc proteins. Cell. 1989;56:777–783. doi: 10.1016/0092-8674(89)90682-x. [DOI] [PubMed] [Google Scholar]
- Nabeshima Y, Hanaoka K, Hayasaka M, Esumi E, Li S, Nonaka I. Myogenin gene disruption results in perinatal lethality because of severe muscle defect. Nature. 1993;364:532–535. doi: 10.1038/364532a0. [DOI] [PubMed] [Google Scholar]
- Neuhold LA, Wold B. HLH forced dimers: tethering MyoD to E47 generates a dominant positive myogenic factor insulated from negative regulation by Id. Cell. 1993;74:1033–1042. doi: 10.1016/0092-8674(93)90725-6. [DOI] [PubMed] [Google Scholar]
- Ohtaka-Maruyama C, Miwa A, Kawano H, Kasai M, Okado H. Spatial and temporal expression of RP58, a novel zinc finger transcriptional repressor, in mouse brain. J Comp Neurol. 2007;502:1098–1108. doi: 10.1002/cne.21350. [DOI] [PubMed] [Google Scholar]
- Okado H, Ohtaka-Maruyama C, Sugitani Y, Fukuda Y, Ishida R, Hirai S, Miwa A, Takahashi A, Aoki K, Mochida K, et al. The transcriptional repressor RP58 is crucial for cell-division patterning and neuronal survival in the developing cortex. Dev Biol. 2009;331:140–151. doi: 10.1016/j.ydbio.2009.04.030. [DOI] [PubMed] [Google Scholar]
- Penn BH, Bergstrom DA, Dilworth FJ, Bengal E, Tapscott SJ. A MyoD-generated feed-forward circuit temporally patterns gene expression during skeletal muscle differentiation. Genes Dev. 2004;18:2348–2353. doi: 10.1101/gad.1234304. [DOI] [PMC free article] [PubMed] [Google Scholar]
- Puri PL, Sartorelli V. Regulation of muscle regulatory factors by DNA-binding, interacting proteins, and post-transcriptional modifications. J Cell Physiol. 2000;185:155–173. doi: 10.1002/1097-4652(200011)185:2<155::AID-JCP1>3.0.CO;2-Z. [DOI] [PubMed] [Google Scholar]
- Puri PL, Sartorelli V, Yang XJ, Hamamori Y, Ogryzko VV, Howard BH, Kedes L, Wang JY, Graessmann A, Nakatani Y, Levrero M. Differential roles of p300 and PCAF acetyltransferases in muscle differentiation. Mol Cell. 1997;1:35–45. doi: 10.1016/s1097-2765(00)80005-2. [DOI] [PubMed] [Google Scholar]
- Riddle RD, Johnson RL, Laufer E, Tabin C. Sonic hedgehog mediates the polarizing activity of the ZPA. Cell. 1993;75:1401–1416. doi: 10.1016/0092-8674(93)90626-2. [DOI] [PubMed] [Google Scholar]
- Rudnicki MA, Braun T, Hinuma S, Jaenisch R. Inactivation of MyoD in mice leads to up-regulation of the myogenic HLH gene Myf-5 and results in apparently normal muscle development. Cell. 1992;71:383–390. doi: 10.1016/0092-8674(92)90508-a. [DOI] [PubMed] [Google Scholar]
- Sartorelli V, Puri PL, Hamamori Y, Ogryzko V, Chung G, Nakatani Y, Wang JY, Kedes L. Acetylation of MyoD directed by PCAF is necessary for the execution of the muscle program. Mol Cell. 1999;4:725–734. doi: 10.1016/s1097-2765(00)80383-4. [DOI] [PubMed] [Google Scholar]
- Saunders JW., Jr The proximo-distal sequence of origin of the parts of the chick wing and the role of the ectoderm. J Exp Zool. 1948;108:363–403. doi: 10.1002/jez.1401080304. [DOI] [PubMed] [Google Scholar]
- Seo S, Lim JW, Yellajoshyula D, Chang LW, Kroll KL. Neurogenin and NeuroD direct transcriptional targets and their regulatory enhancers. EMBO J. 2007;26:5093–5108. doi: 10.1038/sj.emboj.7601923. [DOI] [PMC free article] [PubMed] [Google Scholar]
- Sharov AA, Dudekula DB, Ko MS. A web-based tool for principal component and significance analysis of microarray data. Bioinformatics. 2005;21:2548–2549. doi: 10.1093/bioinformatics/bti343. [DOI] [PubMed] [Google Scholar]
- Takahashi K, Yamanaka S. Induction of pluripotent stem cells from mouse embryonic and adult fibroblast cultures by defined factors. Cell. 2006;126:663–676. doi: 10.1016/j.cell.2006.07.024. [DOI] [PubMed] [Google Scholar]
- Thomas PD, Campbell MJ, Kejariwal A, Mi H, Karlak B, Daverman R, Diemer K, Muruganujan A, Narechania A. PANTHER: a library of protein families and subfamilies indexed by function. Genome Res. 2003;13:2129–2141. doi: 10.1101/gr.772403. [DOI] [PMC free article] [PubMed] [Google Scholar]
- Weintraub H, Tapscott SJ, Davis RL, Thayer MJ, Adam MA, Lassar AB, Miller AD. Activation of muscle-specific genes in pigment, nerve, fat, liver, and fibroblast cell lines by forced expression of MyoD. Proc Natl Acad Sci USA. 1989;86:5434–5438. doi: 10.1073/pnas.86.14.5434. [DOI] [PMC free article] [PubMed] [Google Scholar]
- Williams BA, Ordahl CP. Pax-3 expression in segmental mesoderm marks early stages in myogenic cell specification. Development. 1994;120:785–796. doi: 10.1242/dev.120.4.785. [DOI] [PubMed] [Google Scholar]
- Wolpert L. Positional information and the spatial pattern of cellular differentiation. J Theor Biol. 1969;25:1–47. doi: 10.1016/s0022-5193(69)80016-0. [DOI] [PubMed] [Google Scholar]
- Wu J, Lim RW. Regulation of inhibitor of differentiation gene 3 (Id3) expression by Sp2-motif binding factor in myogenic C2C12 cells: downregulation of DNA binding activity following skeletal muscle differentiation. Biochim Biophys Acta. 2005;1731:13–22. doi: 10.1016/j.bbaexp.2005.08.008. [DOI] [PubMed] [Google Scholar]
- Yaffe D, Saxel O. Serial passaging and differentiation of myogenic cells isolated from dystrophic mouse muscle. Nature. 1977;270:725–727. doi: 10.1038/270725a0. [DOI] [PubMed] [Google Scholar]
- Yokoyama S, Hashimoto M, Shimizu H, Ueno-Kudoh H, Uchibe K, Kimura I, Asahara H. Dynamic gene expression of Lin-28 during embryonic development in mouse and chicken. Gene Expr Patterns. 2008;8:155–160. doi: 10.1016/j.gep.2007.11.001. [DOI] [PMC free article] [PubMed] [Google Scholar]
- Zhang W, Behringer RR, Olson EN. Inactivation of the myogenic bHLH gene MRF4 results in up-regulation of myogenin and rib anomalies. Genes Dev. 1995;9:1388–1399. doi: 10.1101/gad.9.11.1388. [DOI] [PubMed] [Google Scholar]
- Zhou Q, Brown J, Kanarek A, Rajagopal J, Melton DA. In vivo reprogramming of adult pancreatic exocrine cells to β-cells. Nature. 2008;455:627–632. doi: 10.1038/nature07314. [DOI] [PMC free article] [PubMed] [Google Scholar]
Associated Data
This section collects any data citations, data availability statements, or supplementary materials included in this article.