

Abstract
We recently introduced a generic single nucleotide polymorphism (SNP) genotyping method, termed DASH (dynamic allele-specific hybridization), which entails dynamic tracking of probe (oligonucleotide) to target (PCR product) hybridization as reaction temperature is steadily increased. The reliability of DASH and optimal design rules have not been previously reported. We have now evaluated crudely designed DASH assays (sequences unmodified from genomic DNA) for 89 randomly selected and confirmed SNPs. Accurate genotype assignment was achieved for 89% of these worst-case-scenario assays. Failures were determined to be caused by secondary structures in the target molecule, which could be reliably predicted from thermodynamic theory. Improved design rules were thereby established, and these were tested by redesigning six of the failed DASH assays. This involved reengineering PCR primers to eliminate amplified target sequence secondary structures. This sophisticated design strategy led to complete functional recovery of all six assays, implying that SNPs in most if not all sequence contexts can be effectively scored by DASH. Subsequent empirical support for this inference has been evidenced by ∼30 failure-free DASH assay designs implemented across a range of ongoing genotyping programs. Structured follow-on studies employed standardized assay conditions, and revealed that assay reproducibility (733 duplicated genotypes, six different assays) was as high as 100%, with an assay accuracy (1200 genotypes, three different assays) that exceeded 99.9%. No post-PCR assay failures were encountered. These findings, along with intrinsic low cost and high flexibility, validate DASH as an effective procedure for SNP genotyping.
The envisioned benefits of high-throughput single nucleotide polymorphism (SNP) analysis are numerous (Brookes 1999), and several large-scale SNP discovery programs are now underway or have been completed (Taillon-Miller et al. 1998; Wang et al. 1998; Cambien et al. 1999; Cargill et al. 1999; Emahazion et al. 1999; Marshall 1999; Picoult-Newberg et al. 1999). Additionally, a number of SNP databases have been built and are steadily growing in content, that is, HGBASE (Brookes et al. 2000; http://hgbase.cgr.ki.se), dbSNP (Smigielski et al. 2000; http://www.ncbi.nlm.nih.gov/SNP) and the SNP Consortium (TSC) (Marshall 1999; http://snp.cshl.org). In order to fully realize the benefits of such developments, further improvements in SNP genotyping technologies will be required. Critical issues here will include ease of assay design, equipment complexity, assay cost, reliability, accuracy, flexibility, and compatibility with automation. Alternative methods under development in different laboratories possess various advantages and disadvantages, making each suitable for a different range of applications. Arguably, however, standardized and simple assay design in addition to accurate allele determination are perhaps the most important prerequisites for a broadly applicable method. Given these features, further development efforts would enable all other desirable qualities to be attained. With this philosophy in mind, we recently devised dynamic allele-specific hybridization (DASH), an SNP scoring procedure based solidly upon the principles of simplicity of design, high accuracy, and low complexity of reagents and equipment.
DASH is essentially an enhanced form of allele-specific hybridization (Stoneking et al. 1991), transferred from the traditional radioactive/chemiluminescent and membrane-based platform to a convenient microtiter plate format that uses a simple duplex-DNA intercalating dye for signal production and a dynamic low–high temperature sweep (Ririe et al. 1997) to capture all phases of probe–target-DNA melting. From this arrangement, we previously demonstrated that both alleles of all possible SNP types could be readily discriminated using simple and standardized reaction conditions (Howell et al. 1999). Currently available commercial devices designed to support the DASH procedure and score genotypes automatically, in conjunction with microtiter plate-compatible robotics, should enable high-throughput application. Toward this end, we have now completed, and report here, a detailed investigation of the robustness, fidelity, reproducibility, and design requirements of DASH, using 89 recently reported intragenic SNPs (Emahazion et al. 1999).
RESULTS
Initial DASH Assay Trials
The objectives of this study were (1) to assess the robustness of DASH for scoring SNPs in many different sequence contexts, (2) to determine critical assay design parameters, and (3) to evaluate the reproducibility and accuracy of SNP genotyping by DASH.
We first standardized a number of procedural variables that we knew to be important from previously reported findings (Howell et al. 1999) and our general experience with the method. Specifically:
Target regions (100 bases around the SNP) were excluded if BLAST searches of the GenBank NR database indicated they were not single-copy genomic sequences (i.e., contained repeat elements, or were represented by other highly similar gene or pseudogene paralogs).
Intraexonic target regions were excluded if we were aware of the cDNA but not the genomic DNA structure because in such situations one cannot be certain that the target PCR sequence exists in genomic DNA uninterrupted by introns.
PCR primer pair sequences were checked computationally to ensure they could not form inter- or intramolecular duplex regions that involved more than two bases from either 3′ end, and each primer had to be 21–23 nucleotides long.
PCR amplified fragments were always designed to be less than 70 bp in length.
Hot-start PCR protocols were used to prevent the formation of primer dimers (we employed Taq-Gold, which is inactive until an initial heating step is performed).
PCRs were employed in subsequent DASH analysis only if examination of an aliquot of the product by gel electrophoresis revealed a single amplified band of a strength that indicated that no more than ∼100 ng of product had been made (equivalent to 100% incorporation of the biotinylated primer).
DASH probes were made either 15 or 17 nucleotides long and centered upon the SNP position.
Using the above simple and standardized rules, DASH assays were designed for 92 of 167 previously described SNPs in candidate genes for neurodegeneration (Emahazion et al. 1999). These 92 polymorphisms were randomly chosen, providing a wide range of probe and target-sequence contexts. From prior SNP discovery studies we knew that both alleles of all of these polymorphisms were present at appreciable frequencies (minor allele >1%) in the tested (Swedish) population samples. No additional efforts were made at this stage to optimize individual assay designs, as our intention was first to test a worst-case scenario for nonoptimized DASH assay effectiveness based upon reliable SNPs. Three of these assays were excluded based upon PCR failures. No attempts were made to correct these PCR reactions. The distribution of SNP types for the remaining 89 assays was 71 C ↔ T, 9 C ↔ G, 5 G ↔ T, and 4 A ↔ T polymorphisms.
Each of the 89 DASH assays was performed upon five Swedish genomic DNA samples that included between two and five individuals homozygous for the major (most common) SNP allele. In the first instance, DASH was performed without the inclusion of a probe. Any observed fluorescence signals in this analysis would be caused by duplex DNA structures formed solely from secondary structures in the target PCR product bound to the microtiter plate well, and Tm observations would reflect the melting of these structures. Next, DASH was performed upon the same bound DNA using a probe that matched the major allele sequence. Finally, the minor allele probe was used to examine the target DNA. In these latter two situations, the detected duplexes would be those formed between the probes and the target, and the observed Tms would reflect their denaturation. All 89 experiments were undertaken in the above order, ensuring that any losses of bound DNA upon each reprobing would be similar between assays. All assays were run on two or more separate occasions. Signal differences between runs were negligible, and therefore averaged data were used for subsequent analyses.
Interpretation of Probe-Derived DASH Signals
Three different patterns of DASH results were observed when using the probes as described above. Examples of each pattern are shown in Figure 1.
Figure 1.
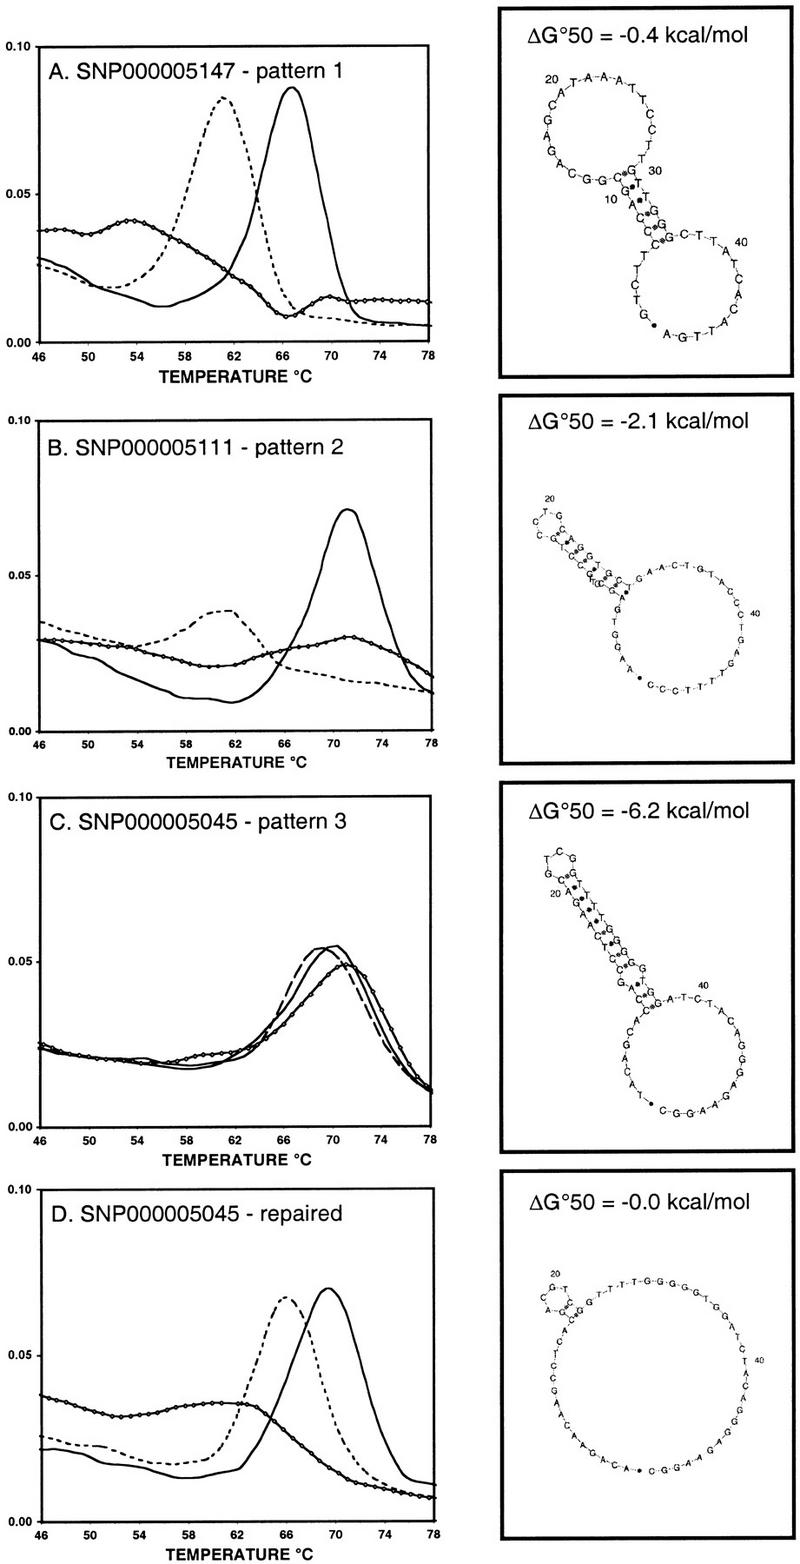
DASH results are shown for a major allele probe (solid line) and a minor allele probe (dashed line) used seperately to examine a major allele homozygous sample. Signals produced in the absence of any probe (representing target-sequence secondary structure) are also shown (diamond-marked line). All plots show the negative first derivative of the fluorescence versus temperature. The most stable target sequence secondary structures (predicted by mfold at 50°C) are shown to the right of each plot. HGBASE (http://hgbase.cgr.ki.se) SNP accession numbers are also given. (A) Pattern 1 (Ideal) assay. (B) Pattern 2 (Successful) assay. (C) Pattern 3 (Failed) assay. (D) An assay for the same SNP as in C, redesigned to minimize amplified target-sequence secondary structure as follows: original primers, 5′-GGCCTTCTCCCTGTAGATCCAC 3′ and biotin-5′-AGATACAGCACCAGCCTCAAGAC-3′; repaired primers, 5′-GGCCTTCTCCCTGTAGATCCAC-3′ and biotin-5′-ACAGAACAAGCCTCACGACGTCGG-3′.
Pattern 1 (Ideal)
As shown in Figure 1A, when used to examine target DNA homozygous for the major allele sequence, both the major allele probe and the minor allele probe yielded very apparent single peaks in a plot of the rate of denaturation versus temperature, which were distinct from target secondary-structure melting curves. Whenever this was seen, the Tm of the major allele probe was found to be 4°–12°C higher than the Tm of the minor allele probe.
Pattern 2 (Successful)
As shown in Figure 1B, when used to examine target DNA homozygous for the major allele sequence, only the major allele probe yielded a readily identifiable single peak in a plot of the rate of denaturation versus temperature. The minor allele probe resulted in a denaturation peak that was <40% of the height of the peak produced by the major allele probe.
Pattern 3 (Failed)
As shown in Figure 1C, neither the major allele probe nor the minor allele probe yielded an obvious single peak in a plot of the rate of denaturation versus temperature, when used upon target DNA homozygous for the major allele. Probe peaks in this case were not distinct from the melting curve profile for the target secondary structure alone.
Pattern 1 signals were seen for 59 of the 89 nonoptimized DASH assays (66%). In 28 of these assays, at least one heterozygote was observed among the five tested samples. Where this was case, the major and the minor allele probes yielded double peaks indicative of two phases of denaturation. In 15 assays, at least one minor allele homozygote was present among the five tested DNAs. In these cases, the observed patterns were complementary (with respect to the relative Tms) but otherwise equivalent to the findings for major allele homozygotes. With these Ideal DASH signals, using either probe in isolation would thus accurately distinguish all genotypes, and using the second probe in addition would confirm the assignments.
Pattern 2 signals were seen for 20 assays (23%). In 7 of these assays, heterozygote target DNAs were present among the five tested individuals. In these cases, only a single high-temperature (matching) denaturation peak was seen with either probe, even though two peaks should ideally have been produced. In six assays, minor allele homozygotes were present in the five tested DNAs. In these cases, only the minor allele probe produced an unambiguous peak. Thus, in pattern 2 assays, probes matched to target DNAs produce clear and distinct peaks, whereas mismatched probe–target duplexes yield signals that are weak or nonexistent. Therefore, these successful DASH assays do facilitate accurate assignment of all three genotypes, but require the serial use of both probes to do so.
Pattern 3 signals were seen for 10 of the 89 nonoptimized DASH assays (11%). Given the checks we performed before each assay, we knew these failures were not owing to failed PCRs. Thus, in this worst-case scenario, only about 1 in 10 crudely designed DASH assays would completely fail and not be effective for SNP genotyping.
Target Molecule Secondary Structure and DASH Robustness
To reveal which assay specific factors might underlie the failure of certain DASH assays, we tested for correlations between patterns 1–3 and an index of the degree of intrinsic target molecule secondary structure. Using data obtained from the initial probe-free DASH experiments (see above), we used the observed Tms from these target-only derived peaks as an empirical measure of secondary-structure stability. For uniformity of comparison, analyses were based only upon data from major-allele homozygous target DNAs, and averaged signal patterns from two or more samples were used. By this empirical index, secondary structures were present, at least weakly, in the target sequences of all 89 DASH assays, and their Tms spanned 43°–75°C. In two cases where two peaks rather than one were present, the highest temperature peak was taken. Our findings, illustrated in Figure 2A, revealed that the Tms of target secondary structures were significantly elevated in pattern 2 and pattern 3 assays compared to pattern 1 assays (p < .0001). This finding indicated that suboptimal DASH assays are, at least in part, caused by intrinsic secondary structures within the target sequence that presumably compete with the formation of stable probe–target duplexes during the hybridization phase of the procedure.
Figure 2.

Observed distributions of the two investigated measures of target-sequence secondary structure are shown, plotted against the three categories of assay functionality (quality patterns 1, 2, and 3) for 89 crudely designed DASH assays. (A) experimentally determined Tm values. (B) theoretically predicted (mfold at 37°C) ΔG values. Each data point represents the respective measure of target secondary-structure stability for one assay. Mean values are denoted by short horizontal lines. It is apparent that the mean values for failed assays (pattern 3) were significantly higher than for functional assays (patterns 1 and 2), indicating that target secondary structure is a primary cause of assay failure.
Assay Design Guidelines
For DASH assay design purposes, it would be preferable to be able to anticipate target DNA secondary-structure problems, rather than having to test for them by experimentation. We therefore examined the degree of relationship between a computational prediction (mfold program) of major-allele target DNA secondary structure and assay robustness. As shown in Figure 2B, just as for experimentally observed Tm values, the predicted secondary structure modeled at 37°C (ΔG) was found to be significantly elevated in both pattern 2 and pattern 3 assays compared to pattern 1 assays (p < .0001)). The stability of the most stable individual helix within the target-sequence secondary structure (ΔΔG) was also significantly elevated in pattern 2 and pattern 3 assays (p < .0001). Similar, although slightly weaker, relationships were obtained with predicted secondary-structure ΔH, ΔS, or Tm values. Predicted secondary structures at 50°C had different thermodynamic values, but the observed relationships with assay quality were the same, and the p-values were equivalent. These data show that target-sequence secondary structures that tend to prevent a DASH assay from functioning can be relatively well predicted by considering the theoretical ΔG values of target-sequence secondary structures.
Other target-sequence-dependent parameters (using both allele sequences) that we found to be significantly correlated (p < .05) with DASH assay quality included (1) the total number of duplexed bases, (2) the total number of duplexed segments, (3) the length of the longest contiguous stretch of duplexed bases, (4) the total number of bases in duplexed stretches overlapping the probe binding region, and (5) having a duplexed stretch spanning the SNP position. Obviously, all these parameters are coindices of secondary-structure stability. PCR product length, however, which varied from 47 to 69 bp in these experiments, did not show a significant correlation with assay quality. There was no significant relationship found between assay success and SNP type (C ↔ T, G ↔ T, C ↔ G, or A ↔ T).
As indicated by Figures 2A and 2B, the target molecule secondary-structure ΔG accounts for most but not all of the variance in observed assay quality. Some of the residual differences could be caused by mere experimental variation, or to other assay-specific parameters such as particularly stable probe–target duplexes that might outcompete target molecule secondary structures. The probe and the target sequences are related, and, therefore, to look for a probe-specific correlation with assay quality, we examined the ratio between probe and target percentage G + C contents. Our reasoning was that such an index would characterize relatively stable and unstable probes while at the same time controlling for innate target-sequence secondary-structure stability. G + C content ranged from 26.7% to 86.7% for probes and from 29.8% to 71.0% for target molecules. The range of ratios for probe/target G + C content was 0.674–1.555. Using logistic regression analysis, this ratio parameter did indeed show a significant association with pattern 1 assays versus other quality assays (p < .001), and this result was independent of the correlation with target molecule secondary structure.
Validation of Assay Design Parameters
To validate our conclusions about the role of target DNA secondary structure in limiting the robustness of DASH assays, we attempted to redesign, and thereby repair, a random set of six of the 10 assays that had initially failed. Our strategy was to reduce or eliminate the potential for secondary structure formation in the single-stranded PCR product (i.e., the biotinylated strand) by changing its DNA sequence. This was achieved by altering the sequences of one or both of the PCR primers. Primer modifications involved redesigning the PCR to employ primers that would anneal a few bases to either side of the original positions and/or altering up to a total of three nucleotides in the two PCR primers (always C or G to A or T, and never within three bases of the 3′ end). This strategy was feasible as a means to reduce PCR product secondary structure both because the amplicons are sufficiently short that the primer sequences represent a vast fraction of the PCR product length and because primer modifications become incorporated into the PCR product during amplification.
The thresholds we employed for these redesign efforts required target-molecule-predicted secondary-structure ΔG37 values to be less negative than −4.0 kcal/mole and the probe to target percentage C + G ratio to exceed 1.0. In each of the six cases, we found it was trivial to modify the primer sequences in such a way that these requirements were met, and in every case this led to Ideal (pattern 1) functional assays. One such repaired assay design, in which considerable sequence modification was required (thus representing an extreme example), is shown in Figure 1D, along with resultant fluorescence curves produced by DASH execution. Details of the other five redesigned assays are shown in Figure 3. Subsequently, the optimized design parameters have been employed to create more than 30 additional DASH assays for distinct SNPs related to a range of genotyping studies. When applied in the laboratory, these designs all functioned well as either pattern 1 (Ideal) or pattern 2 (Successful) assays, with no examples of pattern 3 (Failed) assays among them (data not shown). These designs will be released presently via the HGBASE database (Brookes et al. 2000; http://hgbase.cgr.ki.se), which is now being structurally enhanced to allow the presentation of various genotyping assay details.
Figure 3.
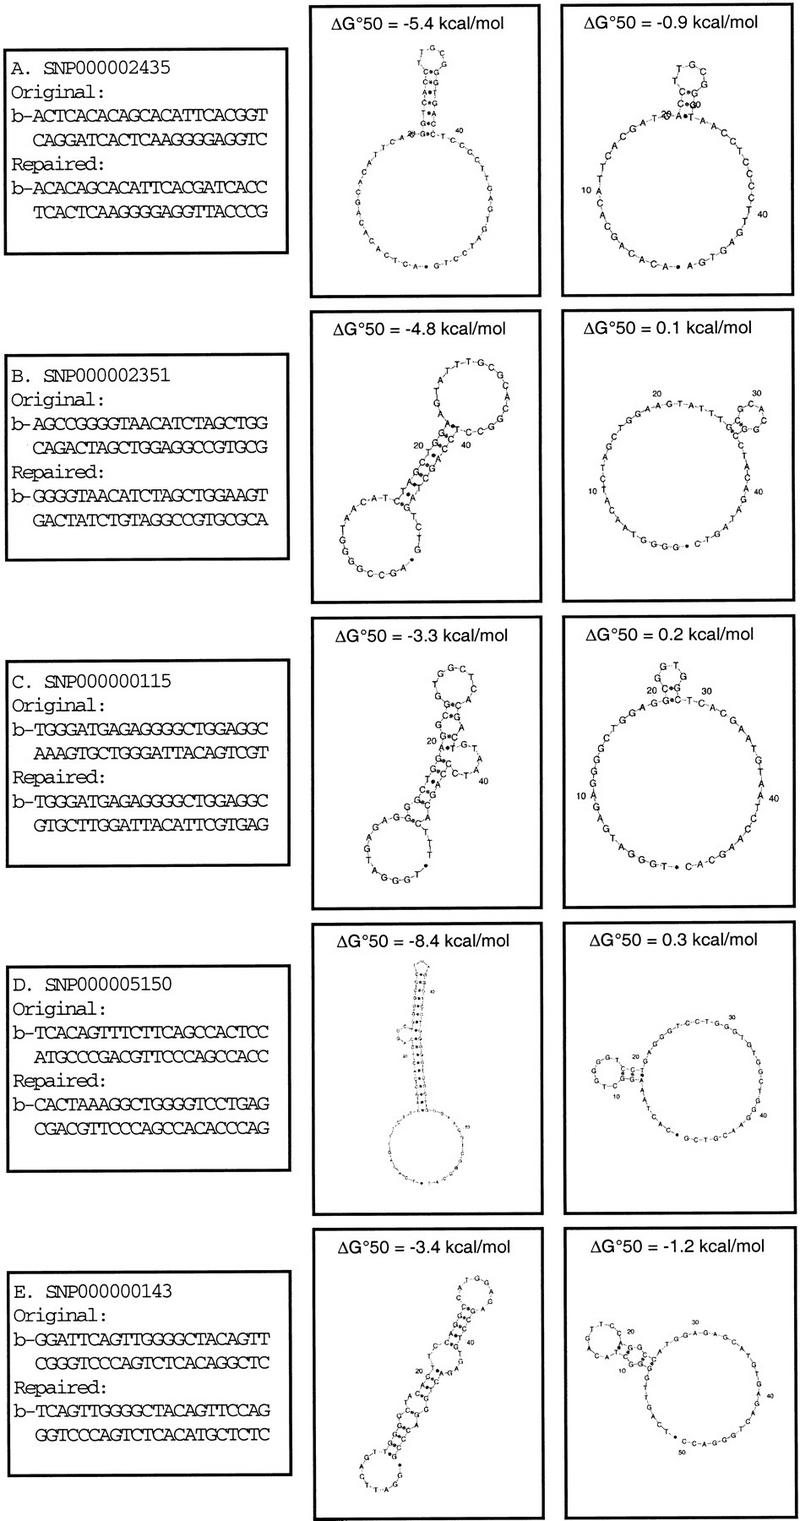
Redesign details are shown for five DASH assays. In each case, primer sequences (5′—3′) are indicated for the original nonfunctional assay and for the repaired functional assay, along with the respective theoretically predicted (mfold) secondary structures of the resulting PCR product. The leftmost secondary structure represents the original design, and the rightmost structure represents the situation after primer sequence modification. Sequences in which a 5′-biotin moiety has been added are marked with the letter b. SNP accession numbers according to HGBASE (http://hgbase.cgr.ki.se) are shown for each assay.
Reproducibility and Accuracy of DASH
In addition to simplicity of design, the utility of DASH will depend on accuracy and reproducibility of genotype assignments. Our impression from working with DASH is that it performs very well in both these regards. However, we wished to evaluate this formally.
To test for reproducibility, we chose six random assays (three pattern 1 assays and three pattern 2 assays; see Methods for details), and used these to genotype 88–273 genomic samples. Equal quantities of amplified PCR products (to avoid potential variation arising from separate PCRs) were bound to separate microtiter plates, and DASH assays were performed by different persons at different times. Each series of genotypes was scored blindly. All assayed samples gave readily interpretable data, and no assignments differed between experiments. This represents a failure rate of zero, and a reproducibility of 100% over a total of 733 genotypes. The degree of reproducibility is shown for the three pattern 1 and three pattern 2 assays in Figure 4. Similar reproducibility was evident in the analysis of the 79 pattern 1 and pattern 2 assays described above.
Figure 4.

Example genotyping results are shown for six different SNPs scored by DASH, demonstrating assay reproducibility. A, B, and C are quality 1 assays. D, E, and F are quality 2 assays. In each case, results are plotted for three individuals (one homozygote for each allele, and a heterozygote) genotyped on two separate occasions. High-temperature single peaks represent homozygous samples matched to the utilized probe. Low-temperature single peaks represent homozygous samples mismatched to the utilized probe. Curves with both high- and low-temperature peaks represent heterozygous samples. All plots show the negative first derivative of fluorescence versus temperature. The gene symbols as well as SNP accession numbers for each assay from HGBASE (http://hgbase.cgr.ki.se) are shown.
To address the question of accuracy we first compared DASH to RFLP-PCR (Li and Hood 1995). To do this, 273 DNAs were genotyped by both methods at the two SNP loci that underlie the common alleles of the APOE gene, as well as at one SNP in the PSEN2 gene. These three assays were selected to provide both pattern 1 (APOE-ɛ2 defining SNP and PSEN2) and pattern 2 (APOE-ɛ4 defining SNP) data. Among the 546 genotypes acquired in duplicate for the two pattern 1 assays, no assays failed, and a total of four discrepant samples were identified (all identified in the PSEN2 assay). Upon repeating both assays on the contradictory DNAs, it was shown that all the errors could be attributed to limitations in the RFLP-PCR analysis (either weak bands in gels or partial digests). Among 273 duplicate genotypes produced for the pattern 2 assay, four discrepant samples were noted. After redoing these assays, two of the errors were attributed to artifacts in DASH. For one of these, a weak denaturation peak had caused a heterozygote to be missed, and for the other, an additional weak peak had given the false impression of a heterozygote. Such aberrant peaks are markedly different from the vast majority of other peaks, which show great consistency. Hence, they may be caused by issues of sample contamination rather than deficiencies of individual DASH reactions. An example of one such aberrant peak is shown in Figure 5, and illustrations of the more typical performance of DASH are shown in Figure 6 in order to exemplify its uniformity.
Figure 5.

An example of incorrect genotype assignment by DASH. The curve representing the incorrectly assigned genotype is shown both in and by the arrow. A weak aberrant high-temperature peak gave the impression of a heterozygote, when, in fact, the sample was a homozygote, which should have produced a single low-temperature peak. Three confirmed genotypes (both homozygotes, and one heterozygote) are included for comparison.
Figure 6.


A demonstration of the uniformity of DASH genotyping curves. The two sets of results show distinct assays used upon complete microtiter plates carrying PCR products from 96 unrelated genomic DNA samples. Panel A is a pattern 1 assay, and panel B is a pattern 2 assay. Gene symbols and SNP accession numbers from HGBASE (http://hgbase.cgr.ki.se) are included.
To test DASH against a procedure other than RFLP-PCR, 381 samples were genotyped for the APOE-ɛ4 distinguishing SNP locus, both by DASH and by minisequencing (Syvanen 1994). Among these genotypes no assays failed, and 13 discrepancies were found. These 13 samples were reassayed by both methods, and 11 were found to be owing to minisequencing errors. The remaining two again gave conflicting genotypes identical to the initial findings by DASH (APOE-ɛ3/APOE-ɛ4) and minisequencing (APOE-ɛ4/APOE-ɛ4). Therefore, the correct genotype for these samples could not be determined. These results could indicate that the input DNAs were contaminated with a low level of genomic DNA carrying the APOE-ɛ3 allele that only DASH was able to detect, and these two results were therefore excluded from our accuracy assessment. Assuming a pessimistic design rate of one pattern 2 for every three pattern 1 DASH assays, then our findings would indicate that in routine use DASH would have an accuracy of at least 99.9%.
DISCUSSION
In this study, we have validated DASH as a robust and accurate method for genotyping SNPs, and defined straightforward rules for reliable assay design that make the procedure essentially 100% effective across all SNPs that can be practically PCR amplified. The current availability of commercial devices for DASH genotyping (Hybaid Ltd, UK) equipped with automated genotype calling software further adds to the utility of the method. DASH is also (1) conducted under standardized conditions, (2) inexpensive to perform (∼20 cents per genotype) in that itrequires no fluorescently labeled oligonucleotides or enzymes, (3) implemented in a 96-well microtiter plate format using only a few nanograms of genomic DNA, and (4) not hindered by any detectable failure rate once the PCR is completed. Hence, the technique should be suitable for high-throughput industrial application as well as sufficiently flexible and convenient for small-scale research projects.
To set up our study, we initially limited aspects of both the PCR design and the DASH procedure based upon prior knowledge of the methods capability (Howell et al. 1999). We employed SNPs that were validated in the tested population samples (with frequencies of at least 1%) and which avoided pseudogenes and sequences containing repeat elements. In our initial set of 92 polymorphisms, only three PCRs failed, suggesting that extensive efforts to correct PCR reactions will not be necessary in the generalized application of DASH. This trivial failure rate (3.2%) probably reflects how easy it is to amplify short PCR products. We also employed a PCR protocol that required only a small quantity of DNA (2–5 ng of genomic DNA), which should be an advantage for researchers with limited clinical materials.
Using 89 SNPs as a test set, we found that DASH was sufficiently robust to allow unambiguous genotyping in approximately 90% of crudely designed assays. To account for the 10% of unsuccessful assays, we searched for target- and probe-specific features that might be responsible for these failures. The most important aspect was found to be stable secondary structures within the target DNA molecule. We also found that measures of probe G + C content compared to target G + C content can be used as an additional and independent aid in determining whether an assay is likely to succeed. At this point, we have not attempted to take into consideration potential nucleation sites (Craig et al. 1971) or any influence that impeded zippering (Kallenbach 1968) may have on probe–target duplex formation. This also excludes any possible influence that DNA triplex structures may have had on hybridization (Roberts and Crothers 1992). We have shown that the important target secondary structure and C + G content can be easily calculated from basic theory or available software, and then reliably used to guide sequence engineering of PCR primers in order to best ensure the success of newly designed DASH assays (in advance of placing oligonucleotide orders or beginning any experiments). Design rules were substantiated by repairing six assays that had originally failed when designed without regard to secondary structure or C + G content. Furthermore, subsequent extensive use of DASH across many SNPs and several genotyping projects has confirmed the reliability of the new design guidelines. Given this, and the fact that DASH is performed under one standardized set of conditions, then trial-and-error-based efforts to establish a functioning DASH assay should no longer be necessary. To this end, in partnership with Hybaid Ltd. (UK), we are now developing software that will fully automate the DASH assay design procedure.
We specifically tested the accuracy and reproducibility of DASH. Over many hundreds of genotypes and several different assays we had no assay failures and found DASH to be both 100% reproducible and at least 99.9% accurate. Errors were restricted to pattern 2 (Successful) assays, whereas pattern 1 (Ideal) assays, which were in the majority even for crudely designed assays, gave an accuracy of 100%. We attribute this precision to the fact that DASH is both quantitative and qualitative by nature, that is, quantitative peaks are observed that indicate the presence of an amplified allele, and different alleles produce Tm peaks that are qualitatively different. Furthermore, by serially employing probes for each of the different alleles, confirmatory genotype assignments can be made for each sample, thereby maximizing the reliability of the procedure.
From the results of this study, we recommend the following guidelines for designing DASH assays:
The general rules for PCR and DASH assay design presented in the Results section should be employed.
Target secondary-structure ΔG37 should be calculated using both allelic variants (e.g., using the mfold program), and a maximally negative threshold of −4.0 kcal/mole should be accepted.
Probe/target ratios of C + G percentages should be >1.0.
If target secondary-structure ΔG37 is too negative, or a very low C + G ratio is present, then PCR primers should be redesigned. This may be accomplished by altering the primer sequences (limiting changes to no more than three nucleotides in the two PCR primers, always C or G to A or T, and never involving the three bases at the 3′ ends of the primers) and/or selecting primers that anneal to positions a few bases to either side of their original locations.
In conclusion, we believe our study has validated DASH as an effective approach to SNP genotyping. The basic DASH concept is elegantly simple, and its now proven fidelity and high reliability make it suitable for scale-up and automation. DASH is capable of scoring all types of SNPs, and the technique should, in theory, also be able to score insertion/deletion polymorphisms and other forms of sequence variation. Reduction in reaction volumes, perhaps to a microfabricated format, could play an important role in enabling the future large-scale exploitation of SNPs for genome analysis.
METHODS
PCR
PCR primers were designed using Oligo version 5.0 software (Molecular Biology Insights) to amplify target genomic DNA fragments of 47–69 bp. Details of the PCR primer sequences, product sizes, and optimal annealing temperatures, as well as the sequences of the probes we employed, are available from the authors upon request. All oligonucleotides (primers and probes) were ordered from Interactiva GmbH and were supplied after HPLC purification.
PCR was performed in 96-well microtiter plates (Corning Costar) on a TouchDown temperature cycling apparatus (Hybaid). Reactions (25 μL total volume) consisted of 2–5 ng genomic DNA (prepared from blood samples from five unrelated Swedish individuals), 20 pmole of a regular oligonucleotide primer and 4 pmole of a 5′-biotinylated primer, 0.75 U AmpliTaq Gold (PE Biosystems), 10% dimethylsulphoxide, 1× Perkin-Elmer PCR buffer (including 1.5 mM MgCl2), 0.2 mM dGTP, 0.2 mM dATP, 0.2 mM dTTP, and 0.2 mM dCTP. Thermal cycling employed the following conditions: 1× (10 min at 94°C), and 40× [15 sec at 94°C, 30 sec at annealing temperature (51°, 55°, or 58°C)]. Before being used for DASH, 5 μL of the completed PCR reaction was examined upon a 2.0% low-melt agarose gel to confirm successful amplification. In large-scale experiments, only a few random representative samples were tested in this way.
Dynamic Allele-Specific Hybridization (DASH)
DASH assays were conducted in a similar way to that described previously (Howell et al. 1999), with details as follows. Two probes were designed for each SNP, representing both allelic sequences complementary to the biotinylated strand of the PCR product. Biotinylated PCR products (20–25 μL) were diluted to 50 μL with HEN buffer (0.1 M Hepes, 10 mM EDTA, 50 mM NaCl at pH 8.0). Of this, 25 μL was added to one well of a 96-well streptavidin-coated microtiter plate (Omni-plate, Hybaid), and surface binding was allowed to proceed for a minimum of 1 hr at room temperature. The solution was then removed and 50 μL of 0.1 M NaOH was added at room temperature to cause bound PCR products to denature for 5 min. The NaOH solution was discarded, thus removing the unbiotinylated PCR product strand, and the well was rinsed with a further aliquot of 50 μL of 0.1 M NaOH. A 50-μL solution containing HEN, Sybr Green I dye at a 1 : 10,000 dilution (Molecular Probes), and 30 pmole of one of the two allele-specific oligonucleotide probes was added. The microtiter plate was sealed and rapidly heated to 85°C, and then cooled to 25°C over 3–4 min. This allowed the probe to hybridize to the bound PCR product strand, regardless of which alleles were present. The solution was replaced with HEN containing Sybr Green I dye at a 1 : 10,000 dilution. The plate was placed in a Perkin Elmer 7700 sequence detector (Taqman), and dye fluorescence (proportional to the amount of duplex DNA present) was monitored while heating from 35°C to 85°C at a rate of 0.14°C/sec. Alternatively, plates were placed in a DASH instrument (Hybaid) and heated from 35°C to 85°C at a rate of 0.3°C/sec. Probe–duplex denaturation was determined by following the fluorescence decrease as temperature was increased. The assay procedure, beginning with the NaOH wash step, was repeated on the bound samples by using alternative allele-specific probes. Genotypes were scored from fluorescence curves as previously described (Howell et al. 1999). In this way, observed peaks in the negative first derivative plot of change in fluorescence with respect to temperature were taken to indicate the observed melting temperature (Tm).
Quality Scoring of DASH Assays
For each tested SNP, DASH quality scores were derived from assays performed upon genomic DNA samples homozygous for the major (most abundant) allele. Assays were characterized as pattern 1 (Ideal), pattern 2 (Successful), or pattern 3 (Failed); the specific criteria we used for assignments are detailed in the Results section. For each target DNA, assays were conducted in the absence of any probe (to detect intrinsic secondary structures in the target), using a probe matched to the major allele, and using a probe mismatched to the major allele (i.e., matching the minor allele). In each instance, observed peaks indicated the melting temperature (Tm) of duplex DNA (probe secondary structure or probe–target duplex). The height of each peak above the fully denatured baseline was taken as the signal strength, and the temperature at which the peak occurred was taken as the observed melting temperature (Tm). All quality scores represent averaged data from DASH assays run on at least two separate occasions on PCR products amplified from genomic DNA from two to five unrelated Swedish individuals. Thus, at least two individuals who were homozygous for the major allele were tested for every SNP.
Computational Prediction of Probe and Target Thermodynamic Properties
Single-stranded DNA secondary-structure predictions and associated measures were estimated using nearest-neighbor thermodynamic calculations with aid of the mfold DNA folding program (SantaLucia 1998; http://mfold2.wustl.edu/∼mfold/dna/form1.cgi). This was done for the biotinylated strand of target PCR products (for both allele sequences) and for each DASH probe as linear sequences in isolation. Predictions were performed under two sets of conditions. In the first instance, data were obtained at 50°C, 20% suboptimality, 1.0 M Na+, 0.0 M Mg2+, with all other variables set to default. In the second instance, we used 37°C, 5% suboptimality, 1.0 M Na+, 0.0M Mg2+. Values for secondary-structure Gibbs free energy (ΔG), enthalpy (ΔH), entropy (ΔS), and melting temperatures were calculated, with the values for the most stable structures used in our analyses. In addition, secondary-structure ΔΔG was calculated, indicating the ΔG of the most stable double helical region within each folded single-stranded DNA.
DASH Assays for Accuracy and Reproducibility Testing
Six different SNPs (one in each of six genes) were employed to evaluate the reproducibility of DASH. The target genes, SNP accession numbers at the HGBASE database (Brookes et al. 2000; http://hgbase.cgr.ki.se), as well as PCR primer and DASH probe sequences for these were as follows: (1) CASP3, SNP000005036, using primers 5′-TCCAGTCGGAGGCCA GATCTGAG-3′ and biotin-5′-CTGAAGCCTGCCTCCCGG GATGA-3′ and probes 5′-ATCTGAGCACTCATCCC-3′ and 5′-ATCTGAGCCCTCATCCC-3′; (2) TANK, SNP000005058, using primers 5′-AAACATGGCTTTAATTTTTAC-3′ and biotin-5′-TTTCATCATGTAGCTATACAC-3′ and probes 5′-TTTTT ACTGTGTGTATA-3′ 5′-TTTTTACTATGTGTATA-3′; (3) TNFRSF6, SNP000005172, using primers 5′-TCATATGGT TAACTGTCCATTCC-3′ and biotin-5′-GCAACATGAGAG GCTCACAGAC-3′ and probes 5′-ATTCCAGAAACGTCT-3′ and 5′-ATTCCAGGAACGTCT-3′; (4) MCL1, SNP000005049, using primers 5′-CCAGAAGGTTGCGATGAAGAAAA-3′ and biotin-5′-CTTCTTGCCGCATTCCCACACTG-3′ and probes 5′-AAGAAAAGCGGGCCAGT-3′ and 5′-AAGAAAAGTGGGC CAGT-3′; (5) EBH4, SNP000001325, using primers 5′-GTGAA AATGTTCAGGACCTAGA-3′ and biotin-5′-ACAGTGTCTT GCTATCTTCGTC-3′ and probes 5′-CCTAGATACTGAC GAAG-3′ and 5′-CCTAGATAGTGACGAAG-3′; and (6) APOE-ɛ4 defining SNP, SNP000002328, using primers 5′-GGCTGGGCACGGACATGGAGGAC-3′ and biotin-5′-ACC TAGCCACGGTACTGCACCA-3′ and probes 5′-AGGACGT GTGCGGCCGC-3′ and 5′-AGGACGTGCGCGGCCGC-3′. The first three of these were pattern 1 quality assays, and the last three were pattern 2 quality assays.
To assess accuracy, target polymorphisms comprising the two SNP loci that underlie the common APOE alleles (ɛ2, ɛ3, and ɛ4; Zannis et al. 1982), as well as one presinilin-2 (PSEN2) SNP (HGBASE ID SNP000005167), were scored with both DASH and PCR-RFLP in 273 Scottish DNA samples. In addition, we genotyped the SNP that distinguishes the APOE-ɛ4 allele from the APOE-ɛ2 and APOE-ɛ3 alleles with both DASH and minisequencing in 381 Swedish DNA samples. Detailed protocols for the minisequencing analyses have been reported elsewhere (Blennow et al. 2000). For the DASH analyses, the target genes, SNP accession numbers at HGBASE, PCR primer, and DASH probe sequences were as follows: (1) APOE-ɛ4 assay details were as described above; (2) APOE-ɛ2, SNP000002314, using primers 5′-GTGATGCCGATGACTTGCAGAA-3′ and biotin-5′-CCCGGACTGATACACTGCCAG-3′ and probes 5′-TGCAGAAGCGCCTGGCA-3′ and 5′-TGCAGAAGTGCCTG GCA-5′; and (3) PSEN2, SNP000005167, using primers 5′-TCC AGTGGGGCCATGCTTCAGG-3′ and biotin-5′-GTTGAGG AGTCGAGCACGTAGAG-3′ and probes 5′-CTTCAGGC AATTCTCCT-3′ and 5′-CTTCAGGCGATTCTCCT-3′.
Statistical Analysis
All statistical analyses were performed using StatView version 5.0 (Abacus Concepts). Student's t-test was used to evaluate the significance of differences between target-sequence secondary-structure parameters (observed Tm values, predicted thermodynamic measures, and quantitative sequence features) in relation to DASH assay quality scores (patterns 1, 2, or 3). Logistic regression was used to test whether ratios of probe to target C + G percentages were independently associated with the DASH assay quality scores.
Acknowledgments
We are grateful to Hybaid Ltd. (UK) for donating DASH instruments and labware, and for their help with the development of the DASH concept. Generous financial support has been provided by the Swedish Research Council for Engineering Sciences (TFR), the Swedish Brain Fund, the AMF Jubileum Fund, Tore Nilsons Foundation, and Carl Tryggers Foundation for Scientific Research.
The publication costs of this article were defrayed in part by payment of page charges. This article must therefore be hereby marked “advertisement” in accordance with 18 USC section 1734 solely to indicate this fact.
Footnotes
E-MAIL Anthony.Brookes@cgr.ki.se; FAX 46 (0)8 331547.
Article and publication are at www.genome.org/cgi/doi/10.1101/gr.150201.
REFERENCES
- Blennow K, Ricksten A, Prince JA, Brookes AJ, Emahazion T, Wasslavik C, Bogdanovic N, Andreasen N, Båtsman S, Marcusson J, et al. No association between the α2-macroglobulin (A2M) deletion and Alzheimer's disease, and no change in A2M mRNA, protein, or protein expression. J Neural Trans. 2000;107:1065–1079. doi: 10.1007/s007020070052. [DOI] [PubMed] [Google Scholar]
- Brookes AJ. The Essence of SNPs. Gene. 1999;234:177–186. doi: 10.1016/s0378-1119(99)00219-x. [DOI] [PubMed] [Google Scholar]
- Brookes AJ, Lehvaslaiho H, Siegfried M, Boehm JG, Yuan YP, Sarkar CM, Bork P, Ortigao F. HGBASE: A database of SNPs and other variations in and around human genes. Nucleic Acids Res. 2000;28:356–360. doi: 10.1093/nar/28.1.356. [DOI] [PMC free article] [PubMed] [Google Scholar]
- Cambien F, Poirier O, Nicaud V, Herrmann SM, Mallet C, Ricard S, Behague I, Hallet V, Blanc H, Loukaci V, et al. Sequence diversity in 36 candidate genes for cardiovascular disorders. Am J Hum Genet. 1999;65:183–191. doi: 10.1086/302448. [DOI] [PMC free article] [PubMed] [Google Scholar]
- Cargill M, Altshuler D, Ireland J, Sklar P, Ardlie K, Patil N, Shaw N, Lane CR, Lim EP, Kalyanaraman N, et al. Characterization of single-nucleotide polymorphisms in coding regions of human genes. Nat Genet. 1999;22:231–238. doi: 10.1038/10290. [DOI] [PubMed] [Google Scholar]
- Craig ME, Crothers DM, Doty P. Relaxation kinetics of dimer formation by self complementary oligonucleotides. J Mol Biol. 1971;62:383–401. doi: 10.1016/0022-2836(71)90434-7. [DOI] [PubMed] [Google Scholar]
- Emahazion T, Jobs M, Howell WM, Siegfried M, Wyoni PI, Prince JA, Brookes AJ. Identification of 167 polymorphisms in 88 genes from candidate neurodegeneration pathways. Gene. 1999;238:315–324. doi: 10.1016/s0378-1119(99)00330-3. [DOI] [PubMed] [Google Scholar]
- Howell WM, Jobs M, Gyllensten U, Brookes AJ. Dynamic allele-specific hybridization. A new method for scoring single nucleotide polymorphisms. Nat Biotechnol. 1999;17:87–88. doi: 10.1038/5270. [DOI] [PubMed] [Google Scholar]
- Kallenbach NR. Theory of thermal transitions in low molecular weight RNA chains. J Mol Biol. 1968;37:445–466. doi: 10.1016/0022-2836(68)90114-9. [DOI] [PubMed] [Google Scholar]
- Li H, Hood L. Multiplex genotype determination at a DNA sequence polymorphism cluster in the human immunoglobulin heavy-chain region. Genomics. 1995;26:199–206. doi: 10.1016/0888-7543(95)80201-v. [DOI] [PubMed] [Google Scholar]
- Marshall E. Drug firms to create public database of genetic mutations. Science. 1999;284:406–407. doi: 10.1126/science.284.5413.406. [DOI] [PubMed] [Google Scholar]
- Picoult-Newberg L, Ideker TE, Pohl MG, Taylor SL, Donaldson MA, Nickerson DA, Boyce-Jacino M. Mining SNPs from EST databases. Genome Res. 1999;9:167–174. [PMC free article] [PubMed] [Google Scholar]
- Ririe KM, Rasmussen RP, Wittwer CT. Product differentiation by analysis of DNA melting curves during the polymerase chain reaction. Anal Biochem. 1997;245:154–160. doi: 10.1006/abio.1996.9916. [DOI] [PubMed] [Google Scholar]
- Roberts RW, Crothers DM. Stability and properties of double and triple helices: Dramatic effects of RNA or DNA backbone composition. Science. 1992;258:1463–1466. doi: 10.1126/science.1279808. [DOI] [PubMed] [Google Scholar]
- SantaLucia J., Jr A unified view of polymer, dumbbell, and oligonucleotide DNA nearest-neighbor thermodynamics. Proc Natl Acad Sci USA. 1998;95:1460–1465. doi: 10.1073/pnas.95.4.1460. [DOI] [PMC free article] [PubMed] [Google Scholar]
- Smigielski EM, Sirotkin K, Ward M, Sherry ST. dbSNP: A database of single nucleotide polymorphisms. Nucleic Acids Res. 2000;28:352–355. doi: 10.1093/nar/28.1.352. [DOI] [PMC free article] [PubMed] [Google Scholar]
- Stoneking M, Hedgecock D, Higuchi RG, Vigilant L, Erlich HA. Population variation of human mtDNA control region sequences detected by enzymatic amplification and sequence-specific oligonucleotide probes. Am J Hum Genet. 1991;48:370–382. [PMC free article] [PubMed] [Google Scholar]
- Syvanen AC. Detection of point mutations in human genes by the solid-phase minisequencing method. Clin Chim Acta. 1994;226:225–236. doi: 10.1016/0009-8981(94)90217-8. [DOI] [PubMed] [Google Scholar]
- Taillon-Miller P, Gu Z, Li Q, Hillier L, Kwok PY. Overlapping genomic sequences: A treasure trove of single-nucleotide polymorphisms. Genome Res. 1998;8:748–754. doi: 10.1101/gr.8.7.748. [DOI] [PMC free article] [PubMed] [Google Scholar]
- Wang DG, Fan JB, Siao CJ, Berno A, Young P, Sapolsky R, Ghandour G, Perkins N, Winchester E, Spencer J, et al. Large-scale identification, mapping, and genotyping of single-nucleotide polymorphisms in the human genome. Science. 1998;280:1077–1082. doi: 10.1126/science.280.5366.1077. [DOI] [PubMed] [Google Scholar]
- Zannis VI, Breslow JL, Utermann G, Mahley RW, Weisgraber KH, Havel RJ, Goldstein JL, Brown MS, Schonfeld G, Hazzard WR, et al. Proposed nomenclature of apoE isoproteins, apoE genotypes, and phenotypes. J Lipid Res. 1982;23:911–914. [PubMed] [Google Scholar]