

Abstract
Global cholera incidence is increasing, particularly in sub-Saharan Africa. We examined the impact of climate and ocean environmental variability on cholera outbreaks, and developed a forecasting model for outbreaks in Zanzibar. Routine cholera surveillance reports between 1997 and 2006 were correlated with remotely and locally sensed environmental data. A seasonal autoregressive integrated moving average (SARIMA) model determined the impact of climate and environmental variability on cholera. The SARIMA model shows temporal clustering of cholera. A 1°C increase in temperature at 4 months lag resulted in a 2-fold increase of cholera cases, and an increase of 200 mm of rainfall at 2 months lag resulted in a 1.6-fold increase of cholera cases. Temperature and rainfall interaction yielded a significantly positive association (P < 0.04) with cholera at a 1-month lag. These results may be applied to forecast cholera outbreaks, and guide public health resources in controlling cholera in Zanzibar.
Introduction
Since the beginning of the millennium, global cholera incidence has increased steadily with 24% more cases reported between 2004 and 2008 compared with 2000 and 2004.1 In the last 30 years, the burden of cholera has shifted from Asia to Africa, which is currently the source of over 94% of reported global cases,1,2 Vibrio cholerae O1 El Tor strain is the causative agent for the large majority of these cases.2 In Africa, cholera cases tend to occur sporadically or as small outbreaks, with a constant threat for more explosive epidemics, as illustrated in the recent Zimbabwe epidemic with 98,592 reported cases and 4,288 deaths in 11 months.3
Cholera outbreaks exhibit strong seasonality, tending to occur after increased rainfall and warm temperatures. This seasonality has been observed for centuries but it was not until the late 1970s that the environmental habitat of V. cholerae was discovered.4 Pathogenic Vibrios inhabit coastal and estuarine ecosystems, commensal with algae and the roots of aquatic plants, phytoplankton, zooplankton, and in particular copepods. A single copepod has been shown to host up to 103–105 Vibrios, attached to the gut wall and so ingestion of just a few copepods can have the potency to deliver an infective dose of V. cholerae.5,6 The significance of copepods as a transmission vector was demonstrated in Bangladesh where water filtration through sari cloth removed 99% of V. cholerae, i.e., those cells attached to the plankton.6
During periods between epidemics V. cholerae is able to adopt a viable but non-culturable state in response to nutrient deprivation, allowing Vibrios to persist in their natural aquatic habitat for long periods in a dormant state. Reversion back to the culturable, infectious phase is triggered by favorable environmental factors such as increased water temperature, pH, seawater nutrients, and decrease in salinity.7–9 The same environmental factors facilitate proliferation of copepods and free-living V. cholerae populations, resulting in large and sudden increases in environmental Vibrio numbers.8–11
Three marine environmental variables, sea surface height (SSH), sea surface temperature (SST), and ocean chlorophyll concentration (OCC), have shown to be predictive of cholera outbreaks in Kolkata, India; Matlab, Bangladesh; and Hue, Vietnam.10,12,13 The first of these studies, conducted in 2000 by Lobitz and others,10 used satellite imagery to derive the values for ocean parameters and linked these with cholera incidence. The SST was positively associated with cholera cases, affirming the hypothesis that a rise in SST encourages phytoplankton populations to bloom, which is directly associated with greater zooplankton populations and V. cholerae.10 The positive association of SSH with cholera cases was attributed to increased human to aquatic Vibrio contact.10,14 The indirect measurement of OCC in Kolkata showed a positive association with cholera, it is thought that the rise in OCC allows copepod populations to grow and thus V. cholerae.12 Measurement of OCC is difficult, however, and possibly problematic for making predictions because of its variability across small areas.5
Locally measured variables such as temperature and rainfall have been positively associated with increased cholera incidence in multiple studies. One of which was in Zambia, located in the same geographic region as Zanzibar, but lack of cholera case data between epidemics prevented the development of an appropriate predictive model.15 Environmental variables are linked to cholera outbreaks through the fluctuation of environmental Vibrio populations. Lagged dynamics are typically seen because of the time required between the change in the environment and environmental Vibrio reaching sufficient numbers for ingestion of an infectious dose.4 We hypothesize that ambient temperature is linked to SST and at its optimum for Vibrio growth, a lagged increase in cholera cases will occur.
Understanding environmental drivers of cholera outbreaks could facilitate a degree of outbreak prediction, allowing governments to prepare and respond early to potential outbreaks through actions such as employing vaccines. In addition, it offers insight into the local etiology of cholera, which would be helpful in planning prevention strategies. This study examines the association between climate variability and cholera outbreaks, and develops a climate-based forecasting model for cholera in Zanzibar using a time series analysis.
Methods
Study area.
Zanzibar, an archipelago ~50 km off the eastern coast of Tanzania mainland, consists of two main islands, Unguja and Pemba (Figure 1). The total population is about 1.1 million, of which 17% are < 5 years of age, 28% are 5 to 15 years of age, and 56% are > 15 years of age.16 Life expectancy is 57 years of age.16 The economy of the islands depends largely on agriculture, tourism, and fishing. The mean temperature varies between 21°C/70°F and 33°C/91°F with monthly rainfall between 25 mm/0.1 in. and 434 mm/1.7 in.17 The long rains and short rains typically occur between March and May, and from October to December, respectively. We restricted our study to Unguja where we collected data on the temporal distribution of cholera. The study omitted Pemba as the cholera data available was not enough to conduct a time series analysis. It is likely that the identified environmental predictors would apply to both islands as they are geographically, environmentally, and socioeconomically similar other than one area of Unguja, which is more urbanized than any part of Pemba.
Figure 1.
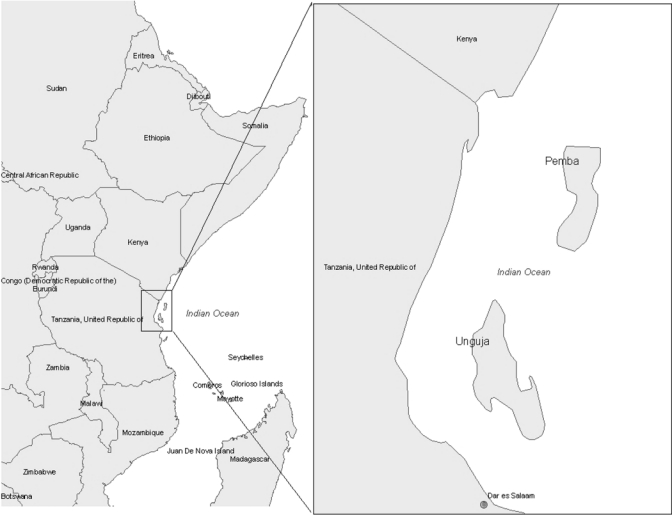
Study area: Zanzibar, East Africa.
Source data.
Environmental data.
Table 1 summarizes the source information for the environmental data. Mean monthly SST, SSH, and OCC were derived from satellite imagery. The satellite data for the SST variables are available from the beginning of January 1985, and are distributed by NASA's Jet Propulsion Laboratory. The Advanced Very High Resolution Radiometer (AVHRR), a space-borne sensor of the National Oceanic and Atmospheric Administration's (NOAA) family of polar orbiting platforms, collects data on 4-km areas. The SSH, a measure used to detect sea-level anomalies, is derived through satellite altimetry, and is available from 1992 from the TOPEX/Poseidon sensor, and available from 2002 from the Jason-1 sensor. Starting in 1997, OCC data were available from SeaWiFS and MODIS (MODerate resolution Imaging Spectroradiometer) sensors at a spatial resolution of 9 and 1 km, respectively. Approximately the same area is used to compile data for the satellite-derived, monthly environmental variables collected by all four sensors. Climate data from in situ sources include monthly minimum temperature, maximum temperature, rainfall, and humidity, which are collected by the Meteorological Department of the Zanzibar Government.
Table 1.
Climate and environmental variables and data sources
| Variable | Data source and availability |
|---|---|
| In situ climate variables | |
| Temperature | Meteorological department, Zanzibar Government: Unguja airport weather station (2002–2008) |
| Rainfall | Meteorological department, Zanzibar Government: Unguja airport weather station (2002–2008) |
| Humidity | Meteorological department, Zanzibar Government: Unguja airport weather station (2002–2008) |
| Satellite-derived environmental variables | |
| Sea surface temperature | AVHRR (2002–2008) Source: http://poet.jpl.nasa.gov/ |
| Sea surface height | TOPEX/Poseidon (2002–2008) Jason-1 (2002–2003), Source: http://www.aviso.oceanobs.com/ |
| Ocean chlorophyll concentration | MODIS (2002–2008), Source: SeaWiFS (2002–2008), Source: http://oceancolor.gsfc.nasa.gov/ |
Population and cholera data.
The population data were obtained from the national census of Zanzibar. Case reports for cholera were based on the Zanzibar Ministry of Health and Social Welfare's (MoHSW) cholera surveillance records. Reporting was based on the recommended World Health Organization (WHO) guidelines of acute watery diarrhea with microbiological confirmation; or after microbiological confirmation of the first 10 cases in an outbreak, and clinical criteria of severe watery diarrhea.18,19 All available local surveillance records and WHO country reports for Tanzania were reviewed for consistency, but only local reports were used for this study, which were available from 2002 to 2008. The large majority of cases were clinically diagnosed cholera with a smaller proportion of laboratory-confirmed cases, consistent with the WHO international guidelines. Both clinical- and laboratory-confirmed cases were included in the analysis.
Ethics.
The analysis was based on cholera reports collected routinely by the MoHSW Zanzibar, from whom we obtained the data for analysis. The reports did not include individual patient identifiers, thus no Institutional Review Board approval was sought for this study. Individual consent was not obtained for this study, because this was a retrospective analysis of existing data collected by MoHSW, hence, it was not necessary or possible to obtain consent from participants. Environmental data were obtained from open access sources.
Data analysis.
We analyzed the data by month, producing 84 time points during the study period (2002–2008). Univariate analysis was conducted for each of the climate and ocean environment variables with cross-correlation analysis to assess associations between cholera cases and covariates over a range of time lags.20,21 The time lags chosen for the final model were outcomes of the cross-correlation analysis using seasonal differencing of the data. A multivariate seasonal autoregressive integrated moving average (SARIMA) model was used to examine the independent contribution of the cholera transmission covariates, because its integrated functions for controlling seasonal variation, autocorrelation, and long-term trends make it the most appropriate model for this time series analysis.22 The numbers of terms in the SARIMA model were determined by autocorrelation function (ACF) and partial autocorrelation function (PACF). The outcome variable (number of cases) was transformed into a square root, as recommended by Johnson and Wichern,23 to address issues with zero-inflated count data.
To create an appropriate stationary time series for the analysis, all dependent and independent variables were seasonally differenced with regard to yearly periodicity. We determined the need for differencing the monthly cholera cases by checking stationarity (trends in the mean and variance), and the order of both seasonal and non-seasonal autoregressive and moving average indicators by using the ACF and PACF. The model used in this study was SARIMA(p, d, q)(P, D, Q)s, where p is the order of autoregression; d, the degree of difference; q, the order of moving average; P, the seasonal autoregression; D, the seasonal integration; Q, the seasonal moving average; and s, the length of the seasonal period. We used the stepwise SARIMA method to select covariates associated with cholera cases at P < 0.1. Our main criterion for judging the superiority of the model against other models was based on the lowest value in the Akaike's information criterion (AIC), a measure of the goodness-of-fit of an estimated statistical model.24 The goodness-of-fit of the models were determined for appropriate modeling, using both ACF and PACF of residuals, and checking the normality of the residuals.
Data from 2002 to 2008 were used for parameter estimations. For validation of the model, we used the data from 2002 to 2007 as the training period, and the data from 2008 as the validation period. Finally, the data from 2008 was used to test the forecasting ability of the method using the root mean square (RMS) error criterion. The smaller the RMS error, the better the model is for forecasting. All analyses were carried out using SAS version 9.1 (SAS Institute, Inc., Cary, NC).
Results
In Unguja, 3,245 cholera cases were reported between 2002 and 2008, and the temporal patterns of cases are shown in Figure 2. The characteristics of the study data are shown in Table 2. We calculated 12 months of seasonally differenced values for each variable to ensure the time series of climate and environmental variables, and the square root transformed cholera outbreaks were stationary. The results of the cross-correlations using seasonal differencing of the data show that cholera outbreaks were significantly positively associated (P < 0.05) with minimum temperature at lags of 2 and 4 months, negatively associated with maximum temperature at a lag of 2 months, positively associated with humidity at a lag of 5 months, and positively associated with rainfall at a lag of 1 month. None of the ocean environmental variables show significant association with the cholera outbreaks (Table 3). Covariates indicating significant correlation are: minimum temperature with positive SST (P < 0.01), maximum temperature with negative rainfall (P < 0.01) and negative humidity (P < 0.01), rainfall with positive humidity (P < 0.01), humidity with negative SST (P < 0.05), and OCC from MODIS with positive OCC from SeaWiFS (P < 0.01) (Table 4). These variables were included separately in the models to avoid multicollinearity. The seasonally differenced minimum temperature and rainfall, respectively, are positively associated with cholera outbreaks (Figure 3). However, a few cases did not line up well, because of the nature of the outbreak, reporting system, and lagged effects of climate and ocean environment variability.
Figure 2.
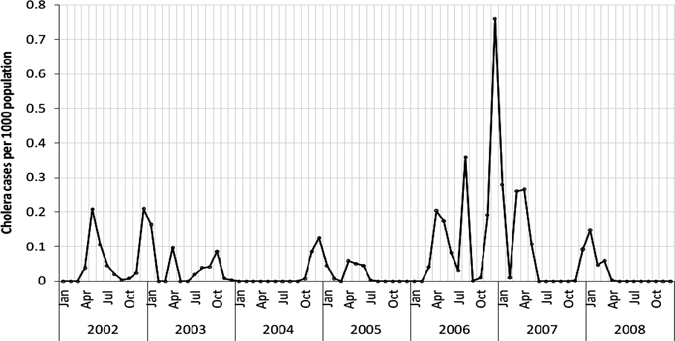
Monthly cholera incidence rates in Unguja, Zanzibar, 2002–2008.
Table 2.
Characteristics of the study data, Unguja, Zanzibar*
| Variables (monthly average) | N (months) | Mean | SD | Minimum | Maximum |
|---|---|---|---|---|---|
| Monthly cholera cases | 84 | 38.63 | 77.17 | 0 | 534 |
| Minimum temperature | 84 | 23.15 | 1.37 | 20.2 | 25.3 |
| Maximum temperature | 84 | 30.68 | 1.47 | 28.2 | 33.8 |
| Rainfall | 84 | 141.35 | 156.36 | 3 | 705.4 |
| Humidity | 84 | 78.30 | 5.95 | 57 | 89 |
| Sea surface temperature | 79 | 27.64 | 1.44 | 25.065 | 29.894 |
| Sea surface height | 79 | −0.17 | 3.96 | −9.504 | 10.172 |
| Ocean chlorophyll concentration from MODIS | 78 | 0.13 | 0.05 | 0.068 | 0.353 |
| Ocean chlorophyll concentration from Sea-Wifs | 84 | 0.16 | 0.06 | 0.086 | 0.346 |
The variables (except cholera cases) are monthly averages.
Table 3.
Cross-correlation coefficients of square root of observed cholera cases and climate and environmental variability using 12-month seasonal differencing, Unguja, Zanzibar
| Variables | Lag (month) | |||||
|---|---|---|---|---|---|---|
| 0 | 1 | 2 | 3 | 4 | 5 | |
| Minimum temperature | 0.00 | 0.08 | 0.25** | 0.07 | 0.23** | −0.02 |
| Maximum temperature | −0.11 | −0.19* | −0.12 | −0.05 | 0.07 | −0.02 |
| Rainfall | 0.05 | 0.24** | 0.19* | 0.09 | −0.01 | 0.00 |
| Humidity | 0.00 | 0.20* | 0.08 | −0.09 | −0.04 | 0.22** |
| Sea surface temperature | −0.11 | −0.01 | −0.04 | −0.17 | −0.15 | 0.07 |
| Sea surface height | 0.07 | 0.04 | 0.16 | −0.01 | −0.06 | −0.05 |
| Ocean chlorophyll concentration from MODIS | 0.08 | 0.00 | 0.06 | −0.01 | −0.07 | −0.02 |
| Ocean chlorophyll concentration from Sea-Wifs | −0.14 | −0.12 | 0.18* | 0.12 | −0.17* | −0.01 |
P < 0.1;
P < 0.05.
Table 4.
Inter-correlations between climate and environmental variables using 12-month seasonal differencing, Unguja, Zanzibar
| Variables | Maximum temperature | Rainfall | Humidity | SST | SSH | OCC from MODIS | OCC from Sea-Wifs |
|---|---|---|---|---|---|---|---|
| Minimum temperature | 0.16 | 0.20 | 0.01 | 0.35*** | 0.12 | −0.15 | 0.01 |
| Maximum temperature | −0.53*** | −0.52*** | 0.22 | 0.14 | 0.01 | 0.16 | |
| Rainfall | 0.48*** | 0.09 | −0.001 | 0.14 | −0.13 | ||
| Humidity | −0.26** | 0.001 | 0.06 | −0.23* | |||
| SST | −0.12 | −0.11 | −0.01 | ||||
| SSH | −0.06 | −0.09 | |||||
| OCC from Modis | 0.69*** |
SST = sea surface temperature; SSH = sea surface height; OCC = ocean chlorophyll concentration.
P < 0.1;
P < 0.05;
P < 0.01.
Figure 3.
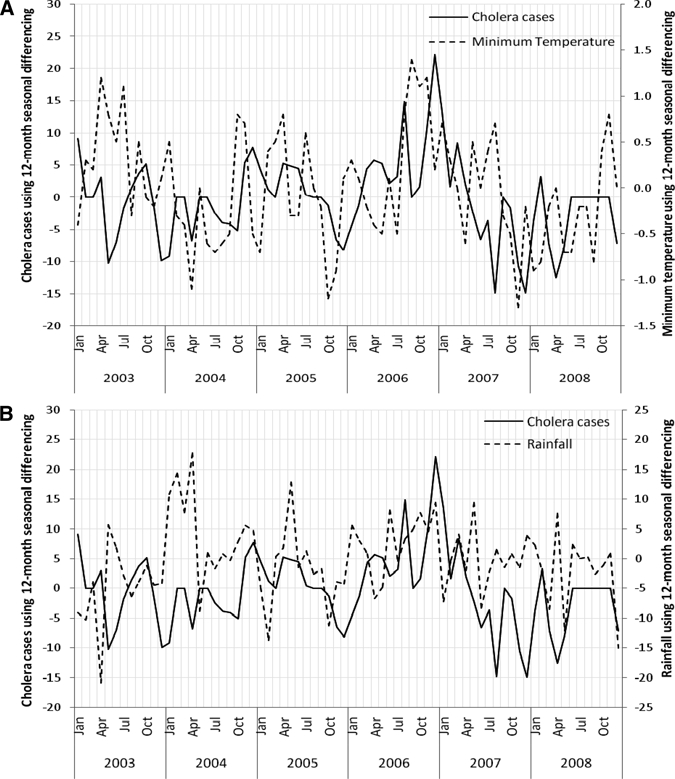
Relationship between square root of monthly observed cholera cases and (A) minimum temperature and (B) rainfall using seasonal differencing in Unguja, Zanzibar during the period 2003–2008.
SARIMA model.
The best fit model without covariates (null model) was SARIMA([1,0,0][0,1,1]12), and the best fit model with covariates (covariate model) was SARIMA([1,4],[0,0][0,1,1]12) based on the AIC values. A backward elimination method selected variables most suitable for the model. The results of the null model showed temporal clustering of cholera at a 1-month lag. The patterns of the temporal clustering of cholera were modified by the climatic variables, as obtained in the covariate model, yielding clustering at a 1-month lag and at a 4-month lag (Table 5). The temporal lag relation of cholera and minimum temperature is 4 months, and the temporal lag relation of cholera and rainfall is 2 months. An increase of 1°C in minimum temperature at a 4-month lag resulted in a 2-fold increase of cholera cases; and an increase of 200 mm in rainfall at a 2-month lag resulted in a 1.6-fold increase of cholera cases. The interaction of temperature and rainfall yielded a significant association (P = 0.04) with cholera at a 1-month lag (Table 3). The goodness-of-fit analysis shows that there was no significant autocorrelation between residuals at different lags in the SARIMA model and the model fits the data well.
Table 5.
Regression coefficients of seasonal autoregressive integrated moving average (SARIMA) on monthly cholera cases in Unguja, Zanzibar, 2002–2008
| Variables | Model without covariates | Model with covariates | ||||
|---|---|---|---|---|---|---|
| Estimate | Standard error | P value | Estimate | Standard error | P value | |
| Seasonal moving average | 0.750 | 0.097 | < 0.0001 | 0.749 | 0.120 | < 0.0001 |
| Autoregression at 1 month lag | 0.526 | 0.105 | < 0.0001 | 0.493 | 0.109 | < 0.0001 |
| Autoregression at 4 months lag | 0.291 | 0.109 | 0.010 | |||
| Minimum temperature at 4 months lag | – | – | – | 2.208 | 1.021 | 0.034 |
| Rainfall at 2 months lag | 0.008 | 0.003 | 0.025 | |||
| Minimum temperature × rainfall at 1 month lag | 0.0003 | 0.0001 | 0.044 | |||
| Akaike's information criterion (AIC) | 423.35 | 390.62 | ||||
Validation model.
The model developed using the data for the 2002–2007 periods was used to predict cholera cases, and then validated using the data between January and December 2008. The validation results show the SARIMA model to be an appropriate model for forecasting cholera outbreaks in Zanzibar (RMS errors for both training and validation period are 3.92 and 4.50, respectively). In the training period, it had lower predicted values in August and December 2006, and in the validation period, it had a higher observed value in December 2008 (Figure 4). Except for these points, the predicted and observed cases were matched reasonably well, and there was consistency in the trend. The time series plot of cumulative sums of observed and predicted cholera cases showed only a small gap in August 2006, and that was retained during the rest of the study period (Figure 5).
Figure 4.
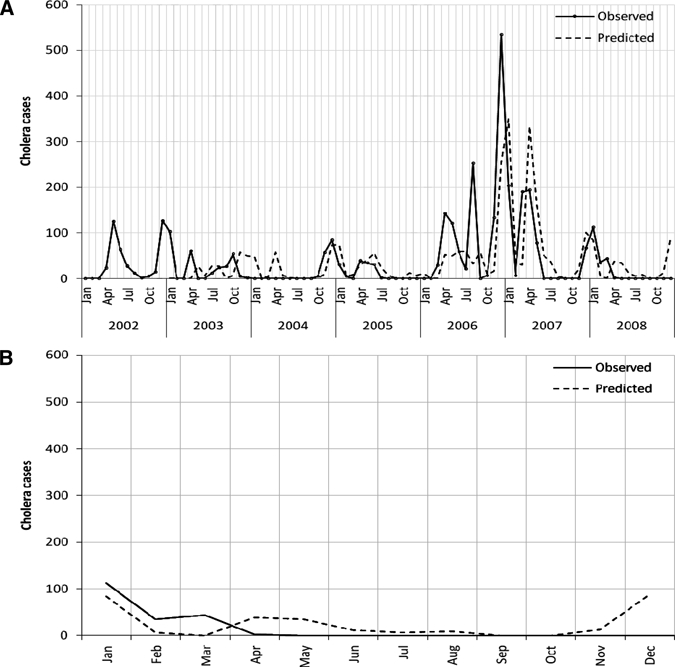
(A) Predicted vs. observed monthly cholera cases in Unguja, Zanzibar during 2003–2008. (B) Validation model for the period January to December 2008 with monthly cholera cases.
Figure 5.
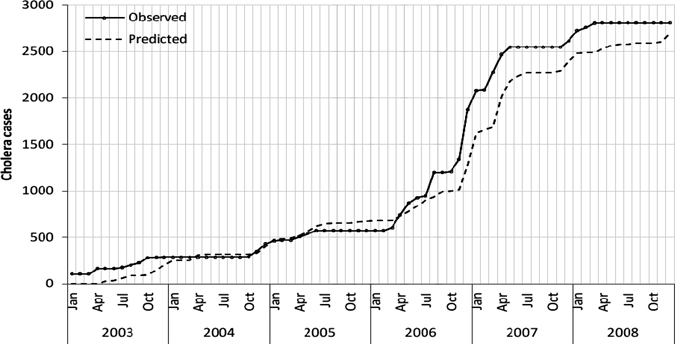
Cumulative sums for observed and predicted cholera cases in Unguja, Zanzibar during 2003–2008.
Discussion
This study provides reassuring evidence that rainfall and temperature, among various climate and ocean environmental variables are the key drivers of cholera outbreak, consistent with results from other studies.14 In Nha Trang, Viet Nam, Emch and coworkers13 showed that the probability of outbreaks was higher with increased rainfall, river height, and discharge. In Bangladesh, Hashizume and coworkers25 showed the risk of cholera increased with high rainfall, and conversely, with decreased rainfall suggesting that river level was on the causal pathway. Their findings illustrate the variability of environmental predictors across and within study sites, hence the importance of conducting thorough time series analysis by site if a plausible predictive model is to be reached. Consistent across the two studies was the attribution of the positive association of cholera with rainfall, to increased Vibro to human contact caused by flooding and an inundation effect where the environment is inundated with the bacteria.
Heavy rainfall and consequent flooding increases the risk of sewage contaminating the drinking water. In Zanzibar the most common toilet facility are pit latrines,26 where the untreated waste water can overflow or seep through the ground into the drinking water found in wells or pipes. Many piped water lines contain leaks caused by age and lack of maintenance and during times of low water pressure the surrounding ground water may be actively sucked into the pipes. Poor drainage is common in many cholera-affected areas, and during heavy rains, residential areas can be submerged in water for prolonged periods of time, promoting human Vibrio contact.
The relationship between temperature and amplification of cholera incidence is well documented.5,8,12,14,27–30 Warmer temperatures increase SST facilitating Vibrio reproduction and hence the probability of ingesting an infectious dose.5,14 Our concurring findings are important in light of the current global warming phenomenon, Climatologists predict a 1.4°C/35°F to 5.8°C/42°F rise in mean temperature over the next 100 years.30 Increased sea temperatures and levels associated with global warming intuitively suggest the possibility of increased cholera incidence in many resource-poor regions of the world.
The main limitation of this study was the use of routine surveillance data. The majority of cases were clinically diagnosed with only a small proportion laboratory-confirmed. However, it is likely that these outbreaks were indeed caused by V. cholerae as indicated by laboratory confirmation of initial cases during each outbreak and by the case fatality rates. Consistent with international guidelines, not every suspected case was laboratory-confirmed, and this may have resulted in an overestimation of actual cholera cases. On the other hand, there is the possibility that the number of cases were under-reported as patients may not have sought care.
There is potential to develop an early warning system for cholera in Zanzibar using a predictive model, which would give public health authorities sufficient time to prepare medical equipment and mobilization of staff in the event of an outbreak. Prediction of outbreaks is imperative in order for cholera prevention strategies to be efficient and cost-effective such as targeted pre-emptive mass oral cholera vaccination. However, more work is needed on refining such a model before it is ready for routine use. In addition, this study provides useful clues on further elucidating the risk factors for cholera that can be used to direct public health strategies.
In conclusion, this study supports the findings of previous studies illustrating the link between cholera incidence and climatic factors. Rainfall and temperature observations could facilitate a warning signal for cholera outbreaks in Zanzibar. Our model contributes to the growing literature on the link between cholera and environmental factors, which can eventually be used to predict and prepare for cholera epidemics.
ACKNOWLEDGMENTS
We are grateful to the staff members of the Ministry of Health and Meteorological Department of Zanzibar for providing us the data for conducting this study.
Footnotes
Financial support: Support for this study was provided by the Bill & Melinda Gates Foundation through the Cholera Vaccine Initiative (CHOVI) Program, administered by the International Vaccine Institute (IVI), and the Swedish International Development Cooperation Agency (SIDA).
Authors' addresses: Rita Reyburn, International Vaccine Institute (IVI), CHOZAN project, Zanzibar, Tanzania, E-mail: rita_reyburn@hotmail.com. Deok Ryun Kim, Lorenz von Seidlein, and Mohammad Ali, International Vaccine Institute, SNU Research Park, Seoul, Korea, E-mails: drkim@ivi.int, lseidlein@ivi.int, and mali@ivi.int. Michael Emch, Department of Geography, University of North Carolina, Saunders Hall, Chapel Hill, NC, E-mail: emch@email.unc.edu. Ahmed Khatib, Ministry of Health and Social Welfare, Zanzibar, Tanzania, E-mail: ahmedbenga@yahoo.com.
References
- 1.WHO . Weekly Epidemiological Record. 2009. [Google Scholar]
- 2.Gaffga NH, Tauxe RV, Mintz ED. Cholera: a new homeland in Africa? Am J Trop Med Hyg. 2007;77:705–713. [PubMed] [Google Scholar]
- 3.United Nations Office for the Coordination of Humanitarian Affairs . Afghanistan; OCHA: 2009. Daily cholera update. [Google Scholar]
- 4.Colwell RR. Global climate and infectious disease: the cholera paradigm. Science. 1996;274:2025–2031. doi: 10.1126/science.274.5295.2025. [DOI] [PubMed] [Google Scholar]
- 5.Sack DA, Sack RB, Nair GB, Siddique AK. Cholera. Lancet. 2004;363:223–233. doi: 10.1016/s0140-6736(03)15328-7. [DOI] [PubMed] [Google Scholar]
- 6.Colwell RR, Huq A, Islam MS, Aziz KM, Yunus M, Khan NH, Mahmud A, Sack RB, Nair GB, Chakraborty J, Sack DA, Russek-Cohen E. Reduction of cholera in Bangladeshi villages by simple filtration. Proc Natl Acad Sci USA. 2003;100:1051–1055. doi: 10.1073/pnas.0237386100. [DOI] [PMC free article] [PubMed] [Google Scholar]
- 7.Huq A, Whitehouse CA, Grim CJ, Alam M, Colwell RR. Biofilms in water, its role and impact in human disease transmission. Curr Opin Biotechnol. 2008;19:244–247. doi: 10.1016/j.copbio.2008.04.005. [DOI] [PubMed] [Google Scholar]
- 8.Colwell RR. Viable but nonculturable bacteria: a survival strategy. J Infect Chemother. 2000;6:121–125. doi: 10.1007/pl00012151. [DOI] [PubMed] [Google Scholar]
- 9.Sack DA. Cholera. Lancet. 1997;349:1825–1830. doi: 10.1016/S0140-6736(97)04486-3. [DOI] [PubMed] [Google Scholar]
- 10.Lobitz B, Beck L, Huq A, Wood B, Fuchs G, Faruque AS, Colwell R. Climate and infectious disease: use of remote sensing for detection of Vibrio cholerae by indirect measurement. Proc Natl Acad Sci USA. 2000;97:1438–1443. doi: 10.1073/pnas.97.4.1438. [DOI] [PMC free article] [PubMed] [Google Scholar]
- 11.Ali M, Emch M, Donnay JP, Yunus M, Sack RB. The spatial epidemiology of cholera in an endemic area of Bangladesh. Soc Sci Med. 2002;55:1015–1024. doi: 10.1016/s0277-9536(01)00230-1. [DOI] [PubMed] [Google Scholar]
- 12.Constantin de Magny G, Murtugudde R, Sapiano MR, Nizam A, Brown CW, Busalacchi AJ, Yunus M, Nair GB, Gil CL, Lanata CF, Calkins J, Manna B, Rajendran K, Bhattacharya MK, Huq A, Sack RB, Colwell RR. Environmental signatures associated with cholera epidemics. Proc Natl Acad Sci USA. 2008;105:17676–17681. doi: 10.1073/pnas.0809654105. [DOI] [PMC free article] [PubMed] [Google Scholar]
- 13.Emch M, Feldacker C, Yunus M, Streatfield PK, Dinh Thiem V, Canh do G, Ali M. Local environmental predictors of cholera in Bangladesh and Vietnam. Am J Trop Med Hyg. 2008;78:823–832. [PubMed] [Google Scholar]
- 14.Colwell RR. A voyage of discovery: cholera, climate and complexity. Environ Microbiol. 2002;4:67–69. doi: 10.1046/j.1462-2920.2002.00270.x. [DOI] [PubMed] [Google Scholar]
- 15.Luque Fernandez MA, Bauernfeind A, Jimenez JD, Gil CL, El Omeiri N, Guibert DH. Influence of temperature and rainfall on the evolution of cholera epidemics in Lusaka, Zambia, 2003–2006: analysis of a time series. Trans R Soc Trop Med Hyg. 2009;103:137–143. doi: 10.1016/j.trstmh.2008.07.017. [DOI] [PubMed] [Google Scholar]
- 16.MoHSW Z . Country Health Profile. Zanzibar: Ministry of Health and Social Welfare; 2008. [Google Scholar]
- 17.Meterorological Department Z . Monthly weather data. Zanzibar town: data on weather variables. 2009. [Google Scholar]
- 18.Health Management Information System M . National Guidelines for Integrated Disease Surveillance and Response Guidelines (IDRS) Zanzibar: Ministry of Health and Social Welfare; 2008. [Google Scholar]
- 19.WHO, Global Task Force on Cholera Outbreak . Cholera outbreak: assessing the outbreak response and improving preparedness. Geneva, Switzerland: WHO; 2004. [Google Scholar]
- 20.Chatfield C. The Analysis of Time Series: Theory and Practice. London, UK: Chapman and Hall; 1975. [Google Scholar]
- 21.Chatfield WR, Rogers TG, Brownlee BE, Rippon PE. Placental scanning with computer-linked gamma camera to detect impaired placental blood flow and intrauterine growth retardation. BMJ. 1975;2:120–122. doi: 10.1136/bmj.2.5963.120. [DOI] [PMC free article] [PubMed] [Google Scholar]
- 22.Zhang Y, Bi P, Hiller J. Climate variations and salmonellosis transmission in Adelaide, South Australia: a comparison between regression models. Int J Biometeorol. 2008;52:179–187. doi: 10.1007/s00484-007-0109-4. [DOI] [PubMed] [Google Scholar]
- 23.Johnson RA, Wichern DW. Applied Multivariate Statistical Analysis. Englewood Cliffs, NJ: Prentice Hall; 1998. [Google Scholar]
- 24.Naish S, Hu W, Nicholls N, Mackenzie JS, McMichael AS, Dale P, Tong S. Weather variability, tides, and Barmah Forest virus disease in the Gladstone region, Australia. Environ Health Perspect. 2006;114:678–683. doi: 10.1289/ehp.8568. [DOI] [PMC free article] [PubMed] [Google Scholar]
- 25.Hashizume M, Armstrong B, Hajat S, Wagatsuma Y, Faruque AS, Hayashi T, Sack DA. The effect of rainfall on the incidence of cholera in Bangladesh. Epidemiology. 2008;19:103–110. doi: 10.1097/EDE.0b013e31815c09ea. [DOI] [PubMed] [Google Scholar]
- 26.Houshold Budget Survey . Zanzibar: Ministry of Health and Social Welfare; 2006. [Google Scholar]
- 27.Alam M, Sultana M, Nair GB, Siddique AK, Hasan NA, Sack RB, Sack DA, Ahmed KU, Sadique A, Watanabe H, Grim CJ, Huq A, Colwell RR. Viable but nonculturable Vibrio cholerae O1 in biofilms in the aquatic environment and their role in cholera transmission. Proc Natl Acad Sci USA. 2007;104:17801–17806. doi: 10.1073/pnas.0705599104. [DOI] [PMC free article] [PubMed] [Google Scholar]
- 28.Colwell RR. Infectious disease and environment: cholera as a paradigm for waterborne disease. Int Microbiol. 2004;7:285–289. [PubMed] [Google Scholar]
- 29.Louis VR, Russek-Cohen E, Choopun N, Choopun N, Rivera IN, Gangle B, Jiang SC, Rubin A, Patz JA, Huq A, Colwell RR. Predictability of Vibrio cholerae in Chesapeake Bay. Appl Environ Microbiol. 2003;69:2773–2785. doi: 10.1128/AEM.69.5.2773-2785.2003. [DOI] [PMC free article] [PubMed] [Google Scholar]
- 30.Lipp EK, Huq A, Colwell RR. Effects of global climate on infectious disease: the cholera model. Clin Microbiol Rev. 2002;15:757–770. doi: 10.1128/CMR.15.4.757-770.2002. [DOI] [PMC free article] [PubMed] [Google Scholar]