

Abstract
Large-scale gene expression studies and genomic sequencing projects are providing vast amounts of information that can be used to identify or predict cellular regulatory processes. Genes can be clustered on the basis of the similarity of their expression profiles or function and these clusters are likely to contain genes that are regulated by the same transcription factors. Searches for cis-regulatory elements can then be undertaken in the noncoding regions of the clustered genes. However, it is necessary to assess the efficiency of both the gene clustering and the postulated regulatory motifs, as there are many difficulties associated with clustering and determining the functional relevance of matches to sequence motifs. We have developed a method to assess the potential functional significance of clusters and motifs based on the probability of finding a certain number of matches to a motif in all of the gene clusters. To avoid problems with threshold scores for a match, the top matches to a motif are taken in several sample sizes. Genes from a sample are then counted by the cluster in which they appear. The probability of observing these counts by chance is calculated using the hypergeometric distribution. Because of the multiple sample sizes, strong and weak matching motifs can be detected and refined and significant matches to motifs across cluster boundaries are observed as all clusters are considered. By applying this method to many motifs and to a cluster set of yeast genes, we detected a similarity between Swi Five Factor and forkhead proteins and suggest that the currently unidentified Swi Five Factor is one of the yeast forkhead proteins.
Understanding how gene expression is regulated is one of the great challenges of molecular biology. Major advances in this area are hoped for with the advent of gene expression profiling studies (Velculescu et al. 1997; Carulli et al. 1998; Bowtell 1999). Already many regulatory regions of genes and the binding sites of transcription factors have been biologically characterized (Pedersen et al. 1999). Databases (e.g., Zhu and Zhang 1999; Wingender et al. 2000) now provide access to the weight matrices or consensus sequences that describe these sites. Attempts are also being made to predict regulatory elements in noncoding genomic DNA through computational methods (Frech et al. 1997). However, because of the relatively high probability of finding a particular oligonucleotide sequence by chance, this problem is complex and success, so far, has been limited (Fickett and Hatzigeorgiou 1997; Bucher 1999). With the vast amount of genomic sequence now available, the need for effective automated identification of the elements that regulate gene expression is more urgent. Combining the computational techniques to identify regulatory elements with data from analyses of gene expression profiles appears, at present, to be the most promising approach to this problem (Bucher 1999).
Gene expression profiles have been generated by many large-scale studies (e.g., DeRisi et al. 1997; Cho et al. 1998; Chu et al. 1998; Spellman et al. 1998; Wen et al. 1998). From these studies, clusters of genes that have similar expression patterns can be determined (Eisen et al. 1998; Wen et al. 1998; Heyer et al. 1999). These clusters have been shown to be enriched for genes whose products have similar functions or the presence of known regulatory elements upstream of their promoters (Eisen et al. 1998; Spellman et al. 1998; Wen et al. 1998; Tavazoie et al. 1999). They form an important resource for the identification of novel motifs (Bucher 1999; Tavazoie et al. 1999). It is also possible to cluster genes based on the functional annotations of their proteins, determined by sequence similarity and/or biological methods, as in the Munich Information Center for Protein Sequences (MIPS) yeast functional classification (Mewes et al. 1997).
Several methods have been used to compare expression profiles before clustering. Most commonly, the distance between two profiles (Wen et al. 1998; Tavazoie et al. 1999) or the correlation coefficient (Eisen et al. 1998; Heyer et al. 1999) are used. The data points used for the comparison might include the expression ratios at each time point (Spellman et al. 1998) and/or the slopes between time points (Wen et al. 1998). However, expression profiles that are close to each other based on the comparison score can appear dissimilar on visual inspection. Heyer et al. (1999) have suggested that this is largely because of the effects of poor data points, or outliers, on the comparison measure. The quality of the expression data can be affected by difficulties with hybridization and with the measurement of fluorescence intensities, giving rise to errors in the expression profiles and, therefore, in the comparison measures that will be used for the clustering.
Clusters of expression profiles have also been produced by many methods. Hierarchical clustering (Eisen et al. 1998; Wen et al. 1998), k-means clustering (Tavazoie et al. 1999), and self-organizing maps (Tamayo et al. 1999), as well as support vector machines (Brown et al. 2000), are in use. Recently, new clustering methods have been developed with expression data in mind (Ben-Dor et al. 1999; Heyer et al. 1999). Although these authors demonstrate the utility of their methods for analyzing gene expression data, all clustering methods present some problems in their interpretation. There can be difficulties caused by fixing the assignment of members to clusters early, rather than later, in the process (local vs. global comparisons); in deciding the number of clusters to divide the data into (under- or overclustering); and by the choice of the initial conditions of the clustering algorithm (Bittner et al. 1999; Heyer et al. 1999). In addition, clustering assigns genes to individual groups, although biologically it may be more relevant for a gene to be a member of multiple groups (Gaasterland and Bekiranov 2000). Given these issues and the questions over the accuracy of the comparison scores underlying the clustering methods, there is a need to evaluate the relevance and effectiveness of the clusters resulting from gene expression studies.
Finding motifs that could be regulatory elements from conserved patterns in DNA sequences can be achieved by several algorithms (Frech et al. 1997; Roth et al. 1998; Yada et al. 1998; Hertz and Stormo 1999). It is less straightforward, though, to verify the functional significance of these postulated regulatory motifs. As transcription factors often show the ability to bind to several DNA sequences, regulatory motifs are normally expressed as weight matrices and, so, contain a degree of ambiguity (Frech et al. 1997). Distinguishing functional matches from a background of chance matches can be difficult (Bucher 1999). Programs that detect matches to motifs are available (Quandt et al. 1995; Roth et al. 1998; Hertz and Stormo 1999), but their use raises the question of what threshold score should be used for a significant (hopefully functional) match. Even given a threshold score, there will still be nonfunctional matches above the threshold, and borderline or low-scoring matches may still be functional. As with clusters, a more effective way to evaluate regulatory element motifs is needed.
In this work, we develop a method to assess the significance of both clusters of related genes and sequence motifs that may represent regulatory sites. This method is based around a set of gene clusters and several sequence motifs, but it is independent of how the genes were clustered, how the motifs were created, and of the method used to score motif matches. Instead of using a threshold score, the genes whose upstream regions best match a motif are collected in groups, or samples, of varying sizes. The number of genes from a sample that falls in each cluster is then counted, and the probability of observing at least this number by chance can be determined using the hypergeometric distribution. Clusters with a statistically significant overrepresentation of genes from a sample can be further investigated. The use of multiple sample sizes allows the behavior of a motif to be examined over both strong and weak matches, which can give greater insights into the behavior of both clusters and motifs. The effectiveness of this method is demonstrated on a previously published clustering of genes (Tavazoie et al. 1999) based on gene expression studies of the yeast cell cycle (Cho et al. 1998; Spellman et al. 1998) and a large number of motifs.
RESULTS
Assessing Clusters and Motifs
Two sets of gene clusters were created from the Saccharomyces cerevisiae genome based on data from the gene expression studies of the cell cycle by Cho et al. (1998) and Spellman et al. (1998). The primary set (of 2803 genes) followed the gene clusters defined by Tavazoie et al. (1999). For the secondary set, the remaining 3344 genes were assigned to clusters based on the mean expression profile of the primary set cluster to which they were closest. Thus, to some extent, the clusters of the secondary set mirror those of the primary set. Motifs derived from a variety of sources (see Methods) were then matched to the upstream sequences of the genes that were included in each cluster set. The genes with the highest-scoring matches to a motif in their upstream regions were collected in groups, or samples. Nine sample sizes, ranging from the highest 50 to the highest 600 scoring matches, were used. The strongest matches between a motif and the upstream regions of the genes will be in the small group sizes, while the larger groups may also contain quite weak matches. The genes in these samples were then counted by the cluster in which they occurred. The probability of observing by chance at least the number of genes from a sample that are in each cluster can be calculated using the hypergeometric distribution. P values of 10−4 or smaller (see Methods) were considered to warrant further investigation.
Figure 1A,B shows the results of this process for the primary and secondary cluster sets with the nine sample sizes and for genes whose upstream regions match the MCB (Mlu1 cell-cycle box) motif (McIntosh 1993). The specific motif description was taken from the data of Tavazoie et al. (1999), as described in the Methods section. It can be seen from Figure 1A that the genes with upstream regions matching this motif are highly overrepresented in cluster 2 of the primary set. Probability values as low as 10−64 were found for observing by chance at least the number of genes from one of the samples that were in this cluster. By using several sample sizes, it is possible to see the effect of both strong (from the small samples) and weak (from the larger samples) matches to the motif description. For the MCB motif, the lowest probability values occur at the intermediate sample sizes (200–400). Except for clusters 14 and 23, the other clusters contain the numbers of genes from the sample that would be expected by random chance. Genes from the larger sample sizes (weaker matches) were most highly overrepresented in cluster 14, and although the overrepresentation in cluster 23 is relatively weak, it clearly contains relatively more matching genes than the remaining clusters. From Figure 1C, it can be seen that the mean expression profiles for clusters 2, 14, and 23 are periodic and consistent with the expression patterns of genes that are regulated through the MCB (McIntosh 1993). The mean profiles of clusters 2 and 23 are quite similar to each other, but cluster 14 has a phase different from these two.
Figure 1.
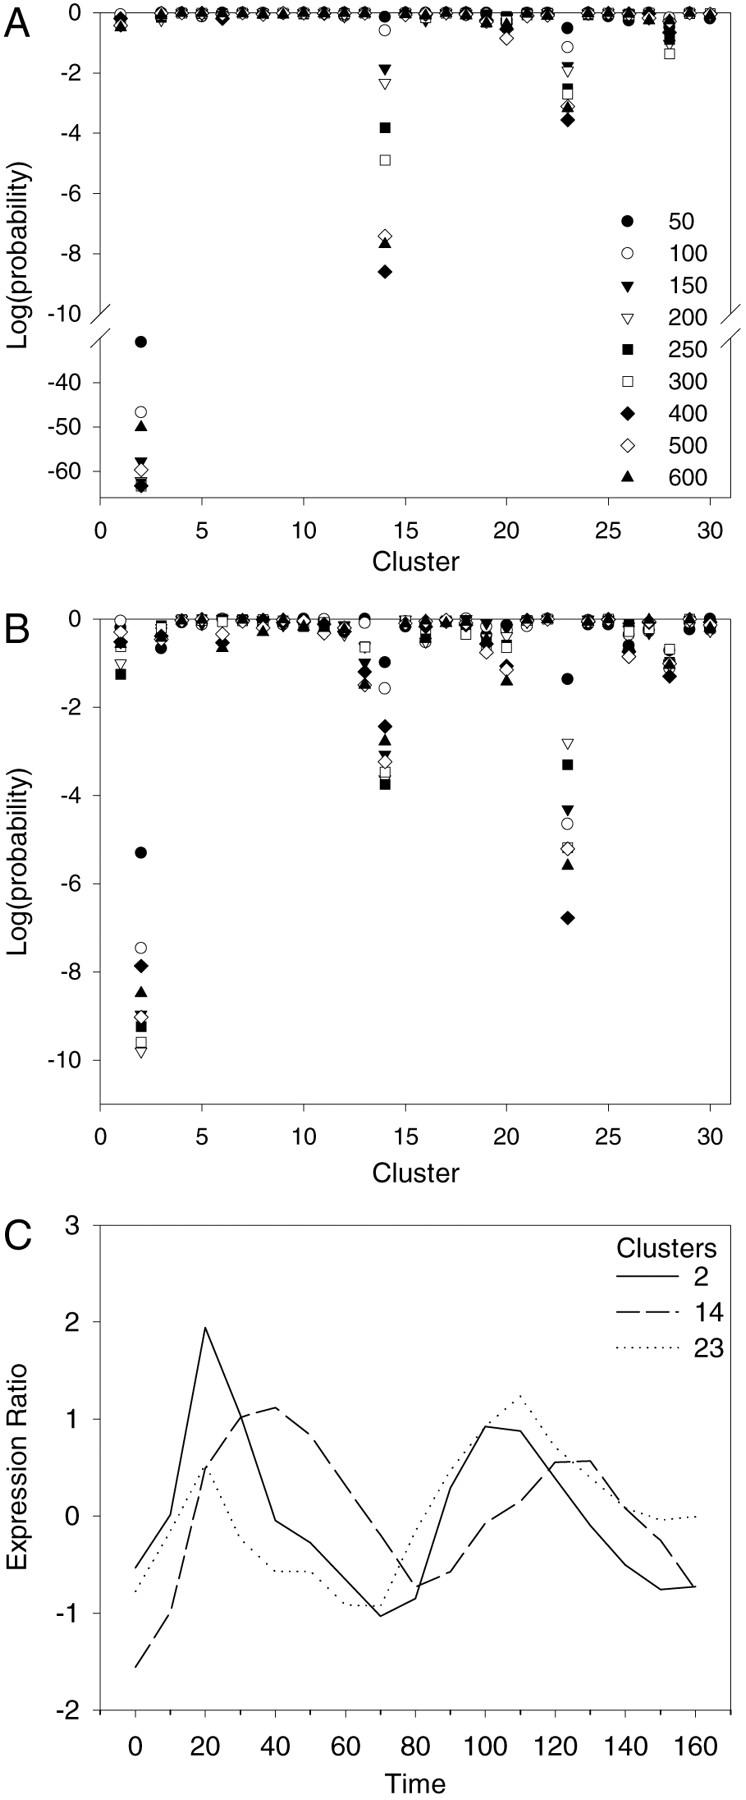
Analysis of genes with upstream regions that match the MCB motif in the primary (A) and secondary (B) cluster sets. The symbols representing the nine sizes of the samples of genes with the best matches of a motif to their upstream regions are given in A. These symbols are used throughout this work. In A and B, the log of the probability of observing at least the number of genes from a sample in a cluster is given for each sample size and each cluster. Probabilities are determined from the hypergeometric distribution based on the total number of genes in the cluster set, the sample size, the size of the cluster, and the number of genes from the sample that are in the cluster (see Methods). The overrepresentation of genes from the samples in clusters 2, 14, and 23 in both cluster sets is clear. (C) The mean expression profiles for clusters 2, 14, and 23 (from data taken from the website of Spellman et al. 1998).
For the MCB motif, the specificity of matches to the upstream regions of genes in the secondary cluster set, that is, those genes filtered out of consideration by Tavozoie et al. (1999), was also examined. Figure 1B demonstrates that genes with upstream regions that match the MCB motif are significantly overrepresented in cluster 2 of the secondary set, somewhat less so in cluster 23, and marginally so in cluster 14. Finding matches to the MCB motif in significant numbers of the upstream regions of the genes of cluster 23 in both cluster sets raises the question of the appropriateness of separating clusters 2 and 23, which have related mean profiles. Indeed, clusters 2 and 23 contain many genes with similar functions (DNA replication and repair), while the genes of cluster 14 have functions different from those in clusters 2 and 23 (organization of the centrosome and cytoskeleton; Mewes et al. 1997; Tavazoie et al. 1999).
If a motif is significantly associated with a cluster, other motifs that are also associated with that cluster can be examined to see whether or not they are versions of the same motif. The M14a motif, proposed by Tavazoie et al. (1999) as novel, and the MCB motif are both overrepresented in cluster 14. M14a is very similar to the reverse complement of the MCB motif but allows more variability in the central ACGCG segment than the MCB motif. However, apart from one more variable position in the MCB motif, the most common elements are the same in both motifs over the 10 positions centered on the CGCG. Many of the genes in cluster 14 that match the MCB motif also match the M14a motif, implying that the motifs may be related.
Refinement of Motifs
When the method described here shows that the genes, whose upstream regions match a motif, are only marginally overrepresented in a particular cluster, it may be possible to refine the motif description. Any refinements to the motif can then be evaluated in the same way as the original motif. The DNA-binding motif of the MCM1 protein (the MCM1 motif) taken from the S. cerevisia promoter database (SCPD; Zhu and Zhang 1999) gave a minimal P value of 4.4 × 10⁻⁷ in cluster 7 for a sample size of 600 (Fig. 2, column A). Both this relatively high minimal P value and the observation that the lower P values occur in the larger sample sizes indicate that this motif description is poor, if it is actually involved in the regulation of genes in cluster 7. If the motif can be refined to detect a greater number of matches in a cluster, then it is more likely that this is a functional motif with respect to the cluster. A failure to improve the motif would argue against it being functional. To attempt to refine the MCM1 motif, its matches in cluster 7 and their surrounding sequences were submitted to the Yebis program (Yada et al. 1998) to determine new motifs. One of the resulting motifs detected more matches in cluster 7 than the original motif (Fig. 2, column B).
Figure 2.

Refinement of the MCM1 motif from the matches to it in cluster 7. The log of the probability of observing at least the number of matches to the original MCM1 motif from the SCPD (Zhu and Zhang 1999) is in column A. The other columns are the secondary MCM1 motif after the first refinement (B), the short (C) and long (D) motifs made from the best matches to the first refined motif, and two ECB motifs, one from the SCPD (E) and the other from Tavazoie et al. (1999; F). The sample size symbols are as in Fig. 1.
However, this motif was derived from only 13 sequences, so additional motifs were constructed by aligning the sequences in cluster 7 that matched this motif. This was done for both the original motif size and for 7 bp on either side of the motif to assess the effect of a larger context. Motifs constructed from the matches to cluster 7, in the samples of 50, 100, 200, 400, and 600 genes, were examined. It was found that motifs from the smaller sample sizes performed relatively poorly but after a sample size of 200, there was no improvement or a slight deterioration. For the smaller sample sizes, there appeared to be too little data to define a motif and the extra, weaker matches from the larger samples did not provide significant new information. The performance of the short and long motifs calculated from the 200-member sample is shown in Figure 2 (columns C and D). In this case, the longer motif performs better, and this motif is very similar to the early cell-cycle box (ECB) motif (McInerny et al. 1997), which contains an MCM1 protein binding site and flanking palindromic sequences. The performance of two ECB motifs is given in Figure 2 (columns E and F), and the consensus sequences of the MCM1 and ECB motifs are in Table 1. Although the motif refinement demonstrated here resulted in a known motif description, this technique shows that it is possible to take a motif description that performs poorly in a cluster and refine it to give a motif that is more likely to represent a biological function.
Table 1.
MCM1 Motif Refinement
| Motif | Consensus sequence | |||||||||||||||||||
|---|---|---|---|---|---|---|---|---|---|---|---|---|---|---|---|---|---|---|---|---|
| MCM1-initiala | C | C | C | N | A | W | W | A | G | G | ||||||||||
| MCM1-secondary | W | C | C | N | N | W | T | T | A | G | G | M | A | M | ||||||
| MCM1-short | W | C | C | Y | N | W | T | T | A | G | G | A | A | A | ||||||
| MCM1-long | W | T | W | W | C | C | Y | N | W | T | T | A | G | G | A | A | A | W | N | |
| ECB-SCPDa | T | T | W | C | C | C | N | W | T | T | A | G | G | A | A | A | ||||
| ECB-Tb | W | T | T | W | C | C | Y | Y | W | T | T | N | G | G | N | W | A | WW | ||
Weight matrix consensus sequences in IUPAC codes. The MCM1-long and ECB-T motifs have several, mostly variable, extra elements.
From SCPD (Zhu and Zhang 1999).
Tavazoie et al. (1999) and this work.
Evaluating Different Descriptions of a Motif
Several motifs that were created or tested as part of this work were specific to cluster 1 of the primary set. These were generally versions of the repressor-activator protein (Rap1) DNA-binding motif, and examining motifs and clusters as described here allows each motif to detect matches in a cluster and the differences between them to be evaluated. Two versions of the Rap1 motif, one taken from the SCPD (Zhu and Zhang 1999) and the other from a recent study of the promoter regions of ribosomal genes (Lascaris et al. 1999), were considered in detail. The motifs are depicted in Figure 3A, showing the frequency of the nucleotides and the major components together with a measure of the information at each position (Smith and Xue 1998). Both motifs are strongly associated with cluster 1, with the Lascaris motif being more effective (Fig. 3B, column I) than the SCPD motif (Fig. 3B, column A). In the largest sample size (600), 65 genes from cluster 1 were identified by the Lascaris motif and 54 by the SCPD one. However, the much lower P values associated with the Lascaris motif are because of its matching the upstream regions of more genes from cluster 1 in the smaller sample sizes. To assess what caused this difference, several positions in the SCPD motif (Fig. 3A) that differed from the Lascaris motif were altered to be more like the Lascaris motif. Two of the positions that were altered in the SCPD motif are less variable (4 and 7), while the others are more variable than those of the Lascaris motif. No single position caused a major difference in the ability of the motif to detect matches in cluster 1, and one position (10 in Fig. 3B) did not contribute to the different performance of the motifs. It was a combination of changes that gave the most improvement (Fig. 3B).
Figure 3.

(A) Description of two versions of the Rap1 motif using the method of Smith and Xue (1998). The SCPD (Zhu and Zhang 1999; from 16 sequences) and Lascaris et al. (1999; from 129 sequences) versions of the motif are on the left and right, respectively. The top histograms show the frequency of the nucleotides (as percentages) at each position (T, white; C, light gray; A, dark gray; G, black). The nucleotides which occur in at least 10% of sequences are listed from most (top) to least frequent in the middle section, and the information content (Shannon 1948; Schneider and Stephens 1990) to a maximum of two bits at the position is given in the lower histograms. Information = log2(4) + Σ(fi × log2[fi]), where the sum is over the four nucleotides and fi (≠0) is the frequency of the ith nucleotide. Equivalent motif positions are numbered the same, so the two extra positions in the Lascaris motif are numbered 0 and 13. (B) Evaluation of the alterations to the SCPD motif to make it more like the Lascaris motif. In the plot the columns give the log of the probabilities of observing at least the number of genes from a sample in cluster 1 for: the SCPD matrix (A); changes at position 4 (B); position 7 (C); position 8 (D); positions 4 + 7 (E); positions 7 + 8 (F); positions 4 + 7 + 8 (G); positions 4 + 7 + 8 + 11 + 12 (H); and the Lascaris motif (I). The sample size symbols are as in Fig. 1.
Cross-Cluster Motif Refinement
A search for motifs in the upstream region of genes that have an expression pattern similar to that of the transcription factor gene ACE2 resulted in a motif that is similar to the Swi Five Factor (SFF) binding sequence (Lydall et al. 1991; Althoefer et al. 1995). Although the functional significance of the SFF binding sequence has been demonstrated (Lydall et al. 1991; Althoefer et al. 1995), the SFF gene has not yet been identified. The SFF binding sequence has been implicated, along with MCM1p, in regulating the expression of SWI5, CLB1, and CLB2 (Althoefer et al. 1995), which occur in clusters 4 (SWI5) and 7 (CLB1 and CLB2) of the primary cluster set as determined by Tavazoie et al. (1999). However, visual inspection suggests that SWI5 is more likely to be a member of cluster 7 and may have been misclustered. In the α-factor synchronized experiment (Spellman et al. 1998), the expression profile of SWI5 is clearly typical of cluster 7. Spellman et al. (1998) also suggested that the SFF motif was involved in the regulation of two of their clusters of genes. As shown in Figure 4A, genes that match the initial SFF motif (SFF-I) in their upstream regions are overrepresented in clusters 7, 11, and 14 of the primary set. In all three cases, and particularly in cluster 11, this association is relatively weak. Clusters 7, 11, and 14 all have periodic mean profiles of expression but are not synchronous (Fig. 5). It could be that the SFF motif is functionally relevant in the three clusters and associates with different partners to give rise to the different expression patterns. If clusters 7, 11, and 14 are considered as one group, then genes matching the SFF motif in their upstream regions are substantially overrepresented in the combined cluster (Fig. 4A).
Figure 4.

(A) Probability plot of observing at least the numbers of genes from a sample of genes with upstream regions that match the initial (SFF-I) and final (SFF-F) SFF-like motifs and the M14b motif in clusters 7, 11, and 14 and the combination of the three clusters. The sample size symbols are as in Fig. 1. (B) The SFF-F motif (left, from 92 sequences) and the M14b motif (right, from 76 sequences) in the format described in Fig. 3. The M14b motif is taken from the same strand as the SFF-F motif.
Figure 5.
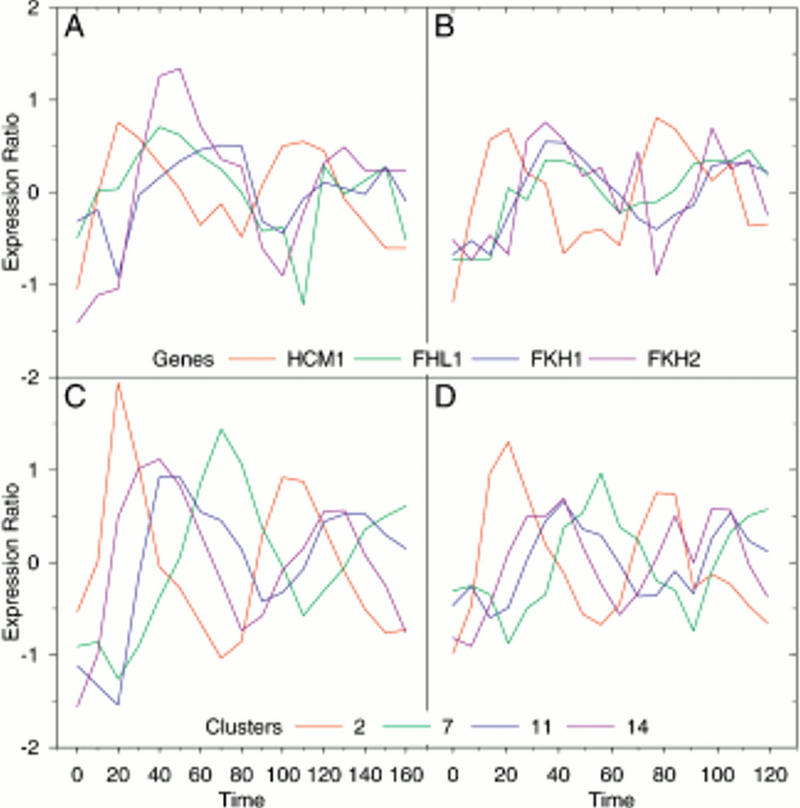
Expression profiles of the yeast forkhead genes, HCM1, FHL1, FKH1, and FKH2, in the cdc28 synchronized (A) and α-factor synchronized (B) experiments and the mean expression profiles of clusters 2, 7, 11, and 14 in the cdc28 (C) and α-factor (D) synchronized experiments. The data were taken from the website of Spellman et al. (1998).
A refined SFF motif was constructed by using the Yebis program (Yada et al. 1998) to produce a second motif from regions around the matches to the original motif in all three clusters in both the primary and secondary sets. This motif was a substantial improvement over the original. The matches to the motif from several sample sizes were aligned, and new motifs were constructed from these alignments, as described above. In this case, the final motif (SFF-F; Fig. 4B) was taken from the sample of 400 matches. Figure 4A gives the probabilities of observing at least the number of genes from the samples of matches to this motif that were in the three clusters. The SFF-F motif has considerable similarity to the reverse complement of the M14b motif (Fig. 4B; Tavazoie et al. 1999), which is only specific for cluster 14 when evaluated by the method used here (Fig. 4A). This difference in cluster specificity for the motifs and the observation that some of the most common elements of the two motifs are different suggest that they may not be versions of the same motif but, instead, could be motifs associated with very similar proteins.
Forkhead or Winged Helix Proteins
The upstream regions of the genes from the S. cerevisiae genome were also searched with motifs from version 3.4 of the Transfac database (Wingender et al. 2000). Matches to the motifs were not generally overrepresented in the clusters being investigated, which might be expected as most of them are from vertebrates. It was noted, however, that motifs corresponding to rat forkhead proteins gave weak patterns of matched genes, similar to those from the SFF-F motif. Forkhead or winged helix proteins are transcription factors, similar to the Drosophila homeotic gene forkhead, that bind DNA through a helix–turn–helix motif that is flanked by two loops or wings (Gajiwala and Burley 2000). A closer examination of motifs for forkhead proteins from human (Pierrou et al. 1994; Overdier et al. 1997), rodent (Overdier et al. 1994; Peterson et al. 1997), Xenopus (Kaufmann et al. 1995), and Drosophila (Häcker et al. 1995) revealed consensus sequences strikingly similar to those of the SFF-F and M14b motifs (Table 2). It seems likely, therefore, that the SFF-F and M14b motifs are forkhead transcription factor motifs. By sequence similarity, four proteins in the yeast genome have been identified as forkhead transcription factors (Costanzo et al. 2000). The expression profiles of these genes (FKH1, FKH2, FHL1, and HCM1) are shown in Fig. 5A,B for the cdc28– (Cho et al. 1998) and α-factor-synchronized (Spellman et al. 1998) experiments, respectively. The mean profiles for clusters 2, 7, 11, and 14 in both experiments are shown in Figure 5C,D. All the forkhead genes show periodic and variable expression patterns that are consistent with their being involved in cell cycle regulatory processes. HCM1 has an expression profile typical of cluster 2, while the profiles of the remaining genes are more typical of clusters 11 or 14. This difference between HCM1 and the other forkhead genes may correspond to the difference between the SFF-F and M14b motifs.
Table 2.
Forkhead Transcription Factor DNA-Binding Motifs
| Protein | Organism | Consensus sequence | |||||||||||||||||
|---|---|---|---|---|---|---|---|---|---|---|---|---|---|---|---|---|---|---|---|
| Freac-2 | Human | N | N | A | N | N | G | T | A | A | A | C | A | A | N | N | N | ||
| Freac-3 | Human | N | N | N | N | N | G | T | A | A | A | T | A | A | A | C | A | ||
| Freac-4 | Human | C | Y | W | A | W | G | T | A | A | A | C | A | N | W | G | N | ||
| Freac-6 | Human | T | A | A | A | Y | A | A | A | Y | A | N | N | M | |||||
| Freac-7 | Human | W | N | N | A | N | A | T | A | A | A | Y | A | N | N | N | N | ||
| HFH-8 | Mouse | Y | R | N | A | T | A | A | A | C | A | N | N | N | |||||
| HFH-1 | Rat | A | W | A | T | A | A | A | C | A | W | T | N | ||||||
| HFH-2 | Rat | A | A | A | Y | A | A | A | C | A | W | T | N | ||||||
| HNF-3β | Rat | W | A | A | R | Y | A | A | A | Y | A | N | T | N | C | M | |||
| XFD-1 | Xenopus laevis | Y | A | W | G | T | A | A | A | Y | A | W | W | R | Y | ||||
| XFD-2 | X. lae. | W | N | W | A | T | A | A | A | C | A | W | N | N | R | ||||
| XFD-3 | X. lae. | W | N | W | G | T | M | A | A | C | A | W | W | M | W | ||||
| Croc | Drosophila melanogaster | W | A | N | A | R | T | A | A | A | T | A | T | N | N | N | N | ||
| HCM1pa | Yeast | W | A | A | Y | A | A | A | C | A | A | W | |||||||
| ECB-SFFb | Yeast | A | A | W | W | N | R | T | A | A | A | Y | A | A | A | ||||
| SFF-LIKEc | Yeast | W | A | W | W | N | R | T | A | A | A | C | A | A | N | ||||
| M14bd | Yeast | W | N | W | A | A | A | H | A | A | A | C | A | M | W | ||||
Note. Weight matrix consensus sequences (IUPAC codes) taken from Transfac (Wingender et al. 2000) unless noted otherwise. References for the motifs taken from Transfac are given in the text.
This work.
DISCUSSION
We have developed a method that evaluates the potential functional significance of both clusters of genes and motifs describing possible regulatory elements. Several differently sized samples of genes are taken on the basis of the best scoring matches to a motif in the upstream regions of all the clustered genes. For each sample, the genes are counted by the cluster in which they occur. Whether, for a given motif, the distribution of the genes in a sample is random with respect to the clustering can be determined by the hypergeometric distribution. The probability of observing by chance at least the number of genes from a sample that are in a cluster is dependent on both the number of genes from a sample in the cluster and the sample size as well as the sizes of the cluster and overall population. Increasing the number of genes from a sample in a cluster by using a larger sample size will not in itself decrease the probability of observing that number of genes by chance. As it is not likely that all, or even most, of the genes in one cluster are under the control of the same regulatory protein, it would not normally be expected to find all, or most, of the genes in a cluster having upstream regions that match a motif. Even when the number of genes from a sample that fall in a cluster is relatively small, this method can detect that they may be overrepresented. For example, with a population of 3000 genes, a cluster size of 150 genes, and a sample size of 200, the probability is ∼10−4 that there will be 23 or more genes from the sample found in the cluster by chance.
The use of several sample sizes allows an impression of the type of matches being observed to be gained. A motif that is strongly associated with a cluster will tend to be highly overrepresented in the smaller sample sizes, while motifs that are not so well matched to the upstream regions of the genes in the cluster will generally be overrepresented only in the larger sample sizes. Although this technique is better suited to situations where relatively larger numbers of genes are controlled by one factor, small sample sizes may be able to detect cases where a factor regulates only a few genes. Motifs that are not relevant to the conditions of the experiment or the cluster set or that simply represent ubiquitous patterns because of biases in the sequence composition will normally only show the numbers of matched genes in a cluster that would be expected by chance. A biologically relevant motif that is involved in several functions, depending, for example, on its promoter, sequence, or chromatin context, may not be detected by this method, as the expression profiles of the associated genes are likely to be different and not clustered together. However, examining all the clusters in an experimental set may allow functional associations of genes to be detected across the divisions imposed by the clusters. This is particularly helped by using a range of sample sizes to detect weaker associations that would be overlooked if only one relatively small sample or a threshold value was used. A weak association of a motif with a cluster in this method might be a chance occurrence, be caused by a poor motif description, or be a functional motif that associates with only a small number of genes in a cluster. As discussed below, a weak match can be investigated further.
Many of the problems associated with trying to match motifs to gene clusters and assess the effectiveness of clusters are avoided by the approach described here. If a cutoff for a match score is used (e.g., Tavazoie et al. 1999), then only a relatively few instances of motifs may be examined. It is also quite unclear as to what an appropriate cutoff value should be, given the difficulty of distinguishing functional matches from chance ones (Bucher 1999). Recently, Hughes et al. (2000) used a related method whereby the hypergeometric distribution provided a quality score for a motif in functionally classified clusters with a sample size of 100 and a stringent significance cutoff. The approach we have used—taking multiple sample sizes and comparing across all the clusters in an analysis set—gives several other advantages. Less well defined motifs, or motifs that are present in genes not tightly clustered with respect to the experimental conditions and/or the clustering algorithm used, can be detected. An impression of the quality of the clustering can be gained by detecting a motif in several clusters or by finding several motifs somewhat weakly represented in one cluster. From this, the issue of over- or underclustering can be addressed. The validity of strategies for removing genes from consideration before the clustering analysis can also be assessed.
The main attributes of the method developed here are illustrated by the examination of the MCB motif (Fig. 1), which, along with the Swi4/6 related cell cycle box (SCB) motif, is involved in regulating the expression of DNA synthesis and repair genes during the cell cycle (McIntosh 1993). A very strong overrepresentation of genes with upstream regions matching the MCB motif was revealed in one cluster of the primary set and a considerable, though lower, overrepresentation was revealed in two other clusters. A similar pattern was seen in the secondary cluster set, showing that many more genes may be regulated through the MCB motif. This indicates that the filtering technique of rejecting approximately half of the ORFs (Tavazoie et al. 1999) is too restrictive and may need to be reassessed. Heyer et al. (1999) applied a much less stringent filter, retaining almost 50% more ORFs, in their clustering of the same data set. If several clusters show an overrepresentation of matches to a motif, then the question of whether these clusters are really different can be raised. The very strong similarity in expression profiles and the similarity of functions in clusters 2 and 23 suggest that this may be a case of overclustering. Indeed, Tavazoie et al. (1999) state that they erred on the side of overclustering when determining their cluster set.
Our cross-cluster approach led us to consider other motifs that were found to be overrepresented in these three clusters. Motif M14a, which was identified as novel by Tavazoie et al. (1999), is considerably overrepresented in the upstream regions of the genes of cluster 14. However, its reverse complement is highly similar to the MCB motif, which raises doubts as to whether M14a is a unique motif. The MCB motif, which is bound by MBP1p, is also similar to the SCB motif, which is bound by SWI4p (McIntosh 1993). These two proteins have related DNA binding domains, and each can bind the motif normally associated with the other (Taylor et al. 2000). It might be expected, if M14a represented a novel motif and was a third member of the MCB/SCB group, that there would be another yeast protein containing a similar DNA-binding domain. However, no other protein in yeast appears to contain a DNA-binding domain similar to those of MBP1p and SWI4p (Corpet et al. 2000), and the MCB motif also recognizes many of the genes that match M14a in cluster 14. This suggests that M14a is not a novel motif but a variant of the MCB motif. Its higher variability in the central region of the motif and the relatively poor recognition of genes in cluster 2 may reflect the small sequence set (cluster 14 has 73 members) from which it was derived. MCB motifs and similar, but unrelated, sequences may have been combined to form this motif. Gene clusters make a significant advance in the computational determination of regulatory elements (Bucher 1999) by reducing the size of the segment of the genome that needs to be searched to create a motif. However, the small size of some clusters may still present a problem in obtaining enough information to reliably define a motif.
Many motifs that are determined from biological studies or by motif searching programs are likely to be based on a small number of sequences. Therefore, it is quite likely that these motifs will only approximate the functional motif that they represent and might be expected to show only weak matches to gene clusters such as those considered here. By using several relatively large sample sizes, the method we have proposed can detect these matches and also provide a means to refine and then evaluate the refined motif. This was demonstrated for the MCM1 motif, where a two-stage refinement process led to a motif that performed much more efficiently than the original motif, based on 17 sequences, that was taken from the SCPD (Zhu and Zhang 1999). In this case, it transpired that the final motif derived by the refinement method (Fig. 2; Table 1) was very similar to the ECB motif (McInerny et al. 1997).
Evaluating motifs that are different descriptions of the same transcription-factor binding site will become increasingly important as more and more motifs are derived. Two versions of the RAP1 motif, one based on 16 sequences from the SCPD (Zhu and Zhang 1999) and one based on 129 sequences from the study of Lascaris et al. (1999), have been investigated by the method proposed here. Altering positions in the less effective SCPD motif to be more like the Lascaris motif showed that a combination of changes was most effective. Generally, the performance of the modified motifs improved as more positions were altered. This indicates that the performance of a motif is often affected by relationships between positions. Quantifying these correlations, if possible, may provide a more reliable means to detect functional transcription-factor binding sites.
Motifs that are overrepresented and possibly functionally relevant in the genes of many clusters can be detected with our approach. A motif similar to the motif associated with the currently unidentified protein factor called SFF (Althoefer et al. 1995) was identified, refined, and found to be weakly associated with clusters 7, 11, and 14 but more strongly associated with the group of these three clusters. This motif is highly similar to the reverse complement of motif M14b (Tavazoie et al. 1999), which is strongly associated with cluster 14, but not clusters 7 or 11 or with the group of three clusters. After noting that a rat forkhead protein motif gave a pattern of matches similar to that of the SFF-F motif, other forkhead protein DNA-binding motifs and consensus sequences were examined (Table 2). From this it can be seen that the SFF and M14b motifs are typical of forkhead protein DNA-binding motifs. Positions 5, 6, and 7 of the SFF-F and M14b motifs (Fig. 4B) are the most different between the two, and these differences appear to reflect two groupings of forkhead DNA-binding motifs. While most forkhead protein DNA-binding motifs (Table 2) are more similar to the SFF-like motif (position 5: no clear preference, 6: G and/or A, 7: T), some are closer to the M14b motif (position 5: A, 6: A and not G, 7: no strong preference). Because of the different behavior of the SFF-F and M14b motifs with respect to the clusters (Fig. 4A) and the variability in forkhead protein DNA-binding motifs, we suggest that these motifs are distinct and that SFF and the M14b binding protein are forkhead proteins of which there are four, FKH1p, FKH2p, FHL1p, and HCM1p, in yeast.
HCM1 differs from the other forkhead genes in several respects. In both the cdc28 and α-factor synchronized experiments (Fig. 5A,B) its expression profile reaches a peak much earlier in the cell cycle than the other genes. In the α-factor experiment (Fig. 5B), its profile is nearly antiphase to those of the others. The domain structure of HCM1p, given in the ProDom database (Corpet et al. 2000), is different from the other forkhead proteins, and it lies in a separate subgroup in the ProDom phylogenetic tree of forkhead domains. Only HCM1p of the yeast forkhead proteins does not have a forkhead associated (FHA) domain (Hofmann and Bucher 1995). A binding motif for HCM1p has been determined (Table 2; Zhu and Davis 1998) that is more compatible with the M14b motif than the SFF-F motif. HCM1p regulates SPC110/NUF1 (Zhu and Davis 1998), which has an expression profile typical of cluster 14. Of the yeast forkhead genes, only HCM1 is expressed following the pattern of cluster 2 and temporally before cluster 14. SPC110/NUF1 also has an MCB motif in close proximity to the HCM1 motif (Zhu and Davis 1998). MCB motifs were also found to be overrepresented in cluster 14 (Fig. 1). Given these associations, HCM1p seems to be the most likely candidate for the M14b binding protein.
The SFF binding sequence has been shown to be associated with the MCM1 or ECB motifs (Lydall et al. 1991; Althoefer et al. 1995; Spellman et al. 1998), and these motifs are overrepresented in cluster 7 (Fig. 2). We suggest that Swi Five Factor (SFF) is one of the remaining forkhead proteins of yeast. From the expression and motif data, it is difficult to select one protein over the others, and it may be that SFF is not a single protein. One or more of these forkhead proteins may act with MCM1p or other factors in different situations. FHL1p has been shown to be involved in rRNA processing (Hermann-Le Denmat et al. 1994), but little appears to be known about the functions of FKH1p and FKH2p. Given the similarity of the forkhead protein binding motifs, it might be expected that one of the other forkhead proteins may be able to replace the function of another to some extent. Indeed, an HCM1 deletion mutant did not abolish SPC110/NUF1 transcription (Zhu and Davis 1998).
In summary, we have developed a method for assessing the effectiveness of the division of sets of genes into clusters and the potential functional significance of sequence motifs that might represent regulatory elements of genes. This method is independent of the particular techniques used to cluster genes, determine motifs, or match motifs to sequences. By using a variety of sample sizes and comparing across all clusters, it is possible to detect both strong and weak motif descriptions and assess over- and underclustering. An evaluation of the gene-filtering step before clustering can also be performed. Another advantage of this approach is the ability to create and assess motifs that are refinements of poorly performing motifs. As the evaluation of motifs in this way can be readily automated, we were able to screen a large number of motifs, which led us to detect a similarity between the SFF motif and forkhead protein DNA-binding sites. From this, we suggest that the previously unidentified Swi Five Factor is one of the yeast forkhead proteins and that it may be involved in more regulatory processes than thought previously.
METHODS
Expression data for the cdc28-based synchronized cell cycle study of Cho et al. (1998) were taken from the Web site (http://cellcycle-www.stanford.edu) of Spellman et al. (1998). These data, rather than the original set (Cho et al. 1998), were used to allow comparisons to the other cell cycle data (Spellman et al. 1998). The assignment of genes to clusters for the primary cluster set was taken from the web site of Tavazoie et al. (1999) (http://arep.med.harvard.edu/network_discovery). Tavazoie et al. (1999) used a k-means (k = 30 for this case) algorithm to group or cluster genes with similar (based on the Euclidean distance between them) expression profiles over the cell cycle. Although it was claimed that 3000 genes were arranged in 30 clusters, only 2945 entries were in the table on the web site. Of those entries, only 2803 had unique names. The 2803 uniquely identified genes were assigned to the clusters nominated by Tavazoie et al. (1999). A mean profile for each cluster was calculated by taking the average over the genes in the cluster of the normalized (to zero mean and unit variance) expression data (Spellman et al. 1998) for each time point. Mean profiles were also calculated from the α-factor-synchronized expression data (Spellman et al. 1998), using the same assignment of genes to clusters. A secondary cluster set was made from the genes filtered out by Tavazoie et al. (1999) and the genes that were not uniquely identified. In the secondary cluster set, the 3344 remaining genes, for which expression and sequence data were available, were assigned to one of the 30 clusters on the basis of the minimum of their Euclidean distances from the mean profiles of the primary cluster set. These secondary set clusters mirror the clusters in the primary set as far as possible but will also contain genes with very low or nearly invariant expression levels.
Almost 700 motifs were taken from the SCPD (http://cgsigma.cshl.org/jian/; Zhu and Zhang 1999), from Transfac (Wingender et al. 2000), from the definitions on the Tavazoie et al. (1999) Web site, and from searches for motifs using the Yebis program (http://www-scc.tokyo.jst.go.jp/YEBIS/; Yada et al. 1998) on various groupings of the upstream regions of genes taken from the SCPD (Zhu and Zhang 1999). As Tavazoie et al. presented their motifs as sequence logos (Schneider and Stephens 1990) from which it is not possible to accurately reconstruct the positional base frequencies, motifs had to be reconstructed from the matching sequences given on their Web site. However, the matches they presented were from both strands of the DNA and were not always of equal length. Consequently, both orientations were taken for each match and aligned, using ClustalW (Thompson et al. 1994) to get a match set in one orientation, and then MatInd (Quandt et al. 1995) was used to construct the motif. There may be slight differences between our versions of these motifs and those of Tavazoie et al. (1999).
Scanning for matches to the motifs was performed in the 600-bp region upstream of the ATG translation start site, as defined by the SCPD (Zhu and Zhang 1999), for each gene. The program PatSer 3b (Hertz et al. 1990; Hertz and Stormo 1999) was used to perform the matching. An (A,T):(G,C) ratio of 0.62:0.38, taken from a count of nucleotides in the region within −1000 to +50 of the ATG translation start site for all genes, was used. Matches were ranked on the basis of the best score to the motif from either strand of the upstream region of each gene. The top-ranking 50, 100, 150, 200, 250, 300, 400, 500, and 600 genes were treated as separate samples. For each cluster, the number of genes from each sample that belonged to the cluster was counted. This was done separately for both the primary and secondary cluster sets. The probability of observing at least x genes within a cluster of size k from a sample of size m (nine sizes, as given above, were used) taken from a population of size N (in this case, either 2803 for the primary cluster set or 3344 for the secondary cluster set) can be calculated using the hypergeometric distribution (Eq. [1]).
 |
1 |
To assess whether to investigate a motif further for biological relevance, a probability value of 10−4 was used as a guide for visual inspection of the matches. As each motif was evaluated 30 times (the number of clusters) for the nine related sample sizes, this is an approximate application of the conservative Bonferroni correction for repeated sampling at a P value of 0.01. When refining a motif, the original matches to the motif from the cluster in which they were overrepresented, together with 40 bp on either side of the match, were submitted to the Yebis program (http://www-scc.tokyo.jst.go.jp/YEBIS/; Yada et al. 1998) to detect new motifs. Any new motifs that were detected were then evaluated as described above. If a new motif gave a greater number of matches in the cluster, further-refined motifs were constructed from alignments of the matches to the motif in the cluster for each of the various sample sizes. The most effective of these was then taken as the final refined motif. Persons interested in the data and programs discussed here should contact D.K.S. or visit the web page http://www.hku.hk/bruhk/clusters.html.
Acknowledgments
This work was supported in part by grants from the University of Hong Kong Vice Chancellor's Development Fund (L.C. and K.C.) and the Research Grants Council of Hong Kong (D.K.S.). We thank B.C.W. Wong for helpful discussions and A. Danchin for a critical review of the manuscript.
The publication costs of this article were defrayed in part by payment of page charges. This article must therefore be hereby marked “advertisement” in accordance with 18 USC section 1734 solely to indicate this fact.
Note Added in Proof
After this work was submitted for publication, several groups have reported that the yeast forkhead proteins FKH1p and FKH2p are part of Swi Five Factor (Koranda et al. 2000; Kumar et al. 2000; Pic et al. 2000; Zhu et al. 2000).
Footnotes
E-MAIL dsmith@hkusua.hku.hk; FAX 852-2855-1254.
Article and publication are at www.genome.org/cgi/doi/10.1101/gr.148301.
REFERENCES
- Althoefer H, Schleiffer A, Wassmann K, Nordheim A, Ammerer G. Mcm1 is required to coordinate G2-specific transcription in Saccharomyces cerevisiae. Mol Cell Biol. 1995;15:5917–5928. doi: 10.1128/mcb.15.11.5917. [DOI] [PMC free article] [PubMed] [Google Scholar]
- Ben-Dor M, Shamir R, Yakhini Z. Clustering gene expression patterns. J Comp Biol. 1999;6:281–297. doi: 10.1089/106652799318274. [DOI] [PubMed] [Google Scholar]
- Bittner M, Meltzer P, Trent J. Data analysis and integration: Of steps and arrows. Nat Genet. 1999;22:213–215. doi: 10.1038/10265. [DOI] [PubMed] [Google Scholar]
- Bowtel DDL. Options available—from start to finish—for obtaining expression data by microarray. Nat Genet. 1999;21(Suppl.):25–32. doi: 10.1038/4455. [DOI] [PubMed] [Google Scholar]
- Brown MPS, Grundy WN, Lin D, Cristianini N, Sugnet CW, Furey TS, Ares M, Haussler D. Knowledge-based analysis of microarray gene expression data by using support vector machines. Proc Natl Acad Sci. 2000;97:262–267. doi: 10.1073/pnas.97.1.262. [DOI] [PMC free article] [PubMed] [Google Scholar]
- Bucher P. Regulatory elements and expression profiles. Curr Opin Struct Biol. 1999;9:400–407. doi: 10.1016/S0959-440X(99)80054-2. [DOI] [PubMed] [Google Scholar]
- Carulli JP, Artinger M, Swain PM, Root CD, Chee L, Tulig C, Guerin J, Osborne M, Stein G, Lian J, Lomedico PT. High throughput analysis of differential gene expression. J Cell Biochem. 1998;30–31(Suppl):286–296. [PubMed] [Google Scholar]
- Cho RJ, Campbell MJ, Winzeler EA, Steinmetz L, Conway A, Wodicka L, Wolfsberg TG, Gabriellan AE, Landsman D, Lockhart DJ, Davis RW. A genome-wide transcriptional analysis of the mitotic cell cycle. Mol Cell. 1998;2:65–73. doi: 10.1016/s1097-2765(00)80114-8. [DOI] [PubMed] [Google Scholar]
- Chu S, DeRisi J, Eisen M, Mulholland J, Botstein D, Brown PO, Herskowitz I. The transcriptional program of sporulation in budding yeast. Science. 1998;282:699–705. doi: 10.1126/science.282.5389.699. [DOI] [PubMed] [Google Scholar]
- Corpet F, Servant F, Gouzy J, Kahn D. ProDom and ProDom-CG: Tools for protein domain analysis and whole genome comparisons. Nucleic Acids Res. 2000;28:267–269. doi: 10.1093/nar/28.1.267. [DOI] [PMC free article] [PubMed] [Google Scholar]
- Costanzo MC, Hogan JD, Cusick ME, Davis BP, Fancher AM, Hodges PE, Kondu P, Lengieza C, Lew-Smith JE, Lingner C, et al. The yeast proteome database (YPD) and Caenorhabditis elegans proteome database (WormPD): Comprehensive resources for the organization and comparison of model organism protein information. Nucleic Acids Res. 2000;28:73–76. doi: 10.1093/nar/28.1.73. [DOI] [PMC free article] [PubMed] [Google Scholar]
- DeRisi JL, Iyer VI, Brown PO. Exploring the metabolic and genetic control of gene expression on a genomic scale. Science. 1997;278:680–686. doi: 10.1126/science.278.5338.680. [DOI] [PubMed] [Google Scholar]
- Eisen MB, Spellman PT, Brown PO, Botstein D. Cluster analysis and display of genome-wide expression patterns. Proc Natl Acad Sci. 1998;95:14863–14868. doi: 10.1073/pnas.95.25.14863. [DOI] [PMC free article] [PubMed] [Google Scholar]
- Fickett JW, Hatzigeorgiou AG. Eukaryotic promoter recognition. Genome Res. 1997;7:861–878. doi: 10.1101/gr.7.9.861. [DOI] [PubMed] [Google Scholar]
- Frech K, Quandt K, Werner T. Software for the analysis of DNA sequence elements of transcription. Comput Appl Biosci. 1997;13:89–97. doi: 10.1093/bioinformatics/13.1.89. [DOI] [PubMed] [Google Scholar]
- Gaasterland T, Bekiranov S. Making the most of microarray data. Nat Genet. 2000;24:204–206. doi: 10.1038/73392. [DOI] [PubMed] [Google Scholar]
- Gajiwala KS, Burley SK. Winged helix proteins. Curr Opin Struct Biol. 2000;10:110–116. doi: 10.1016/s0959-440x(99)00057-3. [DOI] [PubMed] [Google Scholar]
- Häcker U, Kaufmann E, Hartmannn C, Jürgens G, Knöchel W, Jäckle H. The Drosohphila forkhead domain protein crocodile is required for the establishment of head structures. EMBO J. 1995;14:5306–5317. doi: 10.1002/j.1460-2075.1995.tb00215.x. [DOI] [PMC free article] [PubMed] [Google Scholar]
- Hermann-Le Denmat S, Werner M, Sentenac A, Thuraix P. Suppression of yeast RNA polymerase III mutations by FHL1, a gene coding for a forkhead protein involved in rRNA processing. Mol Cell Biol. 1994;14:2905–2913. doi: 10.1128/mcb.14.5.2905. [DOI] [PMC free article] [PubMed] [Google Scholar]
- Hertz GZ, Stormo GD. Identifying DNA and protein patterns with statistically significant alignments of multiple sequences. Bioinformatics. 1999;15:563–577. doi: 10.1093/bioinformatics/15.7.563. [DOI] [PubMed] [Google Scholar]
- Hertz GZ, Hartzell GW, Stormo GD. Identification of consensus patterns in unaligned DNA sequences known to be functionally related. Comput Appl Biosci. 1990;6:81–92. doi: 10.1093/bioinformatics/6.2.81. [DOI] [PubMed] [Google Scholar]
- Heyer LJ, Kruglyak S, Yooseph S. Exploring expression data: Identification and analysis of coexpressed genes. Genome Res. 1999;9:1106–1115. doi: 10.1101/gr.9.11.1106. [DOI] [PMC free article] [PubMed] [Google Scholar]
- Hofmann K, Bucher P. The FHA domain: A putative signalling domain found in protein kinases and transcription factors. Trends Biochem Sci. 1995;20:347–349. doi: 10.1016/s0968-0004(00)89072-6. [DOI] [PubMed] [Google Scholar]
- Hughes JD, Estep PW, Tavazoie S, Church GM. Computational identification of cis-regulatory elements associated with groups of functionally related genes in Saccharomyces cerevisiae. J Mol Biol. 2000;296:1205–1214. doi: 10.1006/jmbi.2000.3519. [DOI] [PubMed] [Google Scholar]
- Kaufmann E, Muller D, Knochel W. DNA recognition site analysis of Xenopus winged helix proteins. J Mol Biol. 1995;248:239–254. doi: 10.1016/s0022-2836(95)80047-6. [DOI] [PubMed] [Google Scholar]
- Koranda M, Schleiffer A, Endler L, Ammerer G. Forkhead-like transcription factors recruit Ndd1 to the chromatin of G2/M-specific promoters. Nature. 2000;406:94–98. doi: 10.1038/35017589. [DOI] [PubMed] [Google Scholar]
- Kumar R, Reynolds DM, Shevchenko A, Shevchenko A, Goldstone SD, Dalton S. Forkhead transcription factors, Fkh1p and Fkh2p, collaborate with Mcm1p to control transcription required for M-phase. Curr Biol. 2000;10:896–906. doi: 10.1016/s0960-9822(00)00618-7. [DOI] [PubMed] [Google Scholar]
- Lascaris RF, Mager WH, Planta RJ. DNA-binding requirements of the yeast protein Rap1p as selected in silico from ribosomal protein gene promoter sequences. Bioinformatics. 1999;15:267–277. doi: 10.1093/bioinformatics/15.4.267. [DOI] [PubMed] [Google Scholar]
- Lydall D, Ammerer G, Nasmyth K. A new role for MCM1 in yeast: Cell cycle regulation of SWI5 transcription. Genes & Dev. 1991;5:2405–2419. doi: 10.1101/gad.5.12b.2405. [DOI] [PubMed] [Google Scholar]
- McInerny CJ, Partridge JF, Mikesell GE, Creemer DP, Breeden LL. A novel Mcm1-dependent element in the SWI4, CLN3, CDC6, and CDC47 promoters activates M/G1-specific transcription. Genes & Dev. 1997;11:1277–1288. doi: 10.1101/gad.11.10.1277. [DOI] [PubMed] [Google Scholar]
- McIntosh EM. MCB elements and the regulation of DNA replication genes in yeast. Curr Genet. 1993;24:185–192. doi: 10.1007/BF00351790. [DOI] [PubMed] [Google Scholar]
- Mewes HW, Albermann K, Bähr M, Frishman D, Gleissner A, Hani J, Heumann K, Kleine K, Maierl A, Oliver SG, et al. Overview of the yeast genome. Nature. 1997;387(Suppl.):7–8. doi: 10.1038/42755. [DOI] [PubMed] [Google Scholar]
- Overdier DG, Porcella A, Costa RH. The DNA-binding specificity of the hepatocyte nuclear factor 3/forkhead domain is influenced by amino acid residues adjacent to the recognition helix. Mol Cell Biol. 1994;14:2755–2766. doi: 10.1128/mcb.14.4.2755. [DOI] [PMC free article] [PubMed] [Google Scholar]
- Overdier DG, Ye H, Peterson RS, Clevidence DE, Costa RH. The winged helix transcriptional activator HFH-3 is expressed in the distal tubules of embryonic and adult mouse kidney. J Biol Chem. 1997;272:13725–13730. doi: 10.1074/jbc.272.21.13725. [DOI] [PubMed] [Google Scholar]
- Pedersen AG, Baldi P, Chauvin Y, Brunak S. The biology of eukaryotic promoter prediction—A review. Comput Chem. 1999;23:191–207. doi: 10.1016/s0097-8485(99)00015-7. [DOI] [PubMed] [Google Scholar]
- Peterson RS, Lim L, Ye H, Zhou H, Overdier DG, Costa RH. The winged helix transcriptional activator HFH-8 is expressed in the mesoderm of the primitive streak stage of mouse embryos and its cellular derivatives. Mech Dev. 1997;69:53–69. doi: 10.1016/s0925-4773(97)00153-6. [DOI] [PubMed] [Google Scholar]
- Pic A, Lim FL, Ross SJ, Veal EA, Johnson AL, Sultan MR, West AG, Johnston LH, Sharrocks AD, Morgan BA. The forkhead protein Fkh2 is a component of the yeast cell cycle transcription factor SFF. EMBO J. 2000;19:3750–3761. doi: 10.1093/emboj/19.14.3750. [DOI] [PMC free article] [PubMed] [Google Scholar]
- Pierrou S, Helqvist M, Samuelsson L, Enerbäck S, Carlsson P. Cloning and characterization of seven human forkhead proteins: Binding site specificity and DNA bending. EMBO J. 1994;13:5002–5012. doi: 10.1002/j.1460-2075.1994.tb06827.x. [DOI] [PMC free article] [PubMed] [Google Scholar]
- Quandt K, Frech K, Karas H, Wingender E, Werner T. MatInd and MatInspector: new fast and versatile tools for detection of consensus matches in nucleotide sequence data. Nucleic Acids Res. 1995;23:4878–4884. doi: 10.1093/nar/23.23.4878. [DOI] [PMC free article] [PubMed] [Google Scholar]
- Roth FP, Hughes JD, Estep PW, Church GM. Finding DNA regulatory motifs within unaligned noncoding sequences clustered by whole-genome mRNA quantitation. Nat Biotech. 1998;16:939–945. doi: 10.1038/nbt1098-939. [DOI] [PubMed] [Google Scholar]
- Schneider TD, Stephens RM. Sequence logos: A new way to display consensus sequences. Nucleic Acids Res. 1990;18:6097–6100. doi: 10.1093/nar/18.20.6097. [DOI] [PMC free article] [PubMed] [Google Scholar]
- Shannon CE. The mathematical theory of communication. Bell Syst Tech J. 1948;27:379–423. , 623–656. [Google Scholar]
- Smith DK, Xue H. A major component approach to presenting consensus sequences. Bioinformatics. 1998;14:151–156. doi: 10.1093/bioinformatics/14.2.151. [DOI] [PubMed] [Google Scholar]
- Spellman PT, Sherlock G, Zhang MQ, Iyer VR, Anders K, Eisen MB, Brown PO, Botstein D, Futcher B. Comprehensive identification of cell cycle regulated genes of the yeast Saccharomyces cerevisiae by microarray hybridization. Mol Biol Cell. 1998;9:3273–3297. doi: 10.1091/mbc.9.12.3273. [DOI] [PMC free article] [PubMed] [Google Scholar]
- Tamayo P, Slonim D, Mesirov J, Zhu Q, Kitareewan S, Dmitrovsky E, Lander ES, Golub TR. Interpreting patterns of gene expression with self-organizing maps: Methods and application to hematopoietic differentiation. Proc Natl Acad Sci. 1999;96:2907–2912. doi: 10.1073/pnas.96.6.2907. [DOI] [PMC free article] [PubMed] [Google Scholar]
- Tavazoie S, Hughes JD, Campbell MJ, Cho RJ, Church GM. Systematic determination of genetic network architecture. Nat Genet. 1999;22:281–285. doi: 10.1038/10343. [DOI] [PubMed] [Google Scholar]
- Taylor IA, McIntosh PB, Pala P, Treiber MK, Howell S, Lane AN, Smerdon SJ. Characterization of the DNA-binding domains of the yeast cell-cycle transcription factors Mbp1 and Swi4. Biochemistry. 2000;39:3943–3954. doi: 10.1021/bi992212i. [DOI] [PubMed] [Google Scholar]
- Thompson JD, Higgins DG, Gibson TJ. CLUSTAL W: Improving the sensitivity of progressive multiple sequence alignment through sequence weighting, position-specific gap penalties and weight matrix choice. Nucleic Acids Res. 1994;22:4673–4680. doi: 10.1093/nar/22.22.4673. [DOI] [PMC free article] [PubMed] [Google Scholar]
- Velculescu VE, Zhang L, Zhou W, Vogelstein J, Basrai MA, Bassett DE, Hieter P, Vogelstein B, Kinzler KW. Characterization of the yeast transcriptome. Cell. 1997;88:243–251. doi: 10.1016/s0092-8674(00)81845-0. [DOI] [PubMed] [Google Scholar]
- Wen X, Furham S, Michaels GS, Carr DB, Smith S, Barker JL, Somogyi R. Large-scale temporal gene expression mapping of central nervous system development. Proc Natl Acad Sci. 1998;95:334–339. doi: 10.1073/pnas.95.1.334. [DOI] [PMC free article] [PubMed] [Google Scholar]
- Wingender E, Chen X, Hehl R, Karas H, Liebich I, Matys V, Meinhardt T, Prüβ M, Reuter I, Schacherer F. TRANSFAC: An integrated system for gene expression regulation. Nucleic Acids Res. 2000;28:316–319. doi: 10.1093/nar/28.1.316. [DOI] [PMC free article] [PubMed] [Google Scholar]
- Yada T, Totoki Y, Ishikawa M, Asai K, Nakai K. Automatic extraction of motifs represented in the hidden Markov model from a number of DNA sequences. Bioinformatics. 1998;14:317–325. doi: 10.1093/bioinformatics/14.4.317. [DOI] [PubMed] [Google Scholar]
- Zhu G, Davis TN. The forkhead transcription factor Hcm1p participates in the regulation of SPC110, which encodes the calmodulin-binding protein in the yeast spindle pole body. Biochim Biophys Acta. 1998;1448:236–244. doi: 10.1016/s0167-4889(98)00135-9. [DOI] [PubMed] [Google Scholar]
- Zhu G, Spellman PT, Volpe T, Brown PO, Botstein D, Davis TN, Futcher B. Two yeast forkhead genes regulate the cell cycle and pseudohyphal growth. Nature. 2000;406:90–94. doi: 10.1038/35017581. [DOI] [PubMed] [Google Scholar]
- Zhu J, Zhang MQ. SCPD: A promoter database of yeast Saccharomyces cerevisiae. Bioinformatics. 1999;15:607–611. doi: 10.1093/bioinformatics/15.7.607. [DOI] [PubMed] [Google Scholar]