

Abstract
Worldwide oral squamous cell carcinoma (OSCC) accounts for more than 100,000 deaths each year. Chronic inflammation constitutes one of the key risk factors for OSCC. Accumulating evidence suggests that aberrant DNA methylation may contribute to OSCC tumorigenesis. This study investigated whether chronic inflammation alters DNA methylation and expression of cancer-associated genes in OSCC.
We established an in-vitro model of interleukin (IL)-6 mediating chronic inflammation in OSCC cell lines. Thereafter, we measured the ability of IL-6 to induce global hypomethylation of LINE-1 sequences, as well as CpG methylation changes using multiple methodologies including quantitative pyrosequencing, methylation-specific multiplex ligation-dependent probe amplification, and sensitive melting analysis after real-time methylation specific PCR. Gene expression was investigated by quantitative Reverse Transcriptase-PCR.
IL-6 induced significant global LINE-1 hypomethylation (p=0.016) in our in-vitro model of inflammatory stress in OSCC cell lines. Simultaneously, IL-6 induced CpG promoter methylation changes in several important putative tumor suppressor genes including CHFR, GATA5, and PAX6. Methylation changes correlated inversely with the changes in the expression of corresponding genes.
Our results indicate that IL-6-induced inflammation promotes tumorigenesis in the oral cavity by altering global LINE-1 hypomethylation. In addition, concurrent hypermethylation of multiple tumor suppressor genes by IL-6 suggests that epigenetic gene silencing may be an important consequence of chronic inflammation in the oral cavity. These findings have clinical relevance, as both methylation and inflammation are suitable targets for developing novel preventive and therapeutic measures.
Keywords: oral cancer, methylation, epigenetics, inflammation, IL-6
INTRODUCTION
Head and neck squamous cell carcinoma (HNSCC) represents the fifth most frequent cancer worldwide. Of the 1.6 million diagnosis and 333,000 deaths each year worldwide due to HNSCC, half are localized in the oral cavity (OSCC). (1) OSCC is a multifactorial disease, which is primarily associated with chronic tobacco and alcohol use; however, chronic inflammation, viral infections (human papillomavirus) and genetic predisposition have also been implicated in oral tumorigenesis. (2) The molecular mechanisms of OSCC are unclear, but include DNA deletions, loss of heterozygosity, microsatellite instability, mutations, histone deacetylation, and silencing of tumor suppressor genes by promoter hypermethylation. (2-4)
In the context of aberrant methylation and its causative role in human cancer, both genome-wide hypomethylation and promoter hypermethylation are believed to play a pivotal role in causing chromosomal instability and transcriptional silencing of growth regulatory genes, respectively. (5;6) It has been proposed that DNA hypomethylation contributes to tumorigenesis by two potential mechanisms. First, by reducing methylation of inherently highly methylated repetitive elements (such as LINE-1 and Alu sequences) and causing increased chromosomal instability that leads to mitotic dysregulation; and second, by inadvertent demethylation, which induces reactivation of certain proto-oncogenes that are normally methylation-silenced in the human genome. (7-9) In OSCC, heterogenic karyotypes are associated with dysregulation of the cell cycle and checkpoint controls (10); however, the relationship between DNA hypomethylation and chromosomal instability as a contributor to OSCC tumorigenesis has not been evaluated. On the other hand, aberrant hypermethylation that occurs within the CpG islands of many tumor suppressor genes is another key player in OSCC. Aberrant hypermethylation of 5-methylcytosines at CpG dinucleotides is catalyzed by DNA methyltransferases (DNMTs) (5). Methylation within the promoter region interferes with transcription factors and inhibits their binding to the DNA, resulting in transcriptional silencing of the gene. (11)
Due to its constant exposure to the environment and its carcinogens, the oral cavity is frequently under inflammatory stress and particularly vulnerable to various infections causing infection/inflammation-related diseases including cancer. (2) The specific mechanisms by which chronic inflammation causes oral tumorigenesis are yet not fully understood. Chronic inflammation can be induced by various factors like bacterial or viral infections or chemical irritants persistently stimulating the immune system. (12) Tumors are frequently surrounded by an inflammatory microenvironment rich in inflammatory cytokines, growth factors, and chemokines, which actively promote malignant cellular growth. These factors are produced by the tumor itself and its surrounding tissue and contribute to the malignant progression. (13)
One such factor, interleukin (IL)-6, is a pro-inflammatory cytokine that mediates chronic inflammation and may play an important role in inflammation-driven oral carcinogenesis. (14) IL-6 is constantly released by inflammatory cells, neighboring tissues, as well as by the tumor cells. (15;16) IL-6 activates inner-cellular transcription factors by phosphorylation, as for example signal transducer and activator of transcription (STAT)-1 and STAT3. High STAT3 levels have been observed in various tumors, linking IL-6 to tumorigenesis. (17-20) IL-6 is thought to have regulating effects on cell survival, growth, proliferation, and differentiation of cancer cells and is associated with tumorigenesis, angiogenesis, and cachexia. (16;21-23) First reports indicate that tobacco, the major risk factor for OSCC, may be associated with high IL-6 levels in saliva. Saliva IL-6 levels were noticed to increase with severity of dysplasia. (24) OSCC patients often have elevated IL-6 levels in their saliva and blood. (25-27) It has also been shown that OSCC cells preferentially invade and metastasize into IL-6-rich environments. (18) Evidence suggests that IL-6 promotes tumor proliferation by promoter hypermethylation in cholangiocarcinoma (28), as well as in pancreatic ductal adenocarcinoma (29). Numerous projects have demonstrated that IL-6-induced hypermethylation and gene silencing may be mediated by DNMTs. (30-32) Taken together, these studies suggest that IL-6-induced inflammation and carcinogenesis may be in part orchestrated via epigenetic changes.
In spite of close associations between inflammation and OSCC, it is unknown whether chronic inflammation in oral neoplasia influences aberrant DNA methylation. In this study, we tested the hypothesis that chronic inflammation in the oral cavity alters DNA methylation, which might induce multiple nuclear changes, inactivate tumor suppressor genes, and consequently contribute to oral tumorigenesis.
MATERIALS AND METHODS
Cell culture
We used a panel of ten cell lines for this study including two non-cancer cells (HaCaT and primary oral fibroblasts), seven OSCC cell lines (CLS-354, Detroit 562, UM-SCC-14C, SCC016, SCC056, SCC114 and SCC116) and one colorectal cancer cell line (HCT116). Details about the cell line source and additional information are presented in the Supplemental Table 1. Cells were grown in appropriate cell culture medium and growth conditions. In our lab, all cells are tested and authenticated every six months using known genetic and epigenetic marks.
STAT3 and pSTAT3 Expression
In order to determine presence of the IL-6 receptor (IL-6R) suggesting for a functionally active IL-6 system, we first screened all cell lines for the expression of STAT3 and pSTAT3. We treated all ten cell lines with 10 ng/mL IL-6 (Sigma Chemicals, Saint Louis, MO) for 30 min in cell culture. The cells were harvested with 1xSDS lysis buffer (containing 62.5 mM Tris pH 6.8, 10% glycerol, 2% SDS, 2 mM EDTA, bromophenol blue, H2O and freshly added 2% β-mercaptoethanol) and STAT3/ pSTAT3 expression were evaluated by western immunoblotting. The samples were denatured, loaded onto 10% SDS-polyacrylamide gels (containing Tris, acrylamide/ Bis, SDS, TEMED, APS, and H2O) and transferred onto PVDF membranes. The membranes were blocked with 5% non-fat milk powder in TBS-T for 30 min. Blotting with the primary STAT3 or pSTAT3 antibody (1:500, Santa Cruz Biotechnology, Santa Cruz, CA) was performed overnight at 4°C or for 2 h at room temperature. The secondary antibody was added for 30 min at room temperature. The proteins were visualized with ECL-Plus detection solution using the Storm 840 fluorescence imaging system (Amersham, Sunnyvale, CA).
MTT Assay
An MTT assay was performed for the four cell lines (HaCaT, SCC056, SCC114, and SCC116) which expressed IL-6R. The IL-6 concentrations tested were 0, 5, 10, 20, 40, 80, and 160 ng/mL, and fresh medium containing IL-6 was replaced every 24 h. Cell viability was assessed at time points 0, 24, 48, 72, and 96 h. After removing the medium, 100 μL of MTT solution (0.5 mg MTT/mL medium; Calbiochem, San Diego, CA) were added to each well of the 96-well-plate, which was incubated at 37°C 5% CO2 for 2-3 h. 100 μL lysis buffer (10% SDS in 0.01 N HCl) were added to each well. The plate was incubated at 37°C; 0% CO2 for 18-24 h protected from light. The absorbance was measured colorimetrically at 570 nm with a microplate reader (model 550, BioRad, Hercules, CA). The mean value of the colorimetrical measurements of each triplicate was calculated relative to the mean values of the untreated controls (100% viability) for each day.
IL-6 induced inflammation in-vitro
HaCaT, SCC056, SCC114, and SCC116 cell lines were treated with 100 ng/mL IL-6 for 24 h and 96 h. A medium change was performed every 24 h. We included HCT116 colorectal cancer cells as controls, which have previously been used for IL-6-induced inflammation and methylation changes. (31) As a control for demethylation experiments, genomic DNA was obtained from HCT116 cells that were treated with 2.5 μM 5-aza-2′-deoxycytidine (5-AZA) for 24 h and harvested after another 48 h of proliferation. (33)
LINE-1 (long interspersed nuclear element-1) pyrosequencing
DNA isolation was performed using the QIAamp DNA Mini kit (Qiagen, Valencia, CA). Bisulfite modification was performed with 300-500 ng genomic DNA from various cell lines using the EZ DNA Methylation Gold kit (Zymo Research, Orange, CA). The bisulfite-modified DNA was used as a template for the PCR amplification of LINE-1 elements. Primer sequences and specific conditions for PCR and pyrosequencing of LINE-1 have previously been published. (34) PCR amplicons were sequenced by quantitative pyrosequencing. The pyrosequencing assay was designed to evaluate the methylation status of four CpG sites using the PSQ96 HS System (Biotage AB, Charlotte, NC). Data analysis was performed using PyroMark MD v.1.0 software (Biotage AB, Charlotte, NC).
Methylation-Specific Multiplex Ligation-dependent Probe Amplification (MS-MLPA)
For multiplex methylation analysis of several tumor suppressor genes, we purchased the MS-MLPA kit ME002-A1–Lot#1207 (MLPA, MRC Holland, Amsterdam, Netherlands), of which several genes have been reported to be associated with OSCC. This kit includes 27 restriction enzyme-sensitive probes specific for CpG islands within 26 selected tumor suppressor genes and 14 control probes. MS-MLPA experiments were performed using 100-200 ng genomic DNA from various cell lines. We used the PTC 200 Peltier Thermal Cycler (MJ Research, Waltham, MA) to perform the denaturation, hybridization, ligation/digestion, and PCR reaction with slight modifications from the manufacturer’s original instructions. Fragment analysis was performed on the ABI Prism 3100 Avant Genetic Analyzer sequencing machine (Applied Biosystems, Foster City, CA). MS-MLPA analysis was completed using the Coffalyser Software (MLPA, MRC Holland, Amsterdam, Netherlands). MS-MLPA methylation analyses were repeated in SCC056 cells using same conditions to ensure the robustness of this assay in order to perform direct comparisons with other methylation assays in this study.
Sensitive Melting Analysis after Real-Time – Methylation-Specific PCR (SMART–MSP)
For detailed quantitative information, we performed SMART-MSP on a subset of genes in OSCC cell lines that showed altered CpG methylation due to IL-6 in our MS-MLPA experiments (CHFR, GATA5, PAX6). In order to normalize for input DNA, a COL2A1 control assay was included with each SMART-MSP reaction, as previously published. (35) For a methylation-positive control, 5 μg of genomic DNA of the human lymphoma cell line Raji were incubated at 37°C twice for 2-3 h with 25 units of methyltransferase Sssl methylase (New England Biolabs, Ipswich, MA), S-adenosyl methionine, buffer, and H2O. Purification was performed with glycogen, ammonium acetate 7.5M, and ethanol to obtain 100% artificially methylated DNA. The methylated CHFR, GATA5, and PAX6 primer sequences were designed to match the CpG-regions of the MS-MLPA probes. The qPCR reaction contained 12.5 μL SYBR Green (Applied Biosystems, Foster City, CA), 5 pmol of each forward and reverse primer (Supplemental Table 2), 9.5 μL H2O, and 2 μL bisulfite-modified DNA to a final volume of 25 μL. The qPCR protocol was initiated with one cycle of 50°C for 2 min and 95°C for 10 min, followed by 45 cycles of 95°C for 20 sec, the gene-specific annealing temperature (Supplemental Table 2) for 30 sec and 72°C for 30 sec. The dissociation protocol started at 60°C. We used the ABI Prism 7000 Sequence Detection System (Applied Biosystems). Calculation of the methylation status with normalization to COL2A1 and 100% (Sssl methylase-treated Raji DNA) was performed applying a relative 2(−ΔΔCt) quantification.
RNA expression by qRT-PCR
Total RNA isolation was performed with the RNAeasy Plus kit (Qiagen, Valencia, CA). cDNA was prepared from 1 μg RNA using the Advantage RT-for-PCR kit (Clontech, Mountain View, CA). β-actin was used to normalize for input cDNA. qRT-PCR was performed for CHFR, GATA5, and PAX6. The qPCR reaction contained 12.5 μL SYBR Green (Applied Biosystems, Foster City, CA), 5 pmol of each forward and reverse primer (Supplemental Table 3), 9.5 μL water, and 2 μL cDNA to a final volume of 25 μL. The qPCR protocol included one cycle of 50°C for 2 min and 95°C for 10 min, followed by 45 cycles of 95°C for 15 sec and 60°C for 1 min. The dissociation protocol started at 60°C. We used the ABI Prism 7000 Sequence Detection System (Applied Biosystems). Calculation of the gene expression with normalization to β-actin and 100% (untreated DNA) was performed with a relative 2(−ΔΔCt) quantification.
Statistical Analysis
A statistical test for significance was performed using a repeated measures-ANOVA test to compare LINE-1 methylation percentages at 0 h versus 24 h versus 96 h of IL-6 treatment. A two-sided p-value of p<0.05 was considered significant. For determining the reproducibility of the MS-MLPA results, we performed a Spearman’s rank correlation test, in which we used precise MS-MLPA methylation ratios and a ratio of >1 was considered equal to 1.
RESULTS
Oral cancer cells express IL-6R and demonstrate STAT3 phosphorylation
Binding of IL-6 to its receptor activates an inner-cellular cascade causing phosphorylation of STAT3. Consequently, analyzing expression of STAT3/pSTAT3 is a conventional approach to identify a functional IL-6 system in cultured cells. Since it is unclear which of the oral cell lines have an intact IL-6 system together with its receptor, we analyzed our panel of ten cell lines for the presence of IL-6R, and consequently the activation-induced increase in pSTAT3 expression. For this, we exposed all cell lines to a short, 30 minute spike of IL-6, followed by determination of changes in the expression of STAT3 and pSTAT3 protein levels by western immunoblotting. HCT116 colon cancer cells, which express IL-6R, served as positive controls. (31;36) As shown in Figure 1, a significant increase in pSTAT3 expression was visible in a subset of cell lines including HCT116, HaCaT, SCC056, SCC114, and SCC116 following IL-6 stimulation. Total steady-state STAT3 protein levels in all cell lines indicated equal sample loading for various cell lysates. These data provide indirect evidence for the presence of IL-6R in HCT116, HaCaT, SCC056, SCC114, and SCC116, and accordingly these cell lines were chosen for further experimentation.
Figure 1. IL-6 induced changes in pSTAT3 expression.
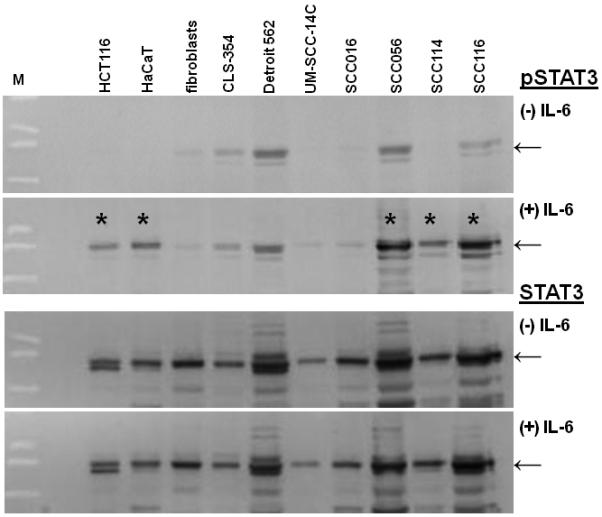
Western immunoblotting for pSTAT3 (91/86kDa) and STAT3 (91/86kDa) expression in untreated (−) and IL-6 treated (+) cell lines. The presence of an IL-6 receptor (IL-6R) causes phosphorylation of STAT3 through a cellular signaling cascade. The cell lines HCT116, HaCaT, SCC056, SCC114, and SCC116 clearly show STAT3 phosphorylation upon IL-6 treatment giving indirect proof of IL-6R (*). The STAT3 blot was performed as loading control and shows equal sample loading in all lanes between IL-6 treated and untreated cells. M indicates size marker.
Next, in order to determine safe but effective IL-6 concentrations required for in-vitro experiments in IL-6-responsive cell lines over a period of time, we performed cell viability MTT assays in SCC056, SCC114, SCC116, and HaCaT cells in the presence of varying IL-6 concentrations (0-160 ng/mL). We noted that none of the cell lines experienced any significant loss in cell viability after 96 h of IL-6 treatment, even at IL-6 concentrations as high as 160 ng/mL (data not shown). Based upon these data, we made a conservative and safe selection of 100 ng/mL IL-6 for subsequent experiments. This IL-6 concentration has also been previously demonstrated to be safe in HCT116 cells. (31)
IL-6 induces LINE-1 hypomethylation in oral cancer cells
Quantitative LINE-1 pyrosequencing was performed to determine global methylation levels in various OSCC cell lines following IL-6 treatment. Hypomethylation of LINE-1 elements has been proposed to serve as a surrogate marker for global methylation and chromosomal instability in cancer cells. (6;7;37;38) Interestingly, supporting this rationale for lower LINE-1 methylation in cancer cells, we observed that basal LINE-1 methylation levels in non-cancer HaCaT cells were higher (66%), compared to SCC056, SCC114 and SCC116 OSCC cell lines (ranging from 28-39%) (Figure 2). In this study, IL-6 treatment induced a significant degree of LINE-1 hypomethylation in all cell lines, as indicated by ANOVA analysis between untreated and IL-6 treated cells (p=0.016). As anticipated, 5-AZA-treated HCT116 cells demonstrated significant LINE-1 hypomethylation (relative decrease of 36%; data not shown.) These data are of significance, as to the best of our knowledge, this is the first report indicating that IL-6 induces LINE-1 demethylation, which is suggestive of a generalized global hypomethylation in oral cells.
Figure 2. IL-6-mediated LINE-1 hypomethylation.

DNA was obtained after 00 h, 24 h, and 96 h of 100 ng/mL IL-6 treatment from the cell lines HaCaT, SCC056, SCC114, and SCC116. LINE-1 methylation was evaluated by quantitative pyrosequencing. A). The graph shows the LINE-1 methylation levels for all four cell lines. Significant LINE-1 hypo-methylation can be detected upon IL-6 mediated inflammation in all cell lines (p=0.016; by ANOVA when all treated cells were compared with corresponding untreated controls). B-D). Representative LINE-1 pyrograms for SCC114 cells at 00 h (B), 24 h (C), and 96 h (D). X-axis represents individual nucleotides arranged in a specific dispensation order for the PCR amplicon sequenced. The peak height represents the amount of light emitted as each nucleotide is incorporated in the sequencing reaction. The cytosine residue at position 17 serves as an internal control for complete bisulfite conversion of genomic DNA. The gray bars are the C/T (CpG sites) sites being interrogated: C-peaks correspond to methylated cytosines (m5C) and T-peaks suggest unmethylated cytosines that were bisulfite converted to thymines. The blue boxes above each graph indicate the calculated methylation percentages at each CpG site, which are used to determine the overall mean methylation levels. IL-6 induced LINE-1 hypo-methylation in all investigated CpG sites.
IL-6 alters CpG methylation of tumor suppressor genes in oral cancer cells
We next asked whether IL-6 has any effect on the CpG promoter methylation patterns of tumor suppressor genes in oral cancer cells, which might result in modified gene expression. Due to a paucity of literature on the topic, we chose to first perform a MS-MLPA approach that allows interrogation of the methylation status of several gene loci in a multiplex-PCR based assay.
Prior to detailed analyses of MS-MLPA data, we were curious to decipher the robustness of the MS-MLPA assay. We determined the reproducibility of MS-MLPA results with the original analysis (Run-1) by two different methods: first, by repeating the sequencing of PCR products at different concentrations (Run-2), and second, by repeating the entire MS-MLPA protocol with the genomic DNA obtained from one of the cell lines (SCC056; Run-3). Reproducibility of MS-MPLA in SCC056 cells was evaluated in DNA obtained from untreated cells (00 h) and IL-6-treated cells (24 and 96 h). We observed a very high degree of reproducibility for MS-MLPA for each of these treatment regimens, and therefore, for illustration purposes, we have chosen to represent data from only untreated SCC056 cells at 00 h (Supplemental Figure 1). As shown in this figure, there was a very high degree of reproducibility between MS-MLPA runs as indicated by statistically significant Spearman’s correlation coefficients (r) for Run-1 vs Run-2 (r=0.9701; p<0.0001) and Run-1 vs Run-3 (r=0.8748; p<0.0001).
Since MS-MLPA is a semi-quantitative method, the ratio of 0-0.29 reflects no significant methylation (indicated by light gray rectangles in Figure 3), the ratio 0.30-0.69 represents hemimethylation (dark gray rectangles), and a ratio ≥0.70 stands for methylation (black rectangles). For the ease of understanding the MS-MLPA data, an IL-6-induced change in the methylation status of a specific gene for any of the cell lines is indicated by the change in corresponding color shade. The last column in Figure 3 demonstrates 5-AZA-treated HCT116 cells showing extensive de-methylation of multiple genes. Although all three OSCC cell lines experienced varying degree of hypermethylation for different genes following IL-6 treatment, SCC056 cells demonstrated the most pronounced effects on gene hypermethylation. As illustrated in the figure, IL-6-stimulated SCC056 cells showed aberrant methylation of several gene promoters including RARB, CDKN2A, PAX5A, PAX6, CHFR and GATA5. Similar changes were observed in SCC114 (PAX6, WT1, CD44, CHFR and GATA5) and SCC116 (PAX6, CHFR and GATA5) cells following IL-6-induced inflammatory stress. Taken together, three genes CHFR, GATA5, and PAX6 showed consistent aberrant methylation in all three OSCC cell lines. On the other hand, IL-6 treatment altered the methylation status of a very different subset of genes in the immortalized normal skin keratinocyte HaCaT cells, which included TP73, VHL, RARB, ESR1, WT1 and CD44. Similarly, HCT116 colon cancer cells, which are highly methylated for most genes in this panel demonstrated methylation changes in the MGMT and IGSF4 genes. These results are of significance as these clearly indicate a unique methylation pattern in OSCC, normal oral keratinocytes and colon cancer cells.
Figure 3. Changes in methylation patterns following IL-6 treatment determined by MS-MLPA.

The figure depicts the results of the 27 restriction enzyme-sensitive probes for the cell lines SCC056, SCC114, SCC116, HaCaT, and HCT116 comparing 00 h, 24 h, and 96 h IL-6 treatment (100 ng/mL). The data from 5-aza-2′-deoxycytidine (5-AZA) treated HCT116 cells are included. Light gray colored rectangles indicate no methylation (ratios 0-0.29), dark gray rectangles suggest hemimethylation (ratios 0.30-0.69) and black rectangles represent methylation (ratios 0.70 and above). Data normalization and analyses were performed by the Coffalyser software. The MS-MLPA data revealed multiple genes affected by IL-6 treatment in the OSCC cell lines, with CHFR, GAT5, and PAX6 genes showing consistent methylation alterations in all three cell lines.
In order to further validate and ascertain the significance of our semi-quantitative MS-MLPA results for the methylation changes of CHFR, GATA5, and PAX6 genes in all three OSCC cell lines, we next utilized a more quantitative SMART-MSP assay. As shown in Figure 4, SMART-MSP successfully validated the MS-MLPA findings in 7 of 9 cases. With the exception of CHFR in SCC114 cells and GATA5 in SCC116 cell line, we observed a significant correlation for the methylation changes caused by IL-6 treatment by both methods. Lastly, our initial pilot studies showed that IL-6 failed to induce epigenetic changes in cell lines lacking IL-6 receptor, suggesting the significance of IL-6 induced inflammatory stress as one of the possible key modulators of methylation in oral cancer cells (data not shown).
Figure 4. Real-Time SMART-MSP validation of CHFR, GATA5, and PAX6 promoter methylation and correlation with corresponding gene expression.

The methylation levels of a subset of genes were initially assessed by MS-MLPA (left boxes), and subsequently validated by SMART-MSP (middle boxes). Changes in corresponding gene expression were evaluated by qRT-PCR (right boxes). This figure depicts an overview of methylation and gene expression results from CHFR, GATA5, and PAX6 genes from SCC056, SCC114, and SCC116 cell lines after 00 h, 24 h, and 96 h of IL-6 treatment. Since MS-MPLA and SMART-MSP are semi-quantitative and quantitative methods, respectively, we have compared the trends of results. For MS-MLPA, a mean value was used to describe unmethylated (14.5%), hemimethylated (49.5%), and methylated (85.0%) levels. The general trend was determined by comparing 00 h to 96 h.The arrows above each graph show the trend of hyper- versus hypomethylation or over- versus underexpression of the specific gene. A horizontal bar above the graph suggests no change due to IL-6. Black arrows indicate good correlation between MS-MLPA and either SMART-MSP or qRT-PCR results, while gray-colored arrows indicate lack of such correlation.
IL-6-induced methylation changes inversely correlate with gene expression in oral cancer cells
Lastly, we were curious to understand the relationship between IL-6-induced aberrant methylation and its effects on the expression level of the corresponding gene in the OSCC cell lines. For these experiments, we investigated changes in gene expression (mRNA) for the three genes CHFR, GATA5, and PAX6, which were found to demonstrate significant methylation changes upon IL-6-induced inflammation in all three OSCC cell lines. The qRT-PCR results for these three genes are presented in Figure 4. As shown in this figure, IL-6-induced methylation changes correlated inversely with the corresponding gene expression. For instance, in SCC056 cells, CHFR gene experienced promoter hypomethylation by IL-6, which correlated with corresponding up-regulation of gene expression. Conversely, GATA5 and PAX6 genes were hypermethylated following IL-6 exposure, which resulted in a concomitant down-regulation of expression of the corresponding genes. Collectively, the correlation between gene methylation and expression results was perfect in SCC056 cells (as indicated by all dark arrows), while it was less perfect for the SCC114 and SCC116 cell lines (indicated by a few gray arrows). Nonetheless, our data clearly indicate that IL-6-induced hypermethylation in oral cancer cells leads to transcriptional silencing of the corresponding tumor suppressor genes. These findings constitute a novel molecular mechanism of IL-6-mediated inflammatory response in OSCC, and perhaps other human cancers.
DISCUSSION
In this study, we tested the hypothesis that chronic inflammatory stress in the oral cavity may promote tumorigenesis by inducing aberrant DNA methylation in cultured cells. A systematic evaluation of this concept would improve our current understanding of molecular mechanisms operative in the oral cavity and might provide additional insights into this ‘epigenetic field effect’ concept, which is believed to play an important role in the genesis of certain human cancers. In order to simulate a model of chronic inflammation, we used IL-6, activator of the OSCC-associated STAT3 cascade, to simulate inflammation in a panel of oral cancer cell lines. We studied the changes of both global DNA methylation and gene-specific promoter methylation of various tumor suppressor genes. In support of our hypothesis, herein, our data suggest that IL-6-induced inflammation caused hypomethylation of LINE-1 sequences, which has been proposed to mediate increased chromosomal instability. At the same time, IL-6 treatment altered promoter methylation levels in a subset of genes in HaCaT, SCC056, SCC114, SCC116, and HCT116 cell lines. Taken together, these data suggest that IL-6 possibly contributes to the development of OSCC via inducing global hypomethylation as well as changes in DNA methylation patterns in oral cancer cells.
One of the technical challenges in the field has been the availability of appropriate in-vitro models of chronic inflammation. Prior to selecting the IL-6 model, we experimented with inflammatory stress using different inflammatory mediators. In one instance, we created inflammatory stress through a co-culture experiment, in which we cultured oral cells with activated neutrophils isolated from healthy volunteer’s blood, which served as donor of inflammatory reactants (39). However, this model creates acute and somewhat variable amounts of inflammation each time, therefore we attempted culturing cells in the presence of hydrogen peroxide (H2O2; as a model of direct oxidative stress (40)) and S-Nitroso-N-acetyl-DL-penicillamine (SNAP; as a model of direct nitrosative stress (41;42)). Studying these effects on the methylation of LINE-1 sequences by pyrosequencing in HaCaT cells, we observed a relative decrease in LINE-1 methylation ranging from 5-12% in any of these three inflammatory models (unpublished data). All these approaches provided evidence for LINE-1 hypomethylation, but since most of these models mimicked acute rather than chronic inflammatory stress, we moved forward by choosing IL-6 as a mediator of chronic inflammatory stress, as published previously (28;31). Our observation that there is a loss of LINE-1 methylation in cultured oral cancer cells following IL-6-induced inflammation is novel and consistent with a previous study performed in clinical specimens (oral rinses and tissues) obtained from OSCC patients. (43) Likewise, in colorectal cancer, it has been proposed that LINE-1 hypomethylation serves as a surrogate marker for increased chromosomal instability (44;45), a molecular alteration that has frequently been observed in OSCC. (10;46;47)
In addition to LINE-1 hypomethylation, our MS-MLPA experiments provided evidence for increased CpG island methylation changes by IL-6-induced inflammation in several tumor suppressor genes, including CHFR, GATA5, and PAX6. These alterations included both hyper- and hypo-methylation of various genes. Aberrant promoter hypermethylation of the CHFR gene has recently been described in OSCC tissues, in which the frequency of CHFR promoter hypermethylation was as high as 34.7% in tumor samples, while adjacent normal mucosa only showed 7.7%. (48) These observations suggest that hypermethylation of CHFR is closely linked to oral carcinogenesis. It is highly plausible that our in-vitro results provide a mechanistic basis for what has been suggested in clinical specimens for OSCC development. Our data confirmed previous findings for CHFR methylation; however, none of the previous reports have shown the role of GATA5 or PAX6 methylation changes in OSCC.
Methylation changes of the genes WT1 and ESR1, which are included in our MS-MLPA gene panel, have previously been described to be hypermethylated in saliva and tissue of OSCC patients, and methylation was completely reversed after successful treatment of these patients. (49) These data clearly suggest that promoter hypermethylation of WT1 and ESR1 play a causative role in the stepwise tumor progression of OSCC. These findings are consistent with two observations in our experiments. First, the non-cancer cell line HaCaT was hemimethylated for WT1 and ESR1 at baseline, while the OSCC cell lines were fully methylated (with the exception of SCC114 in WT1). Second, IL-6 was able to change the WT1 methylation pattern from a hemimethylated to a completely methylated state in SCC114 and HaCaT (SCC056 and SCC116 were already fully methylated) and ESR1 from hemimethylated to fully methylated state in HaCaT cells (the OSCC cells were already methylated).
A change in methylation pattern is physiologically significant only if it translates into a change in corresponding gene expression and culminates in transcriptional silencing of the gene. (50) For this reason, we investigated gene expression changes of the three genes CHFR, GATA5, and PAX6, which we found to be the targets of IL-6-induced methylation. We observed a strong concordance between our methylation results and gene expression changes, which is pivotal as, to the best of our knowledge, no prior studies have performed such a systematic exploration of IL-6-induced epigenetic alterations in any human cancer.
We are mindful of the potential limitations of our study. In an attempt to strive for “healthy” oral keratinocytes in our experiments, we chose to use the immortalized human skin keratinocyte cell line HaCaT and primary oral fibroblasts. However, we are aware that these cell lines might not mimic an ideal healthy keratinocyte, and may not be a true representation of normal cells in the oral cavity. For these reasons, we have been cautious in interpreting our results obtained from HaCaT cells. Additionally, in this study, we did not provide direct evidence to demonstrate that suppression of IL-6 signalling or inhibition of chronic inflammation will reverse these epigenetic changes. Although such experiments may be of some significance, but given the fact that DNA methylation alterations are ‘dynamic’ in nature and hence are always reversible once the stimulus is removed, we feel certain that this would have been the case if we were to do such experiments. Nonetheless, future studies are needed to measure the clinical inflammatory impact, the significance of IL-6, and its correlation with aberrant DNA methylation in OSCC tissues.
In conclusion, inflammation and methylation are both believed to play key roles in oral tumorigenesis, however inflammation-driven effects on methylation have not yet been studied in this disease. This project established an IL-6-mediated chronic inflammation model in OSCC cell lines and determined that chronic inflammation alters the DNA methylation and gene expression profiles of OSCC cell lines. Herein, we demonstrate that IL-6-mediated inflammation induces global hypomethylation of LINE-1 sequences as well as hypermethylation of certain tumor suppressor genes, which led to their transcriptional repression by modifying their gene expression. This project contributes to the basic knowledge of inflammation’s contribution to OSCC and we would propose the inclusion of anti-inflammatory agents into future therapeutic strategies to preserve the genome’s physiologic methylation and gene expression.
STATEMENT OF NOVELTY AND IMPACT.
In this study, using a newly developed model of chronic inflammation in cultured cells, we observed that interleukin-6 acts as inflammatory mediator by inducing global DNA hypomethylation as well as aberrant promoter methylation changes that result in the modification of corresponding gene expression in oral squamous cell carcinoma (OSCC) cells. These findings are novel and have clinical implications in the management of OSCC patients, as one of the keys to better prognosis of OSCC is the early detection and timely removal of smaller lesions. Since methylation changes occur early, and can be easily monitored in the saliva, serum or tissue of OSCC patients, both methylation and inflammation would provide ideal avenues to serve as biomarkers for OSCC screening, monitoring, treatment response and disease recurrence.
Supplementary Material
Supplemental Figure 1: Correlation plots demonstrating reproducibility of MS-MLPA assay: The figure illustrates reproducibility of MS-MLPA assays in untreated SCC056 cells. The results from the initial MS-MLPA experiment (Run-1) are compared to repeated sequencing (Run-2, presented in Supplemental Figure 1A) and complete repetition of the MS-MLPA protocol using the same DNA (Run-3, presented in Supplemental Figure 1B). Each data point represents the methylation status of one MS-MLPA probe with ratios shown on the x-axis for Run-1 and on the y-axis for either Run-2 or Run-3. The line represents the linear trendline. MS-MLPA methylation levels were well reproducible as indicated by the significant Spearman’s correlation coefficient r=0.9701, p<0.0001 for Run-1 vs. Run-2 and r=0.8748, p<0.0001 for Run-1 vs. Run-3.
ACKNOWLEDGEMENTS
The authors would like to thank Alexander Link, Francesc Balaguer and Christoph Campregher for their constructive discussions and support during the course of this study. We would also like to thank the following institutions for providing various cell lines that facilitated conduct of experiments in this study: University of Pittsburgh, Pittsburgh, PA (Division of Head and Neck Surgery) for SCC016, SCC056, SCC114, and SCC116 cells; University of Vienna, Austria (Division of Head and Neck Surgery) for CLS-354, Detroit-562, and UM-SCC-14C; Texas A&M University at the Baylor College of Dentistry, Dallas, TX for the normal oral fibroblasts.
Grant support: The present work was supported by grants R01 CA72851 and CA129286 from the National Cancer Institute, National Institutes of Health, and funds from the Baylor Research Institute
Abbreviations
- 5-AZA
5-aza-2′-deoxycytidine
- DNMT
DNA methyltransferase
- H2O2
hydrogen peroxide
- HNSCC
head and neck squamous cell carcinoma
- IL
interleukin
- IL-6R
interleukin-6 receptor
- MS-MLPA
methylation-specific multiplex ligation-dependent probe amplification
- OSCC
oral squamous cell carcinoma
- SMART-MSP
sensitive melting analysis after real-time – methylation-specific PCR
- SNAP
S-Nitroso-N-acetyl-DL-penicillamine
- STAT
signal transducer and activator of transcription
Footnotes
Disclosures: None of the authors have any potential conflicts to disclose.
References
- (1).Jemal A, Siegel R, Ward E, Hao Y, Xu J, Thun MJ. Cancer statistics, 2009. CA Cancer J Clin. 2009 Jul;59(4):225–49. doi: 10.3322/caac.20006. [DOI] [PubMed] [Google Scholar]
- (2).Choi S, Myers JN. Molecular pathogenesis of oral squamous cell carcinoma: implications for therapy. J Dent Res. 2008 Jan;87(1):14–32. doi: 10.1177/154405910808700104. [DOI] [PubMed] [Google Scholar]
- (3).Shintani S, Nakahara Y, Mihara M, Ueyama Y, Matsumura T. Inactivation of the p14(ARF), p15(INK4B) and p16(INK4A) genes is a frequent event in human oral squamous cell carcinomas. Oral Oncology. 2001 Sep;37(6):498–504. doi: 10.1016/s1368-8375(00)00142-1. [DOI] [PubMed] [Google Scholar]
- (4).Nakahara Y, Shintani S, Mihara M, Hino S, Hamakawa H. Detection of p16 promoter methylation in the serum of oral cancer patients. Int J Oral Maxillofac Surg. 2006 Apr;35(4):362–5. doi: 10.1016/j.ijom.2005.08.005. [DOI] [PubMed] [Google Scholar]
- (5).Yoo CB, Jones PA. Epigenetic therapy of cancer: past, present and future. Nat Rev Drug Discov. 2006 Jan;5(1):37–50. doi: 10.1038/nrd1930. [DOI] [PubMed] [Google Scholar]
- (6).Yang AS, Estecio MR, Doshi K, Kondo Y, Tajara EH, Issa JP. A simple method for estimating global DNA methylation using bisulfite PCR of repetitive DNA elements. Nucleic Acids Res. 2004;32(3):e38. doi: 10.1093/nar/gnh032. [DOI] [PMC free article] [PubMed] [Google Scholar]
- (7).Choi SH, Worswick S, Byun HM, Shear T, Soussa JC, Wolff EM, Douer D, Garcia-Manero G, Liang G, Yang AS. Changes in DNA methylation of tandem DNA repeats are different from interspersed repeats in cancer. Int J Cancer. 2009 Aug 1;125(3):723–9. doi: 10.1002/ijc.24384. [DOI] [PMC free article] [PubMed] [Google Scholar]
- (8).Feinberg AP. The epigenetics of cancer etiology. Semin Cancer Biol. 2004 Dec;14(6):427–32. doi: 10.1016/j.semcancer.2004.06.005. [DOI] [PubMed] [Google Scholar]
- (9).Ehrlich M. DNA methylation in cancer: too much, but also too little. Oncogene. 2002 Aug 12;21(35):5400–13. doi: 10.1038/sj.onc.1205651. [DOI] [PubMed] [Google Scholar]
- (10).Reshmi SC, Gollin SM. Chromosomal instability in oral cancer cells. J Dent Res. 2005 Feb;84(2):107–17. doi: 10.1177/154405910508400203. [DOI] [PubMed] [Google Scholar]
- (11).Shaw R. The epigenetics of oral cancer. Int J Oral Maxillofac Surg. 2006 Feb;35(2):101–8. doi: 10.1016/j.ijom.2005.06.014. [DOI] [PubMed] [Google Scholar]
- (12).Hooper SJ, Wilson MJ, Crean SJ. Exploring the link between microorganisms and oral cancer: a systematic review of the literature. Head Neck. 2009 Sep;31(9):1228–39. doi: 10.1002/hed.21140. [DOI] [PubMed] [Google Scholar]
- (13).Balkwill F, Mantovani A. Inflammation and cancer: back to Virchow? Lancet. 2001 Feb 17;357(9255):539–45. doi: 10.1016/S0140-6736(00)04046-0. [DOI] [PubMed] [Google Scholar]
- (14).Jones SA, Richards PJ, Scheller J, Rose-John S. IL-6 transsignaling: the in vivo consequences. J Interferon Cytokine Res. 2005 May;25(5):241–53. doi: 10.1089/jir.2005.25.241. [DOI] [PubMed] [Google Scholar]
- (15).Sassano P, Paparo F, Ramieri V, Colangeli W, Verdino G. Interleukine-6 (IL-6) may be a link between myasthenia gravis and myoepithelioma of the parotid gland. Med Hypotheses. 2007;68(2):314–7. doi: 10.1016/j.mehy.2006.06.057. [DOI] [PubMed] [Google Scholar]
- (16).de Oliveira MV, Fraga CA, Gomez RS, Paula AM. Immunohistochemical expression of interleukin-4, -6, -8, and -12 in inflammatory cells in surrounding invasive front of oral squamous cell carcinoma. Head Neck. 2009 Nov;31(11):1439–46. doi: 10.1002/hed.21121. [DOI] [PubMed] [Google Scholar]
- (17).Chakravarti N, Myers JN, Aggarwal BB. Targeting constitutive and interleukin-6-inducible signal transducers and activators of transcription 3 pathway in head and neck squamous cell carcinoma cells by curcumin (diferuloylmethane) Int J Cancer. 2006 Sep 15;119(6):1268–75. doi: 10.1002/ijc.21967. [DOI] [PubMed] [Google Scholar]
- (18).Duffy SA, Taylor JM, Terrell JE, Islam M, Li Y, Fowler KE, Wolf GT, Teknos TN. Interleukin-6 predicts recurrence and survival among head and neck cancer patients. Cancer. 2008 Aug 15;113(4):750–7. doi: 10.1002/cncr.23615. [DOI] [PubMed] [Google Scholar]
- (19).Calo V, Migliavacca M, Bazan V, Macaluso M, Buscemi M, Gebbia N, Russo A. STAT proteins: from normal control of cellular events to tumorigenesis. J Cell Physiol. 2003 Nov;197(2):157–68. doi: 10.1002/jcp.10364. [DOI] [PubMed] [Google Scholar]
- (20).Bromberg J, Darnell JE., Jr. The role of STATs in transcriptional control and their impact on cellular function. Oncogene. 2000 May 15;19(21):2468–73. doi: 10.1038/sj.onc.1203476. [DOI] [PubMed] [Google Scholar]
- (21).Wang YF, Chang SY, Tai SK, Li WY, Wang LS. Clinical significance of interleukin-6 and interleukin-6 receptor expressions in oral squamous cell carcinoma. Head Neck. 2002 Sep;24(9):850–8. doi: 10.1002/hed.10145. [DOI] [PubMed] [Google Scholar]
- (22).Shinriki S, Jono H, Ota K, Ueda M, Kudo M, Ota T, Oike Y, Endo M, Ibusuki M, Hiraki A, Nakayama H, Yoshitake Y, et al. Humanized anti-interleukin-6 receptor antibody suppresses tumor angiogenesis and in vivo growth of human oral squamous cell carcinoma. Clin Cancer Res. 2009 Sep 1;15(17):5426–34. doi: 10.1158/1078-0432.CCR-09-0287. [DOI] [PubMed] [Google Scholar]
- (23).Kayamori K, Sakamoto K, Nakashima T, Takayanagi H, Morita K, Omura K, Nguyen ST, Miki Y, Iimura T, Himeno A, Akashi T, Yamada-Okabe H, et al. Roles of interleukin-6 and parathyroid hormone-related peptide in osteoclast formation associated with oral cancers: significance of interleukin-6 synthesized by stromal cells in response to cancer cells. Am J Pathol. 2010 Feb;176(2):968–80. doi: 10.2353/ajpath.2010.090299. [DOI] [PMC free article] [PubMed] [Google Scholar]
- (24).Sharma M, Bairy I, Pai K, Satyamoorthy K, Prasad S, Berkovitz B, Radhakrishnan R. Salivary IL-6 levels in oral leukoplakia with dysplasia and its clinical relevance to tobacco habits and periodontitis. Clin Oral Investig. 2010 Jun 19; doi: 10.1007/s00784-010-0435-5. [DOI] [PubMed] [Google Scholar]
- (25).Vairaktaris E, Yapijakis C, Serefoglou Z, Avgoustidis D, Critselis E, Spyridonidou S, Vylliotis A, Derka S, Vassiliou S, Nkenke E, Patsouris E. Gene expression polymorphisms of interleukins-1 beta, -4, -6, -8, -10, and tumor necrosis factors-alpha, -beta: regression analysis of their effect upon oral squamous cell carcinoma. J Cancer Res Clin Oncol. 2008 Aug;134(8):821–32. doi: 10.1007/s00432-008-0360-z. [DOI] [PubMed] [Google Scholar]
- (26).Katakura A, Kamiyama I, Takano N, Shibahara T, Muramatsu T, Ishihara K, Takagi R, Shouno T. Comparison of salivary cytokine levels in oral cancer patients and healthy subjects. Bull Tokyo Dent Coll. 2007 Nov;48(4):199–203. doi: 10.2209/tdcpublication.48.199. [DOI] [PubMed] [Google Scholar]
- (27).Sahebjamee M, Eslami M, Atarbashimoghadam F, Sarafnejad A. Salivary concentration of TNFalpha, IL1 alpha, IL6, and IL8 in oral squamous cell carcinoma. Med Oral Patol Oral Cir Bucal. 2008 May;13(5):E292–E295. [PubMed] [Google Scholar]
- (28).Wehbe H, Henson R, Meng F, Mize-Berge J, Patel T. Interleukin-6 contributes to growth in cholangiocarcinoma cells by aberrant promoter methylation and gene expression. Cancer Res. 2006 Nov 1;66(21):10517–24. doi: 10.1158/0008-5472.CAN-06-2130. [DOI] [PubMed] [Google Scholar]
- (29).Fukushima N, Sato N, Sahin F, Su GH, Hruban RH, Goggins M. Aberrant methylation of suppressor of cytokine signalling-1 (SOCS-1) gene in pancreatic ductal neoplasms. Br J Cancer. 2003 Jul 21;89(2):338–43. doi: 10.1038/sj.bjc.6601039. [DOI] [PMC free article] [PubMed] [Google Scholar]
- (30).Braconi C, Huang N, Patel T. MicroRNA-dependent regulation of DNA methyltransferase-1 and tumor suppressor gene expression by interleukin-6 in human malignant cholangiocytes. Hepatology. 2010 Mar;51(3):881–90. doi: 10.1002/hep.23381. [DOI] [PMC free article] [PubMed] [Google Scholar]
- (31).Foran E, Garrity-Park MM, Mureau C, Newell J, Smyrk TC, Limburg PJ, Egan LJ. Upregulation of DNA Methyltransferase-Mediated Gene Silencing, Anchorage-Independent Growth, and Migration of Colon Cancer Cells by Interleukin-6. Mol Cancer Res. 2010 Mar 30; doi: 10.1158/1541-7786.MCR-09-0496. in press. [DOI] [PubMed] [Google Scholar]
- (32).Hodge DR, Xiao W, Clausen PA, Heidecker G, Szyf M, Farrar WL. Interleukin-6 regulation of the human DNA methyltransferase (HDNMT) gene in human erythroleukemia cells. J Biol Chem. 2001 Oct 26;276(43):39508–11. doi: 10.1074/jbc.C100343200. [DOI] [PubMed] [Google Scholar]
- (33).Cheng JC, Matsen CB, Gonzales FA, Ye W, Greer S, Marquez VE, Jones PA, Selker EU. Inhibition of DNA methylation and reactivation of silenced genes by zebularine. J Natl Cancer Inst. 2003 Mar 5;95(5):399–409. doi: 10.1093/jnci/95.5.399. [DOI] [PubMed] [Google Scholar]
- (34).Bollati V, Baccarelli A, Hou L, Bonzini M, Fustinoni S, Cavallo D, Byun HM, Jiang J, Marinelli B, Pesatori AC, Bertazzi PA, Yang AS. Changes in DNA methylation patterns in subjects exposed to low-dose benzene. Cancer Res. 2007 Feb 1;67(3):876–80. doi: 10.1158/0008-5472.CAN-06-2995. [DOI] [PubMed] [Google Scholar]
- (35).Kristensen LS, Mikeska T, Krypuy M, Dobrovic A. Sensitive Melting Analysis after Real Time-Methylation Specific PCR (SMART-MSP): high-throughput and probe-free quantitative DNA methylation detection. Nucleic Acids Res. 2008 Apr;36(7):e42. doi: 10.1093/nar/gkn113. [DOI] [PMC free article] [PubMed] [Google Scholar]
- (36).Zhang X, Guo A, Yu J, Possemato A, Chen Y, Zheng W, Polakiewicz RD, Kinzler KW, Vogelstein B, Velculescu VE, Wang ZJ. Identification of STAT3 as a substrate of receptor protein tyrosine phosphatase T. Proc Natl Acad Sci U S A. 2007 Mar 6;104(10):4060–4. doi: 10.1073/pnas.0611665104. [DOI] [PMC free article] [PubMed] [Google Scholar]
- (37).Kim BH, Cho NY, Shin SH, Kwon HJ, Jang JJ, Kang GH. CpG island hypermethylation and repetitive DNA hypomethylation in premalignant lesion of extrahepatic cholangiocarcinoma. Virchows Arch. 2009 Oct;455(4):343–51. doi: 10.1007/s00428-009-0829-4. [DOI] [PubMed] [Google Scholar]
- (38).Goel A, Xicola RM, Nguyen TP, Doyle BJ, Sohn VR, Bandipalliam P, Reyes J, Cordero C, Balaguer F, Castells A, Jover R, Andreu M, et al. Aberrant DNA Methylation in Hereditary Nonpolyposis Colorectal Cancer Without Mismatch Repair Deficiency. Gastroenterology. 2010 Jan 25; doi: 10.1053/j.gastro.2010.01.035. in press. [DOI] [PMC free article] [PubMed] [Google Scholar]
- (39).Campregher C, Luciani MG, Gasche C. Activated neutrophils induce an hMSH2-dependent G2/M checkpoint arrest and replication errors at a (CA)13-repeat in colon epithelial cells. Gut. 2008 Jun;57(6):780–7. doi: 10.1136/gut.2007.141556. [DOI] [PMC free article] [PubMed] [Google Scholar]
- (40).Kojima K, Oshita M, Nanjo Y, Kasai K, Tozawa Y, Hayashi H, Nishiyama Y. Oxidation of elongation factor G inhibits the synthesis of the D1 protein of photosystem II. Mol Microbiol. 2007 Aug;65(4):936–47. doi: 10.1111/j.1365-2958.2007.05836.x. [DOI] [PubMed] [Google Scholar]
- (41).Patel S, Kumar S, Jyoti A, Srinag BS, Keshari RS, Saluja R, Verma A, Mitra K, Barthwal MK, Krishnamurthy H, Bajpai VK, Dikshit M. Nitric oxide donors release extracellular traps from human neutrophils by augmenting free radical generation. Nitric Oxide. 2010 Apr 1;22(3):226–34. doi: 10.1016/j.niox.2010.01.001. [DOI] [PubMed] [Google Scholar]
- (42).Schwarz MA, Lazo JS, Yalowich JC, Allen WP, Whitmore M, Bergonia HA, Tzeng E, Billiar TR, Robbins PD, Lancaster JR., Jr. Metallothionein protects against the cytotoxic and DNA-damaging effects of nitric oxide. Proc Natl Acad Sci U S A. 1995 May 9;92(10):4452–6. doi: 10.1073/pnas.92.10.4452. [DOI] [PMC free article] [PubMed] [Google Scholar]
- (43).Subbalekha K, Pimkhaokham A, Pavasant P, Chindavijak S, Phokaew C, Shuangshoti S, Matangkasombut O, Mutirangura A. Detection of LINE-1s hypomethylation in oral rinses of oral squamous cell carcinoma patients. Oral Oncol. 2009 Feb;45(2):184–91. doi: 10.1016/j.oraloncology.2008.05.002. [DOI] [PubMed] [Google Scholar]
- (44).Figueiredo JC, Grau MV, Wallace K, Levine AJ, Shen L, Hamdan R, Chen X, Bresalier RS, McKeown-Eyssen G, Haile RW, Baron JA, Issa JP. Global DNA hypomethylation (LINE-1) in the normal colon and lifestyle characteristics and dietary and genetic factors. Cancer Epidemiol Biomarkers Prev. 2009 Apr;18(4):1041–9. doi: 10.1158/1055-9965.EPI-08-0926. [DOI] [PMC free article] [PubMed] [Google Scholar]
- (45).Ogino S, Kawasaki T, Nosho K, Ohnishi M, Suemoto Y, Kirkner GJ, Fuchs CS. LINE-1 hypomethylation is inversely associated with microsatellite instability and CpG island methylator phenotype in colorectal cancer. Int J Cancer. 2008 Jun 15;122(12):2767–73. doi: 10.1002/ijc.23470. [DOI] [PMC free article] [PubMed] [Google Scholar]
- (46).Thirthagiri E, Robinson CM, Huntley S, Davies M, Yap LF, Prime SS, Paterson IC. Spindle assembly checkpoint and centrosome abnormalities in oral cancer. Cancer Lett. 2007 Dec 18;258(2):276–85. doi: 10.1016/j.canlet.2007.09.008. [DOI] [PubMed] [Google Scholar]
- (47).Viswanathan M, Sangiliyandi G, Vinod SS, Mohanprasad BK, Shanmugam G. Genomic instability and tumor-specific alterations in oral squamous cell carcinomas assessed by inter-(simple sequence repeat) PCR. Clin Cancer Res. 2003 Mar;9(3):1057–62. [PubMed] [Google Scholar]
- (48).Baba S, Hara A, Kato K, Long NK, Hatano Y, Kimura M, Okano Y, Yamada Y, Shibata T. Aberrant promoter hypermethylation of the CHFR gene in oral squamous cell carcinomas. Oncol Rep. 2009 Nov;22(5):1173–9. doi: 10.3892/or_00000552. [DOI] [PubMed] [Google Scholar]
- (49).Viet CT, Schmidt BL. Methylation array analysis of preoperative and postoperative saliva DNA in oral cancer patients. Cancer Epidemiol Biomarkers Prev. 2008 Dec;17(12):3603–11. doi: 10.1158/1055-9965.EPI-08-0507. [DOI] [PubMed] [Google Scholar]
- (50).Esteller M. CpG island hypermethylation and tumor suppressor genes: a booming present, a brighter future. Oncogene. 2002 Aug 12;21(35):5427–40. doi: 10.1038/sj.onc.1205600. [DOI] [PubMed] [Google Scholar]
Associated Data
This section collects any data citations, data availability statements, or supplementary materials included in this article.
Supplementary Materials
Supplemental Figure 1: Correlation plots demonstrating reproducibility of MS-MLPA assay: The figure illustrates reproducibility of MS-MLPA assays in untreated SCC056 cells. The results from the initial MS-MLPA experiment (Run-1) are compared to repeated sequencing (Run-2, presented in Supplemental Figure 1A) and complete repetition of the MS-MLPA protocol using the same DNA (Run-3, presented in Supplemental Figure 1B). Each data point represents the methylation status of one MS-MLPA probe with ratios shown on the x-axis for Run-1 and on the y-axis for either Run-2 or Run-3. The line represents the linear trendline. MS-MLPA methylation levels were well reproducible as indicated by the significant Spearman’s correlation coefficient r=0.9701, p<0.0001 for Run-1 vs. Run-2 and r=0.8748, p<0.0001 for Run-1 vs. Run-3.