

Abstract
Background
Down syndrome (DS; trisomy 21) is the most common genetic cause of mental retardation in the human population and key molecular networks dysregulated in DS are still unknown. Many different experimental techniques have been applied to analyse the effects of dosage imbalance at the molecular and phenotypical level, however, currently no integrative approach exists that attempts to extract the common information.
Results
We have performed a statistical meta-analysis from 45 heterogeneous publicly available DS data sets in order to identify consistent dosage effects from these studies. We identified 324 genes with significant genome-wide dosage effects, including well investigated genes like SOD1, APP, RUNX1 and DYRK1A as well as a large proportion of novel genes (N = 62). Furthermore, we characterized these genes using gene ontology, molecular interactions and promoter sequence analysis. In order to judge relevance of the 324 genes for more general cerebral pathologies we used independent publicly available microarry data from brain studies not related with DS and identified a subset of 79 genes with potential impact for neurocognitive processes. All results have been made available through a web server under http://ds-geneminer.molgen.mpg.de/.
Conclusions
Our study represents a comprehensive integrative analysis of heterogeneous data including genome-wide transcript levels in the domain of trisomy 21. The detected dosage effects build a resource for further studies of DS pathology and the development of new therapies.
Background
Down syndrome (DS) is the most frequent genomic aneuploidy with an incidence of approximately 1 in 700 live-newborn [1] resulting from the presence of an extra copy of human chromosome 21 (HSA21). DS is characterized by a complex phenotype with features that are not fully penetrant. The most frequent manifestations, which are virtually always present, include mental retardation, morphological abnormalities of the head and limbs, short stature, hypotonia and hyperlaxity of ligaments. Other features occur with less frequency such as organ malformations, particularly of the heart (50% of DS newborns), several types of gastrointestinal tract obstructions or dysfunctions (4-5% of DS newborns), increased risk of leukaemia (20 × higher compared to the normal population), and early occurrence of an Alzheimer-like neuropathology [2,3]. DS has been investigated with multiple functional genomics studies aiming to understand the molecular basis underlying the various aspects of the disease [4-7].
The most commonly accepted pathogenetic hypothesis is that the dosage imbalance of genes on HSA21 is responsible for the molecular dysfunctions in DS, meaning that genes on the triplicated chromosome are overexpressed due to an extra chromosome 21, as demonstrated for selected genes like SOD1 and DYRK1A [8]. Recent global transcriptome studies with microarrays, however, have generated a more complex picture in the sense that not all HSA21 genes have an elevated expression level as expected [9,10]. An alternative hypothesis is that the phenotype is due to an unstable environment resulting from the dosage imbalance of the hundreds of genes on HSA21 which determines a non-specific disturbance of genomic regulation and expression. The significantly higher inter-individual variability in DS, as compared to euploid, individuals supports this hypothesis [11]. Moreover, the two hypotheses could be coexistent [3]. In both hypotheses it is understood that besides alterations of gene expression of HSA21 genes there are numerous genome-wide effects that lead to the dysregulation of many non-HSA21 genes through molecular pathways and interactions.
Many studies on the transcriptome and proteome levels have been conducted to understand the causal relationship between genes at dosage imbalance and DS phenotypes [12]. Gene expression profiles have been analysed from DS fetal [13] and adult human tissues [6]. Additionally, two classes of mouse models [14] have been developed for investigating the molecular genetics of DS, either mouse models with partial trisomies of the syntenic regions of HSA21 in mouse chromosomes 10, 16 or 17, such as Ts16 [15], Ts65Dn [16] and Ts1Cje mice [17], or transgenic mice for specific genes such as SOD1 [18]. Studies of gene expression profiles in human DS samples and mouse models have shown high genome-wide variability [11,19-22]. Furthermore, differences due to the applied experimental platforms, specific tissues, developmental stages or the triplicated segments under study introduce a high variation to the assessment of genome-wide effects of DS. Here, integrative and comparative studies are pivotal for the analysis of the complex nature of gene expression and regulation in DS at a more general level [2,23].
Meta-analysis was proven to be a valid strategy to extract consistent information from heterogeneous data, in particular with respect to complex phenotypes for example cancer [24], Alzheimer [25] and type-2 diabetes mellitus [26]. The purpose of meta-analysis is to compensate experiment-specific variations and to reveal consistent information across a wide range of experiments. To date, such a meta-analysis of DS data is missing.
In this paper we describe a comprehensive meta-analysis from 45 different DS studies on human and mouse on the transcriptome and proteome level including quantitative data such as Affymetrix microarrays, RT-PCR and MALDI studies as well as qualitative data such as SAGE and Western blot analyses. We applied an established computational framework [26] and identified 324 genes with consistent dosage effects in many of these studies. As expected, we observed a high fraction of HSA21 genes (N = 77) but also a large amount of non-HSA21 genes (N = 247). Besides well investigated genes in the context of DS we detected a significant proportion of novel ones (N = 62). The 324 genes were further investigated using functional information, molecular interactions and promoter analysis revealing over-represented motifs of four transcription factors: RUNX1, E2F1, STAF/PAX2 and STAT3. In order to test the relevance of the 324 genes for more general brain phenotypes we used independent publicly available data on cerebral pathologies not related to DS and identified a subset of 79 DS genes that were differentially expressed in these studies. The detected dosage effects can be used as a resource for further studies of DS pathology, functional experiments and the development of therapies. All data have been agglomerated and made available through a web server that tracks results of the meta-analysis http://ds-geneminer.molgen.mpg.de/ and that enables the community to validate any gene of interest in the light of the experimental data.
Results
Genome-Wide Dosage Effects
Genome-wide dosage effects were computed with the numerical scoring method described in Material and Methods. In total, 45 case-control experiments were interrogated (Additional file 1, Table S1), the alteration for each gene between the trisomic and normal states was scored in each experiment, gene scores were summarised across all experiments and the significance of the summarised scores was judged with a Bootstrap approach. This procedure resulted in a cut-off score value of 3.67 and identified 324 genes as being predominantly affected by DS. The thirty genes with the highest dosage effects, either on HSA21 or on other chromosomes, are listed in Table 1. The entire gene list is given in Additional file 1, Table S2.
Table 1.
Top thirty DS dosage effects on A) HSA21 and B) other chromosomes
| A) Direct effects | ||||||||
|---|---|---|---|---|---|---|---|---|
| Ensembl | HUGO | Score | Entropy | Chromo-some |
Start position |
End position |
Band | CNV |
| ENSG00000154734 | ADAMTS1 | 18.487 | 4.083 | chr21 | 28208606 | 28217728 | q21.3 | |
| ENSG00000159228 | CBR1 | 17.518 | 4.509 | chr21 | 37442239 | 37445464 | q22.12 | |
| ENSG00000159140 | SON | 15.920 | 4.712 | chr21 | 34914924 | 34949812 | q22.11 | |
| ENSG00000142168 | SOD1 | 15.817 | 4.372 | chr21 | 33031935 | 33041244 | q22.11 | |
| ENSG00000182670 | TTC3L, TTC3 | 15.637 | 4.542 | chr21 | 38445526 | 38575413 | q22.13 | |
| ENSG00000142192 | APP | 15.489 | 4.412 | chr21 | 27252861 | 27543446 | q21.3 | |
| ENSG00000159128 | IFNGR2 | 15.006 | 4.640 | chr21 | 34757299 | 34851655 | q22.11 | |
| ENSG00000182240 | BACE2 | 14.156 | 4.140 | chr21 | 42539728 | 42648524 | q22.2 | |
| ENSG00000156256 | USP16 | 13.713 | 4.378 | chr21 | 30396950 | 30426809 | q21.3 | |
| ENSG00000159131 | GART | 13.570 | 4.564 | chr21 | 34870940 | 34915797 | q22.11 | |
| ENSG00000157540 | DYRK1A | 13.163 | 4.405 | chr21 | 38739236 | 38887680 | q22.13 | |
| ENSG00000157557 | ETS2 | 13.088 | 4.440 | chr21 | 40177231 | 40196879 | q22.2 | |
| ENSG00000159231 | CBR3 | 12.185 | 3.954 | chr21 | 37507210 | 37518864 | q22.12 | YES |
| ENSG00000159082 | SYNJ1 | 11.880 | 4.284 | chr21 | 33997269 | 34100359 | q22.11 | |
| ENSG00000142188 | TMEM50B | 11.516 | 3.803 | chr21 | 34804792 | 34853499 | q22.11 | YES |
| ENSG00000159110 | IFNAR2 | 11.280 | 4.360 | chr21 | 34602206 | 34656082 | q22.11 | |
| ENSG00000157538 | DSCR3 | 11.254 | 4.316 | chr21 | 38591910 | 38640262 | q22.13 | |
| ENSG00000157601 | MX1 | 10.976 | 3.545 | chr21 | 42792231 | 42831141 | q22.3 | |
| ENSG00000159267 | HLCS | 10.764 | 4.183 | chr21 | 38123493 | 38362536 | q22.13 | YES |
| ENSG00000159200 | RCAN1 | 10.719 | 3.356 | chr21 | 35885440 | 35987441 | q22.12 | |
| ENSG00000159147 | DONSON | 10.435 | 4.295 | chr21 | 34947783 | 34961014 | q22.11 | |
| ENSG00000156261 | CCT8 | 10.361 | 4.560 | chr21 | 30428126 | 30446118 | q21.3 | |
| ENSG00000183486 | MX2 | 10.179 | 3.598 | chr21 | 42733870 | 42781317 | q22.3 | |
| ENSG00000154727 | GABPA | 9.936 | 4.032 | chr21 | 27106881 | 27144771 | q21.3 | |
| ENSG00000160200 | CBS | 9.284 | 3.907 | chr21 | 44473301 | 44497053 | q22.3 | |
| ENSG00000159216 | RUNX1 | 9.129 | 3.783 | chr21 | 36160098 | 37357047 | q22.12 | |
| ENSG00000183527 | PSMG1 | 8.903 | 3.733 | chr21 | 40546695 | 40555777 | q22.2 | |
| ENSG00000182093 | WRB | 8.837 | 4.149 | chr21 | 40752170 | 40800454 | q22.2 | |
| ENSG00000154736 | ADAMTS5 | 8.746 | 4.221 | chr21 | 28290231 | 28338832 | q21.3 | |
| ENSG00000159197 | KCNE2 | 8.654 | 3.660 | chr21 | 35736323 | 35743440 | q22.11 | YES |
| B) Indirect effects | ||||||||
| Ensembl | HUGO | Score | Entropy | Chromo-some |
Start position |
End position |
Band | CNV |
| ENSG00000117289 | TXNIP | 8.790 | 3.281 | chr1 | 145438469 | 145442635 | q21.1 | YES |
| ENSG00000133110 | POSTN | 8.301 | 2.437 | chr13 | 38136722 | 38172981 | q13.3 | YES |
| ENSG00000118785 | SPP1 | 7.232 | 3.159 | chr4 | 88896802 | 88904563 | q22.1 | |
| ENSG00000113140 | SPARC | 7.035 | 3.338 | chr5 | 151040657 | 151066726 | q33.1 | |
| ENSG00000125968 | ID1 | 6.987 | 3.164 | chr20 | 30193086 | 30194318 | q11.21 | |
| ENSG00000136235 | GPNMB | 6.943 | 2.047 | chr7 | 23275586 | 23314727 | p15.3 | |
| ENSG00000171951 | SCG2 | 6.747 | 2.950 | chr2 | 224461658 | 224467221 | q36.1 | |
| ENSG00000135821 | GLUL | 6.604 | 3.702 | chr1 | 182350839 | 182361341 | q25.3 | |
| ENSG00000123610 | TNFAIP6 | 6.575 | 2.377 | chr2 | 152214106 | 152236560 | q23.3 | |
| ENSG00000118523 | CTGF | 6.567 | 2.996 | chr6 | 132269316 | 132272513 | q23.2 | |
| ENSG00000168209 | DDIT4 | 6.477 | 3.318 | chr10 | 74033678 | 74035794 | q22.1 | |
| ENSG00000162407 | PPAP2B | 6.350 | 3.343 | chr1 | 56960419 | 57110974 | p32.2 | |
| ENSG00000038427 | VCAN | 6.240 | 2.958 | chr5 | 82767284 | 82878122 | q14.2 | |
| ENSG00000151491 | EPS8 | 6.194 | 3.143 | chr12 | 15773076 | 15942510 | p12.3 | |
| ENSG00000189067 | LITAF | 6.185 | 3.255 | chr16 | 11641582 | 11680806 | p13.13 | |
| ENSG00000164692 | COL1A2 | 6.148 | 2.852 | chr7 | 94023873 | 94060544 | q21.3 | |
| ENSG00000204388 | HSPA1B | 6.109 | 2.550 | chr6 | 31795688 | 31798031 | p21.33 | |
| ENSG00000162692 | VCAM1 | 6.012 | 2.533 | chr1 | 101185305 | 101204601 | p21.2 | |
| ENSG00000154096 | THY1 | 5.974 | 3.244 | chr11 | 119288888 | 119293854 | q23.3 | |
| ENSG00000135919 | SERPINE2 | 5.904 | 3.048 | chr2 | 224839765 | 224904036 | q36.1 | |
| ENSG00000172201 | ID4 | 5.887 | 3.037 | chr6 | 19837617 | 19840915 | p22.3 | |
| ENSG00000114315 | HES1 | 5.884 | 2.874 | chr3 | 193853934 | 193856521 | q29 | |
| ENSG00000172893 | DHCR7 | 5.883 | 3.441 | chr11 | 71145457 | 71159477 | q13.4 | |
| ENSG00000204262 | COL5A2 | 5.857 | 3.174 | chr2 | 189896622 | 190044605 | q32.2 | |
| ENSG00000149257 | SERPINH1 | 5.846 | 3.146 | chr11 | 75273170 | 75283844 | q13.5 | |
| ENSG00000176697 | BDNF | 5.805 | 2.416 | chr11 | 27676440 | 27743605 | p14.1 | |
| ENSG00000182551 | ADI1 | 5.782 | 3.081 | chr2 | 3501693 | 3523507 | p25.3 | |
| ENSG00000079739 | PGM1 | 5.661 | 3.251 | chr1 | 64058947 | 64125916 | p31.3 | |
| ENSG00000108821 | COL1A1 | 5.527 | 3.004 | chr17 | 48260650 | 48278993 | q21.33 | |
| ENSG00000187498 | COL4A1 | 5.514 | 3.396 | chr13 | 110801318 | 110959496 | q34 | |
The meta-analysis identified genes that showed consistent changes in many of the different experiments rather than genes that were affected by a single (or few) experiment(s) (Figure 1A). This is an important fact since, for example, different mouse models have different coverage of triplicated HSA21 genes, and, thus, might introduce model-specific bias [14]. The consistency of the dosage effect was measured for each gene with an entropy criterion (see Materials and Methods) and Figure 1A reveals a strong preference for the selection of high-entropy genes. Highest scores were assigned to HSA21 genes (Figure 1B) what indicates that the meta-analysis scores reflect the effect of an extra chromosome 21 on gene expression (Table 1). While proportionally most dosage effects were identified for HSA21 genes (77 out of 324), the majority of genes (247 out of 324) was located on other chromosomes highlighting the genome-wide impact of DS (Figure 1C).
Figure 1.

Characterization of dosage effects. A) Entropy (Y-axis) vs. score of dosage effect (X-axis) for all genes, B) Histogram of scores for all 255 HSA21 genes accessible with the experiments under study, C) Distribution of genomic locations of the 324 candidate genes, D) Cytogenetic location of 77 HSA21 genes that show significant dosage effects for all experiments (blue line). Additionally, the same meta-analysis approach has been conducted with human (green line) and mouse (red line) data separately. The yellow line plots the relative number of HSA21 genes within each band (gene density). Y-axis shows percentage of significant genes with respect to all genes annotated for the chromosomal band.
Genome-wide dosage effects underlined the severe phenotypic consequences of DS caused by genes with a major role in human development (Additional file 2, Figure S1). Of the 247 non-HSA21 genes, 72 were associated with development, in particular with respect to organ development (62 genes, GO:0048513), tissue development (34 genes GO:0009888) and cell development (30 genes, GO:0048468). Amongst these genes were known interactors of HSA21 genes, for example REST (RE1-silencing transcription factor). REST modulates expression of genes encoding fundamental neuronal functions including ion channels, synaptic proteins and neurotransmitter receptors and has been linked to an inherited form of mental retardation. Recently, Canzonetta et al. [5] demonstrated that the region capable of affecting REST levels, in both mouse and human cells, could be assigned to the DYRK1A locus on HSA21 which was found among the top-scoring HSA21 genes (Table 1).
TXNIP (thioredoxin interacting protein) had the highest dosage effect (8.79) of all non-HSA21 genes. It has weak association with DS yet (through S100B [27]) but could play a major role for several DS phenotypes. It is a key signalling molecule involved in glucose homeostasis [28], cardiovascular homeostasis [29] and leukaemia [30].
Enrichment of genomic location with respect to the 324 genes was observed in regions of HSA21 and the respective syntenic regions on mouse chromosomes 16, 17 and 10 (Additional file 3, Figure S2). Moreover, in the human genome, additional enrichment on chr3q24 was computed containing the genes GYG1 (glicogenin), PLOD2 (involved in bone morphogenesis), PLSCR4 and CHST2 (involved in inflammatory response in vascular endothelial cells).
Dosage Effects on HSA21
Proportionally HSA21 contributed mostly to the detected dosage effects (Figure 1C). On the other hand, it is remarkable that only a third of all HSA21 genes (77 out of 255 studied here using the Ensembl genome annotation [31]) showed consistent effects across the different experiments (see also Discussion). While 57 genes had a positive score below the significance threshold of 3.67 indicating relevance with respect to specific experiments only, 121 genes had a score near zero indicating that dosage effects were either compensated or not detected with the selected experimental data (Figure 1B).
HSA21 dosage effects included, for example APP (beta-amyloid precursor protein) involved in senile plaque formation in DS and Alzheimer's disease [3], SOD1 (superoxide dismutase 1), a key enzyme in the metabolism of oxygen-derived free radicals [3], DYRK1A (dual-specificity tyrosine-(Y)-phosphorylation regulated kinase 1A) involved in neuroblast proliferation, crucial for brain function, learning and memory [32], RUNX1 (runt-related transcription factor 1) which plays a critical role in normal hematopoiesis [33], or GABPA (GA binding protein transcription factor, alpha subunit 60 kDa) encoding a DNA binding domain with a huge variety of targets including genes from different cell/tissue specificities and functions [34]. HSA21 genes were mostly up-regulated in gene expression studies (69 out of 77) with the exception of eight genes that were either variable or down-regulated (SLC5A3, MRPS6, B3GALT6, CBS, KCNJ6, KCNJ15, CLDN14, COL18A1). Possible explanations for this observation might be tissue-specificity of gene expression as in the case of MRPS6 which was mostly up-regulated in brain samples and down-regulated in other tissues like heart or kidney, or differences in human and mouse gene expression as in the case of CBS which was up-regulated in human but down-regulated in mouse experiments what might be caused by differential tissue specificity of the orthologous mouse gene [35].
Three genomic regions on HSA21 were enriched with the significant genes using the MSigDB_c1 positional database: chr21q22, chr21q21 and chr21q11, located on the q-terminal arm (Figure 1D). This contradicts the hypothesis that a single region on HSA21 could be responsible for the molecular and phenotypic consequences of DS with only a few responsive genes [36,37]. Rather our findings support studies that identified more than one HSA21 region causative for DS phenotypes so that the dosage effects were not uniformly distributed along the chromosome but rather enriched in certain regions on HSA21 similar to the results in [38,39].
Functional Annotation Using Gene Enrichment Analysis
Functional annotation of biological pathways was retrieved from the ConsensusPathDB [40], a meta-database that summarizes the content of 22 human interaction databases. A total of 1,695 pre-defined pathways were screened with the 324 genes using gene set enrichment analysis [41]. A total of 277 pathways were found significantly enriched (family-wise error rate (FWER)<0.01) of which several pathways were associated with neurological and neuropathological processes (Table 2). These pathways referred mainly to (i) neurodegeneration (e.g. Huntington's disease, Alzheimer's disease or Parkinson's disease) and (ii) defects in synapsis (e.g. Axon guidance, NGF signaling). Furthermore, the results emphasized the role of tyrosine-kinase receptors in DS pathology (for example P75(NTR)- mediating signalling or NGF signalling via TRKA) which interact directly with BDNF (brain-derived neurotrophic factor). Moreover, our results showed gene dosage effects caused either directly by genes located on HSA21 (e.g. SOD1, APP, DONSON, TIAM1, COL6A2, ITSN1 and BACE2) or indirectly by HSA21 interactors, highlighting the intrinsic complexity of the DS pathology. For example, PIK3R1 de-regulation impacts on many of these pathways and is a direct interactor of IFNAR1, a significant DS gene. A similar effect can be observed for TPJ1A that has interactions with HSA21 genes JAM2 and CDLN8 both showing consistent dosage effects (cf. Figure 2A).
Table 2.
Enriched neuropathological pathways.
| PATHWAY (Source Database) | Pathway size |
P-value | FWER P-value | Genes on HSA21 | HSA21 Interactors | Others |
|---|---|---|---|---|---|---|
| HUNTINGTONS DISEASE (KEGG) | 159 | 0 | 0 | SOD1; DONSON | REST | BDNF; SOD2 |
| ALZHEIMERS DISEASE (KEGG) | 147 | 0 | 0 | APP; BACE2; DONSON | PPP3CA; GSK3B | CAPN2 |
| SIGNALLING BY NGF (REACTOME) | 209 | 0 | 0 | ITSN1; TIAM1 | PIK3R1; GSK3B | RPS6KA2; RAP1A; KRAS |
| AXON GUIDANCE (REACTOME) | 256 | 0 | 0 | COL6A2 | GSK3B;COL1A1; COL1A2; COL4A1; COL4A2 | COL5A2; DPYSL3; RPS6KA2; LAMB1; COL3A1; COL5A1; ALCAM; KRAS |
| PARKINSONS DISEASE (KEGG) | 105 | 0 | 0 | DONSON | UBE2G2 | |
| P75(NTR)-MEDIATED SIGNALING (PID) | 68 | 0 | 0 | APP | PIK3R1 | BDNF |
| NOTCH (NETPATH) | 61 | 0 | 0 | APP | PIK3R1; GSK3B | |
| NEUROTROPHIN SIGNALING PATHWAY (KEGG) | 121 | 0 | 0 | PIK3R1; GSK3B | BDNF; RPS6KA2; RAP1A; KRAS | |
| NGF SIGNALLING VIA TRKA FROM THE PLASMA MEMBRANE (REACTOME) | 127 | 0 | 0 | PIK3R1; GSK3B | RPS6KA2; RAP1A; KRAS | |
| MEMBRANE TRAFFICKING (REACTOME) | 87 | 0 | 0 | TJP1 | GJA1; COPG | |
| NEUROTROPHIC FACTOR-MEDIATED TRK RECEPTOR SIGNALING (PID) | 60 | 0 | 0 | TIAM1 | PIK3R1 | BDNF; RAP1A; KRAS |
| EPO SIGNALING (INOH) | 180 | 0 | 0 | PIK3R1; GSK3B | ||
| CDC42 SIGNALING EVENTS (PID) | 68 | 0 | 0 | TIAM1 | PIK3R1; GSK3B | EPS8; YES1 |
| L1CAM INTERACTIONS (REACTOME) | 93 | 0 | 0 | LAMB1; ALCAM1; RPS6KA2 |
Figure 2.
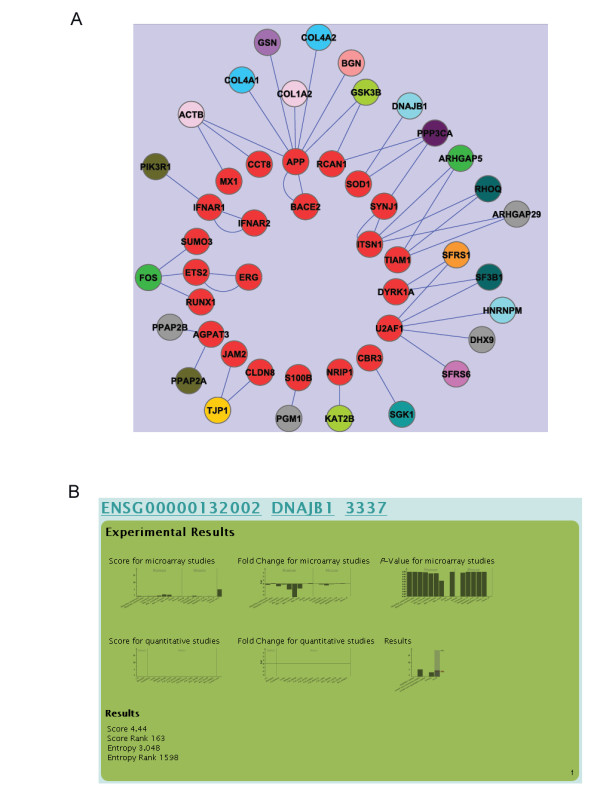
Molecular interactions of HSA21 genes. A) Interactions of HSA21 genes (red) with non-HSA21 genes (other colours). Same colours of the gene nodes refer to the same chromosome. B) Example of consistent down-regulation of DNAJB1 as a consequence of HSA21 imbalance visualized in the web browser.
Dosage Effects on Transcriptional Regulation
Dysregulation of transcriptional regulation is widely reported in DS [34]. Among the 324 significant genes were 13 transcription factors (TFs) (PSIP1, RBPJ, TCF4, HES1, ETS2, BACH1, RUNX1, GABPA, SNAI2, REST, LITAF, EGR1, FOS), 6 TFs (PSIP1, HOXC8, DLX5, HIVEP3, ZNF187, ATF6) had significant enrichment of their targets as retrieved by the TRANSFAC [42] database. Additionally, 57 TFs had significant enrichment of their interacting proteins when judged with physical interactions retrieved from the ConsensusPathDB [40]. In total, 70 different TFs were identified as being (directly or indirectly) affected by dosage imbalances. The list of TFs and their associated functional categories is given in Additional file 1, Table S3. GO categories indicate a broad impact of transcriptional regulation for neurological development, the central nervous system development (RUNX1 and TP53), nervous system development (DLX5, FOS, HES1, STAT3 and EP300), axonogenesis (DLX5, NOTCH1 and CREB1), neuron differentiation (HOXC8, NOTCH1 and RUNX1), negative regulation of neuron differentiation (HES1, NOTCH1 and REST) and regulation of long-term neuronal synaptic plasticity and learning or memory (EGR1 and JUN). Other prominent categories refer to organ development (RBPJ, ETS2, GABPA and SNAI2) and stress response (ATF6, FOS and RELA).
We further analyzed the promoter sequences of the 324 genes for enrichment of transcription factor binding sites using the AMADEUS software [43]. Significant enrichment was computed for 4 TF motifs, E2F1, RUNX1, STAF/PAX2 and STAT3 (Table 3). Enrichment was evident for RUNX1, which is among the most studied genes implicated in DS. The implication of E2F1 in DS was also previously reported [34] and could be responsible for impaired cell proliferation documented for hippocampus, cerebellum and astrocytes of DS mouse models.
Table 3.
Enriched TFBSs.
| TF | Description | Cromo-some | P-Value | Binding motif | Strand |
|---|---|---|---|---|---|
| E2F1 | E2F transcription factor 1 | chr20 | 9.3*10-18 | [C/t][C/a][G/c]C[c/a][C/g][G/c][C/T][G/c]A | - |
| RUNX1 | runt-related transcription factor 1 | chr21 | 4.0*10-18 | [C/a/t][T/a/g][G/C]{A}[G/c]{A}T[C/A][G][C/a/t/g] | + |
| STAF/ PAX2 |
paired box 2 | chr10 | 8.4*10-18 | [A/g][A/g]A[C/T/a][T/g/a][T/c][C/t][C/g][C/a] | + |
| STAT3 | signal transducer and activator of transcription 3 (acute-phase response factor) | chr17 | 8.4*10-17 | GAA[A/T][C/T]G[C/T][C/g/t][A/T][C/T/g] | + |
Binding motifs have been represented using the IUPAC nomenclature and incorporating lower case for low frequency bases.
Dosage Effects and Molecular Interactions
Molecular interactions among the 324 significant genes on HSA21 and on other chromosomes exhibited a complex network supporting the important role of physical interactions as transmitter of dosage effects (Figure 2A). The consequences of HSA21 triplication on the interacting genes was fairly stable as Figure 2B demonstrates. For example, DNAJB1 (DnaJ (Hsp40) homolog, subfamily B, member 1) and PPP3CA (protein phosphatase 3, catalytic subunit, alpha isozyme, data not shown), both interacting with SOD1, were consistently and significantly down-regulated in the human microarray experiments as the fold-changes and P-values indicate. Opposite trends were observed for TJP1 and RHOQ.
Assessing General Relevance of DS Dosage Effects for Neurological Processes
We were further interested in identifying, among the 324 genes, those which were relevant for other brain disorders. To achieve this, we interrogated 19 independent data sets derived from publicly available microarray data (Additional file 1, Table S4). These studies followed heterogeneous research questions on different cerebral pathologies and identified a total of 623 differentially expressed genes. Gene set enrichment analyses [41] with the 324 genes and the corresponding lists of differentially expressed genes were significant for 10 of these 19 studies with 79 overlapping genes (Figure 3A). Furthermore, we used the HSA21 database http://chr21.molgen.mpg.de/hsa21[4], a resource of RNA in situ hybridizations in postnatal mouse brain sections, in order to provide independent supporting evidence of brain expression of these 79 genes as shown for example for BACH1 (basic leucine zipper transcription factor 1) and TTC3 (tetratricopeptide repeat domain 3) (Figure 3B and 3C).
Figure 3.

Brain-related dosage effects. A) Venn diagram showing the overlap of the 324 significant genes with 623 genes identified by independent mouse studies related to brain phenotypes; B) RNA in situ hybridisations of BACH1 in postnatal mouse embryonic brain slices. C) In situ hybridisation of TTC3 in the same tissue. Images kindly provided by the HSA21 consortium ([4]; http://chr21.molgen.mpg.de/hsa21). D) Hierarchical clustering of 79 genes related to non-DS general brain disorders with the DS gene expression data sets. Clustering was performed with the J-Express 2009 software using Pearson correlation as similarity measure and complete linkage as update rule.
Additionally, we investigated the expression patterns of the 79 genes across the DS microarray experiments used for this meta-analysis and could identify brain-related signatures, for example, a clear up-regulation in brain tissues for the cluster containing C14orf147, IVSNS1ABP, B2M, TPJ1, SPARC, CTGF, COL4A1 and FSTL1 (Figure 3D).
Novel Dosage Effects
To identify DS-relevant "novel" dosage effects we excluded from the 324 genes (i) HSA21 genes, (ii) genes that interacted with HSA21 genes, as well as (iii) genes that were associated with DS in the literature (Table 4). Remaining candidates (N = 62) comprised BDNF-related genes (SST), MAPK-pathway genes (KRAS, IGF1R, GNG11 and RAP1A), genes related with leukemia (SFRP1) and Rho-Proteins (DHCR7 and RAB21). SST was found as co-expressed in previous studies with TAC1 [44] which is also significant in our meta-analysis and both showed a strong correlation across DS studies (Figure 4A).
Table 4.
Novel DS dosage effects
| Ensembl | HUGO | Score | Entropy | Chromo-some | Start position |
End position |
Band | CNV |
|---|---|---|---|---|---|---|---|---|
| ENSG00000133110 | POSTN | 8.301 | 2.437 | chr13 | 38136722 | 38172981 | q13.3 | YES |
| ENSG00000135919 | SERPINE2 | 5.904 | 3.048 | chr2 | 224839765 | 224904036 | q36.1 | |
| ENSG00000172893 | DHCR7 | 5.883 | 3.441 | chr11 | 71145457 | 71159477 | q13.4 | |
| ENSG00000135744 | AGT | 5.467 | 2.799 | chr1 | 230838269 | 230850043 | q42.2 | |
| ENSG00000159176 | CSRP1 | 5.424 | 3.136 | chr1 | 201452658 | 201478584 | q32.1 | |
| ENSG00000178695 | KCTD12 | 5.344 | 2.373 | chr13 | 77454312 | 77460540 | q22.3 | |
| ENSG00000183087 | GAS6 | 5.129 | 2.904 | chr13 | 114523524 | 114567046 | q34 | |
| ENSG00000164106 | SCRG1 | 5.127 | 2.728 | chr4 | 174309300 | 174320617 | q34.1 | |
| ENSG00000166923 | GREM1 | 5.073 | 1.486 | chr15 | 33010175 | 33026870 | q13.3 | YES |
| ENSG00000163754 | GYG1 | 4.933 | 3.129 | chr3 | 148709128 | 148745419 | q24 | |
| ENSG00000155380 | SLC16A1 | 4.878 | 2.927 | chr1 | 113454469 | 113499635 | p13.2 | YES |
| ENSG00000166033 | HTRA1 | 4.811 | 3.101 | chr10 | 124221041 | 124274424 | q26.13 | YES |
| ENSG00000145632 | PLK2 | 4.785 | 2.811 | chr5 | 57749809 | 57756087 | q11.2 | |
| ENSG00000115380 | EFEMP1 | 4.726 | 2.257 | chr2 | 56093102 | 56151274 | p16.1 | |
| ENSG00000060237 | WNK1 | 4.637 | 2.765 | chr12 | 862089 | 1020618 | p13.33 | YES |
| ENSG00000103888 | KIAA1199 | 4.581 | 0.885 | chr15 | 81071684 | 81244117 | q25.1 | |
| ENSG00000113810 | SMC4 | 4.462 | 3.372 | chr3 | 160117062 | 160152750 | q25.33 | |
| ENSG00000198356 | ASNA1 | 4.431 | 3.067 | chr19 | 12848306 | 12859137 | p13.2 | |
| ENSG00000122952 | ZWINT | 4.415 | 3.266 | chr10 | 58116989 | 58121036 | q21.1 | |
| ENSG00000157005 | SST | 4.401 | 1.954 | chr3 | 187386694 | 187388187 | q27.3 | |
| ENSG00000117519 | CNN3 | 4.384 | 3.253 | chr1 | 95362507 | 95392834 | p21.3 | |
| ENSG00000107104 | KANK1 | 4.352 | 2.508 | chr9 | 470291 | 746105 | p24.3 | YES |
| ENSG00000151414 | NEK7 | 4.329 | 1.848 | chr1 | 198126121 | 198291550 | q31.3 | |
| ENSG00000044574 | HSPA5 | 4.261 | 3.449 | chr9 | 127997132 | 128003609 | q33.3 | |
| ENSG00000128590 | DNAJB9 | 4.251 | 3.241 | chr7 | 108210012 | 108215294 | q31.1 | |
| ENSG00000127920 | GNG11 | 4.226 | 2.747 | chr7 | 93551011 | 93555831 | q21.3 | |
| ENSG00000008083 | JARID2 | 4.161 | 3.203 | chr6 | 15246527 | 15522253 | p22.3 | |
| ENSG00000119938 | PPP1R3C | 4.159 | 3.036 | chr10 | 93388199 | 93392858 | q23.32 | |
| ENSG00000049245 | VAMP3 | 4.146 | 3.036 | chr1 | 7831329 | 7841492 | p36.23 | |
| ENSG00000120694 | HSPH1 | 4.129 | 3.310 | chr13 | 31710762 | 31736502 | q12.3 | |
| ENSG00000168214 | RBPJ | 4.127 | 3.291 | chr4 | 26321332 | 26436753 | p15.2 | |
| ENSG00000162909 | CAPN2 | 4.111 | 3.020 | chr1 | 223889347 | 223963720 | q41 | YES |
| ENSG00000166147 | FBN1 | 4.106 | 2.070 | chr15 | 48700505 | 48937918 | q21.1 | YES |
| ENSG00000100941 | PNN | 4.081 | 3.380 | chr14 | 39644425 | 39652422 | q21.1 | |
| ENSG00000132640 | BTBD3 | 4.074 | 3.478 | chr20 | 11871371 | 11907257 | p12.2 | YES |
| ENSG00000128708 | HAT1 | 4.064 | 3.158 | chr2 | 172778958 | 172848599 | q31.1 | YES |
| ENSG00000176105 | YES1 | 4.047 | 2.855 | chr18 | 721588 | 812327 | p11.32 | |
| ENSG00000152377 | SPOCK1 | 4.025 | 3.083 | chr5 | 136310987 | 136835037 | q31.2 | |
| ENSG00000136026 | CKAP4 | 4.018 | 2.754 | chr12 | 106631659 | 106641908 | q23.3 | |
| ENSG00000198121 | LPAR1 | 3.979 | 2.858 | chr9 | 113635543 | 113800738 | q31.3 | |
| ENSG00000140443 | IGF1R | 3.951 | 3.376 | chr15 | 99192200 | 99507759 | q26.3 | |
| ENSG00000198730 | CTR9 | 3.891 | 3.310 | chr11 | 10772803 | 10801287 | p15.3 | |
| ENSG00000162616 | DNAJB4 | 3.869 | 3.035 | chr1 | 78444859 | 78483648 | p31.1 | |
| ENSG00000104332 | SFRP1 | 3.825 | 2.587 | chr8 | 41119483 | 41166992 | p11.21 | |
| ENSG00000116473 | RAP1A | 3.824 | 2.769 | chr1 | 112084840 | 112259313 | p13.2 | |
| ENSG00000172500 | FIBP | 3.804 | 3.309 | chr11 | 65651211 | 65656010 | q13.1 | YES |
| ENSG00000133703 | KRAS | 3.801 | 3.338 | chr12 | 25358182 | 25403854 | p12.1 | |
| ENSG00000163032 | VSNL1 | 3.798 | 3.099 | chr2 | 17720393 | 17838285 | p24.2 | |
| ENSG00000134684 | YARS | 3.765 | 3.431 | chr1 | 33240840 | 33283754 | p35.1 | |
| ENSG00000105854 | PON2 | 3.764 | 2.862 | chr7 | 95034179 | 95064510 | q21.3 | |
| ENSG00000148943 | LIN7C | 3.763 | 3.033 | chr11 | 27516124 | 27528303 | p14.1 | |
| ENSG00000162734 | PEA15 | 3.747 | 3.418 | chr1 | 160175127 | 160185166 | q23.2 | |
| ENSG00000103187 | COTL1 | 3.731 | 3.304 | chr16 | 84599200 | 84651683 | q24.1 | YES |
| ENSG00000198648 | STK39 | 3.722 | 3.439 | chr2 | 168810530 | 169104651 | q24.3 | |
| ENSG00000100577 | GSTZ1 | 3.713 | 2.759 | chr14 | 77787230 | 77797939 | q24.3 | |
| ENSG00000080371 | RAB21 | 3.707 | 3.312 | chr12 | 72148658 | 72181150 | q21.1 | YES |
| ENSG00000136108 | CKAP2 | 3.688 | 2.960 | chr13 | 53029495 | 53050485 | q14.3 | |
| ENSG00000066583 | ISOC1 | 3.686 | 2.655 | chr5 | 128430442 | 128449721 | q23.3 | |
| ENSG00000143420 | ENSA | 3.681 | 3.276 | chr1 | 150573327 | 150602098 | q21.3 | |
| ENSG00000114353 | GNAI2 | 3.680 | 3.138 | chr3 | 50263724 | 50296787 | p21.31 | YES |
| ENSG00000140105 | WARS | 3.671 | 2.994 | chr14 | 100800125 | 100842680 | q32.2 | |
| ENSG00000018625 | ATP1A2 | 3.670 | 2.733 | chr1 | 160085549 | 160113381 | q23.2 |
Figure 4.
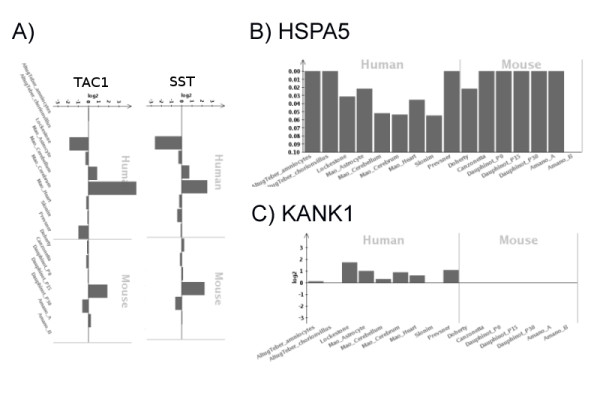
Novel DS dosage effects visualised with the web browser. A) SST and TAC1 have been previously reported as acting in a complex. The deregulated profile of these genes correlates was shown here with the fold-change view of the web browser. B) HSPA5 is a novel gene for DS implicated in neurodegeneration which is also a target of the ATF6 TF whose target set was enriched with significant genes. The histogram displays the p-values for this gene in individual studies. C) KANK1, a gene previously related with paternally inherited cerebral palsy, shows a consistent trend of up-regulation in the considered studies as shown with the fold-change view of the web browser.
Novel candidates are associated with neurodegenerative disorders including Alzheimer's disease (VSNL1), prion disease (SCRG1, HSPH1, HSPA5 (Figure 4B) and CTR9) and age-related degeneration (GAS6 and GNG11). Moreover, candidates could explain evident DS features (Additional file 1, Table S5): (i) genes related to neurogenesis and neurite outgrowth (LPAR1 [45], LIN7C, JARID2, GREM1, SERPINE2, IGFR1 and SPOCK1) that could be related with mental retardation or cognitive impairment, (ii) genes involved in synapsis (AGT, KRAS, ATP1A2, GNAI2, SST and LIN7C) (iii) cytoskeletal related proteins (KANK1 [46]; Figure 4C), CKAP2, CKAP4, HAT1, NEK7 and VAMP3), (iv) macular degeneration genes [47] or genes (HTRA1 and EFEMP1) associated with age-related visual problems [48], (v) genes (AGT, CNN3, FBN1, RBPJ, PON2, POSTN, RAP1A, WNK1 and STK39) that were related with cardiac impairments and could be candidates to explain this DS characteristic [49], and (vi) genes related with cancer (BTBD3 [50], DNAJB4 [51], FIBP [52] and GSTZ1 [53]) [54].
These examples show that the meta-analysis approach identified multiple additional genes that might be involved in DS pathology. In order to enable the community to check any particular gene of interest for DS relevance in the studies under analysis, we have agglomerated all information of the meta-analysis into a WEB-interface http://ds-geneminer.molgen.mpg.de/. Examples of possible views and information are shown in Figure 4.
Discussion
The statistical meta-analysis approach was described previously by Rasche et al. [26]. The score computed with meta-analysis correlates with entropy (Figure 1A) indicating the ability to identify general dosage effects across many experiments that might be of more phenotypic relevance than very specific ones. Additional file 4, Figures S3A and B provide an overview of the different sources of data, including two organisms (human and mouse), different tissues (brain, heart and others), different stages of development (adult, postnatal, embryonic) and different mouse models (Ts65DN, Ts1Cje, Tc1). It is per se interesting that, in spite of such heterogeneity, common dosage effects could be identified at all and it should be highlighted that whole-genome data was fairly robust across experiments. Additional file 4, Figure S3D shows the overall correlation of the quantitative values of PCR and microarray values averaged from all experiments with only few genes in the non-concordant sectors of the graph (red points).
The score used in this analysis allows detecting genes that could be either up- or down-regulated in different studies. An overview of the fold-changes for the genes across the different experiments is given in Additional file 1, Table S6. Because genes might change their expression level depending on the developmental state, tissue or because of other variables, we expected that this flexibility allows checking the hypothesis of random disturbances as well as the hypothesis of increased expression of HSA21 genes. We detected a clear enrichment of up-regulated genes on the q-terminal part of HSA21 (Figure 1D and Additional file 3, Figure S2). However, not a single region was identified but rather several smaller regions on HSA21 that agglomerate a large amount of significant dosage effects. This finding was also elaborated before (Korbel et al. [38] and Lyle R et al. [39]) using two independent data sets to characterize the molecular HSA21 regions in a set of DS-patients with partial duplications.
We studied 255 HSA21 genes matched with the probe sets from the microarrays. Of these only 77 showed consistent dosage effects (Figure 1). While 165 HSA21 genes had score values different from zero indicating response in some of the microarray studies, 90 HSA21 genes were not responsive at all and provide evidence for a strong mechanism of dosage compensation. On the other hand, these figures could also reflect the limitation of detecting reliable fold-changes of low magnitude with microarray technology. Furthermore, experiments covered only a limited amount of tissues so that it is likely that some genes were missed simply because they were not responsive in the tissues under analysis. However, having brain as the dominant whole-genome sample source this should ensure expression of most of the genes. Microarray data was focused on the Affymetrix platform in order to reduce variance arising from platform inconsistencies. We have also compared our results with additional studies including own previous research [9] and others [55] and found relevance of selected dosage effects with respect to other tissues as well (data not shown). Additional cross-validation was performed with an independent microarray data set [10]. These authors compared human lymphoblastoid cell lines derived from DS patients and normal controls with a custom-made HSA21 array. Yahya-Graison et al. [10] divided the expression ratios in four classes: class I and class II genes were significantly up-regulated, while class III and class IV genes were either compensated or showed variable response. Our meta-analysis revealed a high-degree of concordance taking into account that the cell model, platform and the methodology used were completely different. The meta-analysis scores were significantly higher for class I and II genes than for class III and IV genes (P-value <0.01, Additional file 5, Figure S4). 25 out of 39 class I-II genes revealed a significant score in our meta-analysis (75%).
In this study we monitored molecular interactions of HSA21 genes that might function as drivers of dosage effects (Figure 2A). For example, (i) TJP1 (Tight junction protein ZO-1) interacts with two HSA21 genes, JAM2 and CLDN8, (ii) FOS (FBJ murine osteosarcoma viral oncogene homolog) interacts with HSA21 genes ETS2, SUMO3, RUNX1 and indirectly with ERG, (iii) RHOQ (ras homolog gene family, member Q) interacts directly with ITSN1 and TIAM1 and indirectly with SYNJ, and (iv) PIK3R1 interacts directly with IFNAR1 and indirectly with IFNAR2. It should be emphasized that current information on molecular interactions is far from complete, thus we either might miss important interactions not yet detected and/or we might count false positive interactions due to the high error rates of current annotations of interactions.
Several of the DS genes (N = 79) extrapolated to more general neurological phenotypes (Figure 3A). The dendrogram (Figure 3D) shows further interesting profiles of these genes in the DS samples under analysis: (i) differential gene expression in the cerebellum region versus whole "brain" or cerebrum areas which has been reported in other studies (e.g. Moldrich et al. [56]), (ii) different patterns of gene expression associated to particular developmental stages (P0, P15 and P30); these changes were reported before by Dauphinot el al. [57], and (iii) differences in ES studies.
We further analyzed human and mouse studies separately and found 182 significant dosage effects using only human and 107 dosage effects using only mouse data. The Venn diagram in Additional file 4, Figure S3C clearly shows the benefit in detecting additional dosage effects when mixing the two species. Overlapping dosage effects were detected for 29 genes with both analyses (Additional file 1, Table S7). Results for the human and mouse specific analyses can be found in Additional file 1, Tables S8 and S9. It should be noted here that comparisons between human and mouse using microarrays are inherently difficult and have limitations since the probes for the orthologous mouse and human genes do not correspond well. Furthermore, gene expression variation is generally higher in human individuals compared to mouse inbred strains. Nonetheless, the 107 genes found in the analysis of mouse data (derived from the different mouse models for trisomy 21) represent a core set of genes responsive across different DS mouse models and, thus, could be highly relevant for DS pathogenesis.
In addition to genes commonly related to DS, we have identified novel genes that can be associated with DS phenotypes, in particular with neural development and neurodegeneration. To our best knowledge, this study is the first meta-analysis of genome-wide transcript levels along with other data domains in DS research. The agglomerated data can be accessed through the WEB server at http://ds-geneminer.molgen.mpg.de and the identified dosage effects are a resource for further functional testing and therapeutic development.
Conclusions
We have identified a set of 324 genes with consistent dosage effects from 45 different experiments related to DS. Since the meta-analysis was enriched with brain experiments, we were able to detect a high fraction of genes related to neuro-development, synapsis and neuro-degeneration. Moreover, our results give more information about known and new pathways related to DS and also about 62 novel candidates. The results of the meta-analysis as well as the source data have been made accessible for the community through a WEB interface.
Material and methods
Selection and integration of DS resources
Data sets were selected from heterogeneous technical platforms, different model systems (human cell lines, human tissues, mouse models) and different developmental stages (Additional file 1, Table S1). For each gene and for each source we computed a numerical value that measures its dosage effect. Data categories were either qualitative or quantitative. Qualitative data incorporated a total of 30 published manuscripts including reviews and semi-quantitative studies as well as two SAGE studies [21,58] and were summarised to one score point in order to avoid over-scoring. Here, a "1" referred to the case that the gene was found as DS relevant in one (or more) studies. Quantitative data from differential gene expression studies such as Affymetrix microarrays, RT-PCR, MALDI and other quantitatives techniques were evaluated in order to extract comparable information across the different studies. We considered Affymetrix studies that provided the raw data (CEL file level). Raw data were extracted from Gene Omnibus Expression (GEO, [59]), Array Express [60] or were retrieved from the author's web pages (in total 16 data sets including human tissues and four different mouse models (Ts65Dn, Ts1Cje, Tc1 and Ts + HSA21). Furthermore, we incorporated 18 RT-PCR and MALDI data sets for which the authors displayed the information for all genes under study (either significant or not).
Mapping of gene IDs
A central pre-requisiste of any meta-analysis approach is the consolidation of the different ID types, for example coming from different organisms and from different versions of chips. We used the Ensembl database (version 56) as the backbone annotation for all studies. IDs were mapped to human Ensembl gene IDs. Mapping and merging of the information was done within R and the BioConductor package. In total, information on 19,388 ENSEMBL genes was mapped.
Mapping SAGE IDs
Differential expressed tags were extracted from additional files of the studies. Identifiers (based on sequences) were cross-tagged with the information displayed in the updating tables (SAGEmap_Hs and SAGEmap_Mn) from the SAGE site ftp://ftp.ncbi.nlm.nih.gov/pub/sage/mappings.
Transcriptome data pre-processing and normalization
We incorporated only case-control studies in the meta-analysis in order to derive expression fold-changes. Affymetrix gene chip annotations were adapted from the latest genome annotation (version 12). Affymetrix data were normalized with GC RMA. For transcriptome case-control studies three pieces of information were stored for each gene; (i) the fold-change (DS vs. controls), (ii) the standard error of the fold-change from the replicated experiments in that study and (iii) the expression p-value (presence-call) that indicates whether or not the gene is expressed in the target samples under study. For RT-PCR and MALDI experiments we computed the fold-change of the mean expression (DS vs. controls) as well as the reported standard error of the ratio. When mean and standard variation for each group (DS and controls) was provided we calculated the ratios as well as their associated standard errors.
Scoring DS dosage effects across studies
In order to score the different categories of information such as binary counts and quantitative gene expression values, we summarized the scores of the individual experiments for each category. For microarray studies, the score of the i-th gene in the j-th study, sij, was computed as described in Rasche et al. [26]:
 |
Here rij is the fold-change, pij is the average detection p-value and eij is the standard error of the ratio derived from the experimental replicates of the study. Thus, the fold-change is weighted with its reproducibility across the experimental replicates and with the likelihood of the gene being expressed in the study's case or control samples.
For RT-PCR and MALDI studies we applied the following equation:
 |
Here rij is the fold-change and eij is the standard error of the ratio.
The total score of the gene was computed as the sum across all individual study scores.
Sampling for significance
In order to assess the significance of the overall gene scores we generated random scores by re-sampling the scores 50,000 times with replacement within the same study. Using the random distribution as background we assigned as significant those genes that were above the 99.9 percentile of the background distribution.
Judging consistency of dosage effects
For each gene, entropy of the score distribution was computed in order to quantify the relevance of the gene across many experiments. Let sij be the score of the ith gene in the jth study, then Ei is a measure for the uniformity of the score distribution over the individual experiments:
 |
High entropy is assigned to a gene if many experiments contribute to the overall score whereas low entropy is assigned if only a few experiments contribute to the overall score.
Enrichment analysis
Gene Set Enrichment Analysis (GSEA, [41]) of the 324 genes was performed with respect to pre-defined human pathways agglomerated from 22 pathway resources from the ConsensusPathDB ([40], http://cpdb.molgen.mpg.de. Over-representation analysis of TF target sets was performed with Fisher's test based on annotation from TRANSFAC [42]. Motif enrichment analyses were performed using AMADEUS [43] with significant genes as target sets and all the genes considered in the meta-analysis as background set.
Selection of independent brain experiments
In order to proof general brain relevance of the 324 genes, we collected DS-independent gene expression studies to decipher brain features, performed with Affymetrix technology and, with experiments deposited in GEO or ArrayExpress (Additional file 1, Table S4). Mostly, these experiments were performed in mouse tissues. For each study we collected one or more resulting gene lists that were evaluated using Gene Set Enrichment Analysis (GSEA, [41]) against the complete list of 19,388 genes ranked by score.
Abbreviations
DS: Down Syndrome; HSA21: human chromosome 21; TF: Transcription Factor; PCR: Polymerase Chain Reaction; RT-PCR: real-time Polymerase Chain Reaction; MALDI: Matrix-Assisted Laser Desorption/Ionization; SAGE: Serial Analysis of Gene Expression; GO: Gene Ontology; ES: Embryonic Stem Cells; ID:Identifier; GEO: Gene Omnibus Expression; GSEA: Gene Set Enrichment Analysis; CNV: Copy Number Variation; TFBS: Transcriptor Factor Binding Site
Authors' contributions
MV carried out the systematic revisions, collected the data for the meta-analysis and for the related studies. AR wrote the general code for the meta-analysis. AR and MV adjusted the code for DS study. AT created the browser which allows the results visualization, EMD carried out the transcription factor analysis. MV performed the promoter sequences' analysis and the further statistical analysis. RH conceived of the study, and participated in its design and coordination. MV, RH, HL and LAPJ contributed to the data interpretation and wrote the manuscript. All authors read and approved the final manuscript.
Supplementary Material
Supplementary tables. Table S1. Data sources used for meta-analysis. Table S2. The 324 candidate genes detected in the meta-analysis study. Table S3. Transcription factors and associated GO terms. Table S4. Cross-validation studies. Table S5. Functional annotation of novel candidates. Table S6. Fold-changes and qualitative data. Table S7. Human and mouse data overlap. Table S8. DS genes derived from meta-analysis of human data. Table S9. DS genes derived from meta-analysis of mouse data.
Figure S1. Enrichment of GO categories for organ, tissue and cell development with respect to the significant HSA21 genes (red bars), the significant non-HSA21 genes (green bars) and the non-significant genes (blue bars).
Figure S2. Genomic location of DS dosage effects in A) human B) mouse. Significant genes are marked in red, non-significant genes in white.
Figure S3. A) Categorization of the 35 qualitative studies, B) Categorization of the 34 quantitative studies. C) Venn diagram of dosage effects detected with mouse and human data alone and with the combination of all data, D) correlation between average PCR and microarray values for the detected 324 dosage effects.
Figure S4. Cross-validation with DS dosage effects detected with an HSA21 microarray [54]. Box-plots of meta-analysis scores (Y-axis) for class I and II (dosage effects) and class III and IV (compensation and variable expression) genes as judged by the authors.
Contributor Information
Mireia Vilardell, Email: nogales@molgen.mpg.de.
Axel Rasche, Email: rasche@molgen.mpg.de.
Anja Thormann, Email: thormann@molgen.mpg.de.
Elisabeth Maschke-Dutz, Email: maschke@molgen.mpg.de.
Luis A Pérez-Jurado, Email: luis.perez@upf.edu.
Hans Lehrach, Email: Lehrach@molgen.mpg.de.
Ralf Herwig, Email: herwig@molgen.mpg.de.
Acknowledgements
We want to express our gratitude to all researchers that made DS data available for the community. The free access to high quality experimental data is the necessary pre-requisite for all integrative studies. Furthermore, we apologize for all data sets that could not be integrated into the analysis because of specific constraints such as chip platforms, access to raw data etc. We thank Bernhard Herrmann for giving access to the in situ mouse brain images shown in Figure 3. We thank Marie-Laure Yaspo for discussions, James Adjaye for proof-reading of the manuscript and Reha Yildirimman and Atanas Kamburov for computational support. This work was funded by the European Commission within its 6th Framework Programme with the grant AnEUploidy (LSHG-CT-2006-037627), by the Max Planck Society and the Beatriu de Pinos postdoctoral fellowship (2008 BP-A 00184).
References
- Patterson D. Genetic mechanisms involved in the phenotype of Down syndrome. Ment Retard Dev Disabil Res Rev. 2007;13(3):199–206. doi: 10.1002/mrdd.20162. [DOI] [PubMed] [Google Scholar]
- Antonarakis SE, Epstein CJ. The challenge of Down syndrome. Trends Mol Med. 2006;12(10):473–479. doi: 10.1016/j.molmed.2006.08.005. [DOI] [PubMed] [Google Scholar]
- Rachidi M, Lopes C. Mental retardation in Down syndrome: from gene dosage imbalance to molecular and cellular mechanisms. Neurosci Res. 2007;59(4):349–369. doi: 10.1016/j.neures.2007.08.007. [DOI] [PubMed] [Google Scholar]
- Gitton Y, Dahmane N, Baik S, Ruiz i Altaba A, Neidhardt L, Scholze M, Herrmann BG, Kahlem P, Benkahla A, Schrinner S Yildirimman R, Herwig R, Lehrach H, Yaspo ML. A gene expression map of human chromosome 21 orthologues in the mouse. Nature. 2002;420(6915):586–590. doi: 10.1038/nature01270. [DOI] [PubMed] [Google Scholar]
- Canzonetta C, Mulligan C, Deutsch S, Ruf S, O'Doherty A, Lyle R, Borel C, Lin-Marq N, Delom F, Groet J, Schnappauf F, De Vita S, Averill S, Priestley JV, Martin JE, Shipley J, Denyer G, Epstein CJ, Fillat C, Estivill X, Tybulewicz VL, Fisher EM, Antonarakis SE, Nizetic D. DYRK1A-dosage imbalance perturbs NRSF/REST levels, deregulating pluripotency and embryonic stem cell fate in Down syndrome. Am J Hum Genet. 2008;83(3):388–400. doi: 10.1016/j.ajhg.2008.08.012. [DOI] [PMC free article] [PubMed] [Google Scholar]
- Lockstone HE, Harris LW, Swatton JE, Wayland MT, Holland AJ, Bahn S. Gene expression profiling in the adult Down syndrome brain. Genomics. 2007;90(6):647–660. doi: 10.1016/j.ygeno.2007.08.005. [DOI] [PubMed] [Google Scholar]
- Antonarakis SE, Lyle R, Dermitzakis ET, Reymond A, Deutsch S. Chromosome 21 and down syndrome: from genomics to pathophysiology. Nat Rev Genet. 2004;5(10):725–38. doi: 10.1038/nrg1448. [DOI] [PubMed] [Google Scholar]
- Wiseman FK, Alford KA, Tybulewicz VL, Fisher EM. Down syndrome--recent progress and future prospects. Hum Mol Genet. 2009;18(R1):R75–83. doi: 10.1093/hmg/ddp010. [DOI] [PMC free article] [PubMed] [Google Scholar]
- Kahlem P, Sultan M, Herwig R, Steinfath M, Balzereit D, Eppens B, Saran NG, Pletcher MT, South ST, Stetten G, Lehrach H, Reeves RH, Yaspo ML. Transcript level alterations reflect gene dosage effects across multiple tissues in a mouse model of down syndrome. Genome Res. 2004;14(7):1258–1267. doi: 10.1101/gr.1951304. [DOI] [PMC free article] [PubMed] [Google Scholar]
- Aït Yahya-Graison E, Aubert J, Dauphinot L, Rivals I, Prieur M, Golfier G, Rossier J, Personnaz L, Creau N, Bléhaut H, Robin S, Delabar JM, Potier MC. Classification of human chromosome 21 gene-expression variations in Down syndrome: impact on disease phenotypes. Am J Hum Genet. 2007;81(3):475–91. doi: 10.1086/520000. [DOI] [PMC free article] [PubMed] [Google Scholar]
- Chou CY, Liu LY, Chen CY, Tsai CH, Hwa HL, Chang LY, Lin YS, Hsieh FJ. Gene expression variation increase in trisomy 21 tissues. Mamm Genome. 2008;19(6):398–405. doi: 10.1007/s00335-008-9121-1. [DOI] [PubMed] [Google Scholar]
- Gardiner K, Davisson MT, Crnic LS. Building protein interaction maps for Down's syndrome. Brief Funct Genomic Proteomic. 2004;3(2):142–156. doi: 10.1093/bfgp/3.2.142. [DOI] [PubMed] [Google Scholar]
- Shin JH, Gulesserian T, Weitzdoerfer R, Fountoulakis M, Lubec G. Derangement of hypothetical proteins in fetal Down's syndrome brain. Neurochem Res. 2004;29(6):1307–1316. doi: 10.1023/b:nere.0000023617.49590.19. [DOI] [PubMed] [Google Scholar]
- Seregaza Z, Roubertoux PL, Jamon M, Soumireu-Mourat B. Mouse models of cognitive disorders in trisomy 21: a review. Behav Genet. 2006;36(3):387–404. doi: 10.1007/s10519-006-9056-9. [DOI] [PubMed] [Google Scholar]
- Gropp A, Kolbus U, Giers D. Systematic approach to the study of trisomy in the mouse. II. Cytogenet Cell Genet. 1975;14(1):42–62. doi: 10.1159/000130318. [DOI] [PubMed] [Google Scholar]
- Reeves RH, Irving NG, Moran TH, Wohn A, Kitt C, Sisodia SS, Schmidt C, Bronson RT, Davisson MT. A mouse model for Down syndrome exhibits learning and behaviour deficits. Nat Genet. 1995;11(2):177–184. doi: 10.1038/ng1095-177. [DOI] [PubMed] [Google Scholar]
- Sago H, Carlson EJ, Smith DJ, Kilbridge J, Rubin EM, Mobley WC, Epstein CJ, Huang TT. Ts1Cje, a partial trisomy 16 mouse model for Down syndrome, exhibits learning and behavioral abnormalities. Proc Natl Acad Sci USA. 1998;95(11):6256–6261. doi: 10.1073/pnas.95.11.6256. [DOI] [PMC free article] [PubMed] [Google Scholar]
- Gahtan E, Auerbach JM, Groner Y, Segal M. Reversible impairment of long-term potentiation in transgenic Cu/Zn-SOD mice. Eur J Neurosci. 1998;10(2):538–544. doi: 10.1046/j.1460-9568.1998.00058.x. [DOI] [PubMed] [Google Scholar]
- FitzPatrick DR, Ramsay J, McGill NI, Shade M, Carothers AD, Hastie ND. Transcriptome analysis of human autosomal trisomy. Hum Mol Genet. 2002;11(26):3249–3256. doi: 10.1093/hmg/11.26.3249. [DOI] [PubMed] [Google Scholar]
- Mao R, Zielke CL, Zielke HR, Pevsner J. Global up-regulation of chromosome 21 gene expression in the developing Down syndrome brain. Genomics. 2003;81(5):457–467. doi: 10.1016/S0888-7543(03)00035-1. [DOI] [PubMed] [Google Scholar]
- Chrast R, Scott HS, Papasavvas MP, Rossier C, Antonarakis ES, Barras C, Davisson MT, Schmidt C, Estivill X, Dierssen M, Pritchard M, Antonarakis SE. The mouse brain transcriptome by SAGE: differences in gene expression between P30 brains of the partial trisomy 16 mouse model of Down syndrome (Ts65Dn) and normals. Genome Res. 2000;10(12):2006–2021. doi: 10.1101/gr.10.12.2006. [DOI] [PMC free article] [PubMed] [Google Scholar]
- Saran NG, Pletcher MT, Natale JE, Cheng Y, Reeves RH. Global disruption of the cerebellar transcriptome in a Down syndrome mouse model. Hum Mol Genet. 2003;12(16):2013–2019. doi: 10.1093/hmg/ddg217. [DOI] [PubMed] [Google Scholar]
- Amano K, Sago H, Uchikawa C, Suzuki T, Kotliarova SE, Nukina N, Epstein CJ, Yamakawa K. Dosage-dependent over-expression of genes in the trisomic region of Ts1Cje mouse model for Down syndrome. Hum Mol Genet. 2004;13(13):1333–1340. doi: 10.1093/hmg/ddh154. [DOI] [PubMed] [Google Scholar]
- Rhodes DR, Chinnaiyan AM. Integrative analysis of the cancer transcriptome. Nat Genet. 2005. pp. S31–37. [DOI] [PubMed]
- Bertram L, McQueen MB, Mullin K, Blacker D, Tanzi RE. Systematic meta-analyses of Alzheimer disease genetic association studies: the AlzGene database. Nat Genet. 2007;39(1):17–23. doi: 10.1038/ng1934. [DOI] [PubMed] [Google Scholar]
- Rasche A, Al-Hasani H, Herwig R. Meta-analysis approach identifies candidate genes and associated molecular networks for type-2 diabetes mellitus. BMC Genomics. 2008;9:310. doi: 10.1186/1471-2164-9-310. [DOI] [PMC free article] [PubMed] [Google Scholar]
- Sbai O, Devi TS, Melone MA, Feron F, Khrestchatisky M, Singh LP, Perrone L. RAGE-TXNIP axis is required for S100B-promoted Schwann cell migration, fibronectin expression and cytokine secretion. J Cell Sci. 2010;123(Pt24):4332–9. doi: 10.1242/jcs.074674. [DOI] [PubMed] [Google Scholar]
- Parikh H, Carlsson E, Chutkow WA, Johansson LE, Storgaard H, Poulsen P, Saxena R, Ladd C, Schulze PC, Mazzini MJ, Jensen CB, Krook A, Björnholm M, Tornqvist H, Zierath JR, Ridderstråle M, Altshuler D, Lee RT, Vaag A, Groop LC, Mootha VK. TXNIP regulates peripheral glucose metabolism in humans. PLoS Med. 2007;4(5):e158.. doi: 10.1371/journal.pmed.0040158. [DOI] [PMC free article] [PubMed] [Google Scholar]
- Yamawaki H, Haendeler J, Berk BC. Thioredoxin: a key regulator of cardiovascular homeostasis. Circ Res. 2003;93(11):1029–1033. doi: 10.1161/01.RES.0000102869.39150.23. [DOI] [PubMed] [Google Scholar]
- Austin C. Does oxidative damage contribute to the generation of leukemia? Leuk Res. 2009;33(10):1297. doi: 10.1016/j.leukres.2009.04.038. [DOI] [PubMed] [Google Scholar]
- Flicek P, Aken BL, Ballester B, Beal K, Bragin E, Brent S, Chen Y, Clapham P, Coates G, Fairley S, Fitzgerald S, Fernandez-Banet J, Gordon L, Gräf S, Haider S, Hammond M, Howe K, Jenkinson A, Johnson N, Kähäri A, Keefe D, Keenan S, Kinsella R, Kokocinski F, Koscielny G, Kulesha E, Lawson D, Longden I, Massingham T, McLaren W, Ensembl's 10th year. Nucleic Acids Res. pp. D557–562. [DOI] [PMC free article] [PubMed]
- Dierssen M, de Lagran MM. DYRK1A (dual-specificity tyrosine-phosphorylated and -regulated kinase 1A): a gene with dosage effect during development and neurogenesis. ScientificWorldJournal. 2006;6:1911–1922. doi: 10.1100/tsw.2006.319. [DOI] [PMC free article] [PubMed] [Google Scholar]
- Edwards H, Xie C, LaFiura KM, Dombkowski AA, Buck SA, Boerner JL, Taub JW, Matherly LH, Ge Y. RUNX1 regulates phosphoinositide 3-kinase/AKT pathway: role in chemotherapy sensitivity in acute megakaryocytic leukemia. Blood. 2009;114(13):2744–2752. doi: 10.1182/blood-2008-09-179812. [DOI] [PMC free article] [PubMed] [Google Scholar]
- Gardiner K. Transcriptional dysregulation in Down syndrome: predictions for altered protein complex stoichiometries and post-translational modifications, and consequences for learning/behavior genes ELK, CREB, and the estrogen and glucocorticoid receptors. Behav Genet. 2006;36(3):439–453. doi: 10.1007/s10519-006-9051-1. [DOI] [PubMed] [Google Scholar]
- Butler C, Knox AJ, Bowersox J, Forbes S, Patterson D. The production of transgenic mice expressing human cystathionine beta-synthase to study Down syndrome. Behav Genet. 2006;36(3):429–38. doi: 10.1007/s10519-006-9046-y. [DOI] [PubMed] [Google Scholar]
- Belichenko PV, Kleschevnikov AM, Salehi A, Epstein CJ, Mobley WC. Synaptic and cognitive abnormalities in mouse models of Down syndrome: exploring genotype-phenotype relationships. J Comp Neurol. 2007;504(4):329–345. doi: 10.1002/cne.21433. [DOI] [PubMed] [Google Scholar]
- Ronan A, Fagan K, Christie L, Conroy J, Nowak NJ, Turner G. Familial 4.3 Mb duplication of 21q22 sheds new light on the Down syndrome critical region. J Med Genet. 2007;44(7):448–451. doi: 10.1136/jmg.2006.047373. [DOI] [PMC free article] [PubMed] [Google Scholar]
- Korbel JO, Tirosh-Wagner T, Urban AE, Chen XN, Kasowski M, Dai L, Grubert F, Erdman C, Gao MC, Lange K, Sobel EM, Barlow GM, Aylsworth AS, Carpenter NJ, Clark RD, Cohen MY, Doran E, Falik-Zaccai T, Lewin SO, Lott IT, McGillivray BC, Moeschler JB, Pettenati MJ, Pueschel SM, Rao KW, Shaffer LG, Shohat M, Van Riper AJ, Warburton D, Weissman S. et al. The genetic architecture of Down syndrome phenotypes revealed by high-resolution analysis of human segmental trisomies. Proc Natl Acad Sci USA. 2009;106(29):12031–12036. doi: 10.1073/pnas.0813248106. [DOI] [PMC free article] [PubMed] [Google Scholar]
- Lyle R, Béna F, Gagos S, Gehrig C, Lopez G, Schinzel A, Lespinasse J, Bottani A, Dahoun S, Taine L, Doco-Fenzy M, Cornillet-Lefèbvre P, Pelet A, Lyonnet S, Toutain A, Colleaux L, Horst J, Kennerknecht I, Wakamatsu N, Descartes M, Franklin JC, Florentin-Arar L, Kitsiou S, Aït Yahya-Graison E, Costantine M, Sinet PM, Delabar JM, Antonarakis SE. Genotype-phenotype correlations in Down syndrome identified by array CGH in 30 cases of partial trisomy and partial monosomy chromosome 21. Eur J Hum Genet. 2009;17(4):454–66. doi: 10.1038/ejhg.2008.214. [DOI] [PMC free article] [PubMed] [Google Scholar]
- Kamburov A, Wierling C, Lehrach H, Herwig R. ConsensusPathDB--a database for integrating human functional interaction networks. Nucleic Acids Res. 2009. pp. D623–628. [DOI] [PMC free article] [PubMed]
- Subramanian A, Kuehn H, Gould J, Tamayo P, Mesirov JP. GSEA-P: a desktop application for Gene Set Enrichment Analysis. Bioinformatics. 2007;23(23):3251–3253. doi: 10.1093/bioinformatics/btm369. [DOI] [PubMed] [Google Scholar]
- Wingender E, Kel AE, Kel OV, Karas H, Heinemeyer T, Dietze P, Knuppel R, Romaschenko AG, Kolchanov NA. TRANSFAC, TRRD and COMPEL: towards a federated database system on transcriptional regulation. Nucleic Acids Res. 1997;25(1):265–268. doi: 10.1093/nar/25.1.265. [DOI] [PMC free article] [PubMed] [Google Scholar]
- Linhart C, Halperin Y, Shamir R. Transcription factor and microRNA motif discovery: the Amadeus platform and a compendium of metazoan target sets. Genome Res. 2008;18(7):1180–1189. doi: 10.1101/gr.076117.108. [DOI] [PMC free article] [PubMed] [Google Scholar]
- Choi KH, Elashoff M, Higgs BW, Song J, Kim S, Sabunciyan S, Diglisic S, Yolken RH, Knable MB, Torrey EF, Webster MJ. Putative psychosis genes in the prefrontal cortex: combined analysis of gene expression microarrays. BMC Psychiatry. 2008;8:87. doi: 10.1186/1471-244X-8-87. [DOI] [PMC free article] [PubMed] [Google Scholar]
- Choi JW, Herr DR, Noguchi K, Yung YC, Lee CW, Mutoh T, Lin ME, Teo ST, Park KE, Mosley AN, Chun J. LPA receptors: subtypes and biological actions. Annu Rev Pharmacol Toxicol. pp. 157–186. [DOI] [PubMed]
- Kakinuma N, Zhu Y, Wang Y, Roy BC, Kiyama R. Kank proteins: structure, functions and diseases. Cell Mol Life Sci. 2009;66(16):2651–2659. doi: 10.1007/s00018-009-0038-y. [DOI] [PMC free article] [PubMed] [Google Scholar]
- Allikmets R, Dean M. Bringing age-related macular degeneration into focus. Nat Genet. 2008;40(7):820–821. doi: 10.1038/ng0708-820. [DOI] [PubMed] [Google Scholar]
- Esbensen AJ. Health conditions associated with aging and end of life of adults with Down syndrome. Int Rev Res Ment Retard. 2010;39(C):107–126. doi: 10.1016/S0074-7750(10)39004-5. [DOI] [PMC free article] [PubMed] [Google Scholar]
- Vis JC, Duffels MG, Winter MM, Weijerman ME, Cobben JM, Huisman SA, Mulder BJ. Down syndrome: a cardiovascular perspective. J Intellect Disabil Res. 2009;53(5):419–25. doi: 10.1111/j.1365-2788.2009.01158.x. [DOI] [PubMed] [Google Scholar]
- Damgaard T, Knudsen LM, Dahl IM, Gimsing P, Lodahl M, Rasmussen T. Regulation of the CD56 promoter and its association with proliferation, anti-apoptosis and clinical factors in multiple myeloma. Leuk Lymphoma. 2009;50(2):236–246. doi: 10.1080/10428190802699332. [DOI] [PubMed] [Google Scholar]
- Wang CC, Tsai MF, Dai TH, Hong TM, Chan WK, Chen JJ, Yang PC. Synergistic activation of the tumor suppressor, HLJ1, by the transcription factors YY1 and activator protein 1. Cancer Res. 2007;67(10):4816–4826. doi: 10.1158/0008-5472.CAN-07-0504. [DOI] [PubMed] [Google Scholar]
- Li W, Wang C, Juhn SK, Ondrey FG, Lin J. Expression of fibroblast growth factor binding protein in head and neck cancer. Arch Otolaryngol Head Neck Surg. 2009;135(9):896–901. doi: 10.1001/archoto.2009.121. [DOI] [PMC free article] [PubMed] [Google Scholar]
- Hayes JD, Flanagan JU, Jowsey IR. Glutathione transferases. Annu Rev Pharmacol Toxicol. 2005;45:51–88. doi: 10.1146/annurev.pharmtox.45.120403.095857. [DOI] [PubMed] [Google Scholar]
- Xavier AC, Ge Y, Taub JW. Down syndrome and malignancies: a unique clinical relationship: a paper from the 2008 william beaumont hospital symposium on molecular pathology. J Mol Diagn. 2009;11(5):371–80. doi: 10.2353/jmoldx.2009.080132. [DOI] [PMC free article] [PubMed] [Google Scholar]
- Reymond A, Marigo V, Yaylaoglu MB, Leoni A, Ucla C, Scamuffa N, Caccioppoli C, Dermitzakis ET, Lyle R, Banfi S, Eichele G, Antonarakis SE, Ballabio A. Human chromosome 21 gene expression atlas in the mouse. Nature. 2002;5;420(6915):582–6. doi: 10.1038/nature01178. [DOI] [PubMed] [Google Scholar]
- Moldrich RX, Dauphinot L, Laffaire J, Rossier J, Potier MC. Down syndrome gene dosage imbalance on cerebellum development. Prog Neurobiol. 2007;82(2):87–94. doi: 10.1016/j.pneurobio.2007.02.006. [DOI] [PubMed] [Google Scholar]
- Dauphinot L, Lyle R, Rivals I, Dang MT, Moldrich RX, Golfier G, Ettwiller L, Toyama K, Rossier J, Personnaz L, Antonarakis SE, Epstein CJ, Sinet PM, Potier MC. The cerebellar transcriptome during postnatal development of the Ts1Cje mouse, a segmental trisomy model for Down syndrome. Hum Mol Genet. 2005;14(3):373–384. doi: 10.1093/hmg/ddi033. [DOI] [PubMed] [Google Scholar]
- Sommer CA, Pavarino-Bertelli EC, Goloni-Bertollo EM, Henrique-Silva F. Identification of dysregulated genes in lymphocytes from children with Down syndrome. Genome. 2008;51(1):19–29. doi: 10.1139/G07-100. [DOI] [PubMed] [Google Scholar]
- Barrett T, Troup DB, Wilhite SE, Ledoux P, Rudnev D, Evangelista C, Kim IF, Soboleva A, Tomashevsky M, Marshall KA, Phillippy KH, Sherman PM, Muertter RN, Holko M, Ayanbule O, Yefanov A, Soboleva A. NCBI GEO: archive for high-throughput functional genomic data. Nucleic Acids Res. 2009. pp. D885–890. [DOI] [PMC free article] [PubMed]
- Parkinson H, Kapushesky M, Kolesnikov N, Rustici G, Shojatalab M, Abeygunawardena N, Berube H, Dylag M, Emam I, Farne A, Holloway E, Lukk M, Malone J, Mani R, Pilicheva E, Rayner TF, Rezwan F, Sharma A, Williams E, Bradley XZ, Adamusiak T, Brandizi M, Burdett T, Coulson R, Krestyaninova M, Kurnosov P, Maguire E, Neogi SG, Rocca-Serra P, Sansone SA, ArrayExpress update--from an archive of functional genomics experiments to the atlas of gene expression. Nucleic Acids Res. 2009. pp. D868–872. [DOI] [PMC free article] [PubMed]
Associated Data
This section collects any data citations, data availability statements, or supplementary materials included in this article.
Supplementary Materials
Supplementary tables. Table S1. Data sources used for meta-analysis. Table S2. The 324 candidate genes detected in the meta-analysis study. Table S3. Transcription factors and associated GO terms. Table S4. Cross-validation studies. Table S5. Functional annotation of novel candidates. Table S6. Fold-changes and qualitative data. Table S7. Human and mouse data overlap. Table S8. DS genes derived from meta-analysis of human data. Table S9. DS genes derived from meta-analysis of mouse data.
Figure S1. Enrichment of GO categories for organ, tissue and cell development with respect to the significant HSA21 genes (red bars), the significant non-HSA21 genes (green bars) and the non-significant genes (blue bars).
Figure S2. Genomic location of DS dosage effects in A) human B) mouse. Significant genes are marked in red, non-significant genes in white.
Figure S3. A) Categorization of the 35 qualitative studies, B) Categorization of the 34 quantitative studies. C) Venn diagram of dosage effects detected with mouse and human data alone and with the combination of all data, D) correlation between average PCR and microarray values for the detected 324 dosage effects.
Figure S4. Cross-validation with DS dosage effects detected with an HSA21 microarray [54]. Box-plots of meta-analysis scores (Y-axis) for class I and II (dosage effects) and class III and IV (compensation and variable expression) genes as judged by the authors.