

Abstract
Identification and characterization of underlying genetic aberrations could facilitate diagnosis and treatment of ovarian cancer. Copy number analysis using array Comparative Genomic Hybridization (aCGH) on 93 primary ovarian tumors identified PI3K/AKT pathway as the most frequently altered cancer related pathway. Furthermore, survival analyses to correlate gene copy number and mutation data with patient outcome showed that copy number gains of PIK3CA, PIK3CB and PIK3R4 in these tumors were associated with decreased survival. To confirm these findings at the protein level, immunohistochemistry (IHC) for PIK3CA product p110α and p-Akt was performed on tissue microarrays from 522 independent serous ovarian cancers. Overexpression of either of these two proteins was found to be associated with decreased survival. Multivariant analysis from these samples further showed that overexpression of p-AKT and /or p110α is an independent prognostic factor for these tumors. siRNAs targeting altered PI3K/AKT pathway genes inhibited proliferation and induced apoptosis in ovarian cancer cell lines. In addition, the effect of the siRNAs in different cell lines seemed to correlate with the particular genetic alterations that the cell line carries. These results strongly support the utilization of PI3K pathway inhibitors in ovarian cancer. They also suggest identifying the specific component in the PI3K pathway that is genetically altered has the potential to help select the most effective therapy. Both mutation as well as copy number changes can be used as predictive markers for this purpose.
INTRODUCTION
Epithelial ovarian cancer is the leading cause of death from gynecological malignancies and the fifth most common malignancy among American women, with an overall survival rate as low as 30%. Many genetic changes are involved in the development and progression of ovarian cancer. Identifying these genetic defects will improve our understanding of molecular mechanisms for ovarian cancer, and may contribute to improved detection, prognostication and therapy. Array comparative genomic hybridization (aCGH) detects DNA copy number alterations and is widely used to identify genomic regions that may harbor oncogenes or tumor suppressor genes in cancer (Pinkel and Albertson 2005). However, as pathways rather than individual genes govern the course of tumorigenesis (Vogelstein and Kinzler 2004), it is useful to analyze genes in the context of biological pathways in order to clarify the molecular mechanism underpinning cancer development.
The significance of the PI3K/AKT pathway in ovarian cancer has been reported previously (Lu, et al. 2003; Mills, et al. 2001; Vivanco and Sawyers 2002); Genetic evidence of deregulation of PI3K/AKT signaling in ovarian cancer includes gain-of-function mutations and amplifications of PI3K genes, amplification of AKT2, and allelic imbalance and mutations in PTEN. However, multiple signaling pathways are involved in ovarian cancer (Bell 2005; Nicosia, et al. 2003). Thus, in order to develop effective therapeutic strategies it is necessary to dissect the relative contribution of various pathways. In this study, we identified genomic regions harboring the most frequent DNA copy number changes in a panel of 93 primary ovarian cancers. The specific genetic copy number aberrations in these regions were analyzed in the context of signaling pathways and evaluated for associations with clinical outcome. Finally, we investigated the effectiveness of inhibiting the PI3K/AKT pathway in ovarian cancer cell lines with specific genetic alterations using siRNA knockdown as a surrogate for targeted therapy.
MATERIALS AND METHODS
Tissues
A total of 93 fresh frozen (set 1) and 522 archival ovarian tumors (set 2) were analyzed. The frozen tumors were used for aCGH and PI3KCA mutation analysis and were collected at University of Pennsylvania and University of Turin, Italy. The independent set of 522 archival tumors were used for tissue-array analysis and were collected at Helsinki University Central Hospital. Clinical outcome data were available on 55/93 tumors in set 1 and all of the archival samples in set 2.
For aCGH and the initial survival analysis, 93 tumors (Set I) were immediately snap-frozen and stored at −80 °C. Hematoxylin-eosin (H&E) staining was performed and the tissue was analyzed by a study pathologist for confirmation of the percentage of malignant tissue in the block. Only tissues with more than 70% tumor cells were used in the study. 10 µm sections were treated with Proteinase K digestion followed by phenol-chloroform extraction to achieve an optimal quality of genomic DNA (ODA260/A280 >1.70).
Cell Lines and Cell Culture
Four ovarian cancer cell lines: A2008, OVCAR8, UPN251 and OVCAR10 and two immortalized normal human ovarian surface epithelium (HOSE) cell lines were used. All cancer cell lines were cultured in Dulbecco’s modified Eagle’s medium (Invitrogen, Carlsbad, CA) supplemented with 10% fetal bovine serum 2mM L-glutamine, 100 U/ml penicillin and 0.1 mg/ml streptomycin (all from Invitrogen) in a humidified, 5% CO2 incubator at 37°C. HOSE cells were generously provided by Dr. Birrer (IOSE6) and Dr. Auersperg (HOSE398). Immortalized HOSEs were cultured in 1:1 media 199/MCDB 105 (Sigma, St. Louis, MO) supplemented with 15% fetal bovine serum.
Array CGH
Array construction and hybridization protocols have been described previously (Greshock, et al. 2007). This assay is composed of ~4,100 bacterial artificial chromosome (BAC) clones spaced in ~1 Mb intervals across the genome (Greshock, et al. 2004). Upon construction, a specific effort was made to cover known cancer genes (n = ~400). Prior to printing on commercially available microarray slides, BAC clone DNA was isolated, amplified, lyophilized and then resuspended in 50% DMSO. Briefly, genomic DNA was isolated from frozen tumors or cultured cells by overnight digestion, phenol-chloroform extraction and ethanol precipitation. One µg of tumor and reference DNA were labeled with Cy3 or Cy5, respectively (Amersham, Piscataway, NJ) using the BioPrime random-primed labeling kit (Invitrogen, Carlsbad, CA). In parallel experiments, tumor DNA and reference DNA were labeled with the opposite dye, in order to account for difference in dye incorporation and provide additional data for analysis. Labeled tumor and reference DNA were combined and precipitated with human Cot-1 DNA to reduce non-specific binding. DNA was resuspended and hybridized to the array for 72h at 37°C on a rotating platform. Images were scanned with an Axon 4500 microarray scanner (Axon, Union City, CA) and analyzed with GenePix software (Axon). For each sample, copy number estimates were made by the CBS method using the DNAcopy package in R programming language (Olshen, et al. 2004). The purpose of this method is to reduce noise and translate intensity measurements into regions of contiguous copy number. All samples were run in duplicate. Per the algorithmic requirements of CBS, copy number alterations must be represented by a minimum of two clones. A segmental log2 Cy3/Cy5 ratio cutoff of ± 0.25 was used for calling regional gains and losses. Using this approach, copy number alterations scored by single clones, when concordant between experiments, will be correctly identified as such.
Pathway Analysis for DNA Copy Number Alterations
The pathway visualization tool GenMAPP was used to evaluate copy number aberrations in nine signaling pathways. Only genes that were gained or had lost at least one copy in at least 15% of samples were included for the analysis. The frequencies of gains or losses of genes across the sample set were used as the indicator of “signal strength”.
Pathway Analysis for Expression Microarray Data
Pathway analysis for ovarian cancer expression data was performed using the Ingenuity Pathway Analysis software. Two publically available sets of data were analyzed. The first dataset is from Welsh et al (Welsh, et al. 2001) (22 tumors and 4 normal tissues, after excluding tumors with less than 30% of cancer cells); the second data set was obtained from the GEO database (Accession # GSE6008, 41 serous tumors and 4 normal ovaries). Significantly differentially expressed genes between ovarian tumors and normal tissues (p<0.05) from both sets were imported into the Ingenuity Pathway Analysis software to access the significance of canonical pathways in each dataset.
Mutational Analyses of PIK3CA in Ovarian Tumors
Genomic DNA was isolated from fresh frozen tumor specimens. Primer sequences for PIK3CA were published previously (Nakayama, et al. 2006; Samuels, et al. 2004). PCR was performed using GoTaq Green master mix (Promega-Madison, WI) and standard conditions. PCR fragments were cleaned with QIAquick® PCR Purification Kit (Qiagen Inc., Valencia, CA) and sequenced utilizing an ABI 3100A capillary genetic analyzer (Applied Biosystems, Foster City, CA) and analyzed in both sense and antisense directions for the presence of heterozygous mutations. Analysis of the DNA sequence was performed using Sequencher® v4.5 (Gene Codes Corp., Ann Arbor, MI) followed by visual analysis of each electropherogram by two independent reviewers. Appropriate positive and negative controls were included for each of the exons evaluated.
Quantitative Real-Time PCR
We validated the aCGH data with quantitative PCR of PIK3CA, the most frequently gained gene in the PI3K/AKT pathway in this sample set. TaqMan primers and probes labeled with FAM and TAMRA were designed using Primer Express software (Applied Biosystems, Foster City, CA) and synthesized by ABI. The data were collected using the Applied Biosystems Prism 7900HT Sequence Detection System, analyzed with SDS v2.1 and Excel (Microsoft Corp., Redmond, WA, USA). DNA copy number was calculated relative to TBP (TATA box binding protein; mapping to 6q27), which is relatively stable at DNA level in human cancers determined by the aCGH data in this study. The correlation between aCGH segmented data and quantitative PCR copy number in 42 ovarian tumors with available DNA was 0.76 for PIK3CA. Primers and probes used were:
PIK3CA-QF: 5’ GGATTCCACACTGCACTGTTAATAA 3’
PIK3CA-QR: 5’ TGCTGTTCATGGATTGTGCAA 3’
PIK3CA-QP: 5’ FAM TCCTATGCAATCGGTCTTTGCCTGCT TAMARA 3’
TBP-QF: 5’ GGTGGTGTTGTGAGAAGATGGA 3’
TBP-QR: 5’ GGCACTTACAGAAGGGCATCA 3’
TBP-QP: 5’ FAM CTGGTGCCACACCCTGCAACTCAA TAMARA 3’
Tissue Microarray Construction
The tissue microarrays were constructed as described previously (Kononen, et al. 1998). Briefly, tumor and normal tissues were embedded in paraffin and five-µm sections stained with H&E were obtained to select representative areas for biopsies. Core tissue biopsy specimens (diameter 0.8 mm) were taken from these areas of individual donor paraffin blocks and precisely arrayed into a new recipient paraffin block with a custom-built instrument (Beecher Instruments, Silver Spring, MD). Tissue specimens from 34 normal ovarian and 23 normal fallopian tube (normal equivalent of serous epithelium) samples and 522 serous ovarian carcinomas were arranged in six recipient paraffin blocks. Four core tissue biopsies were obtained from each specimen. The presence of tumor tissue on the arrayed samples was verified on the H&E stained section.
Immunohistochemistry
Five-µm-thick sections were cut from each block on coated slides and dried overnight at 37 °C. The sections were deparaffinized in xylene and rehydrated through graded concentrations of ethanol to distilled water, and then boiled in citrate buffer (pH 6.0) in microwave oven for 20 min. Primary antibodies incubated for 1 hour at room temperature were: polyclonal rabbit anti-PI3Kinase p110α (#4254, dilution 1:25) and monoclonal rabbit anti-phospho-Akt (#3787, dilution 1:25). Both antibodies came from Cell Signaling Technology (MA, USA). The procedure was performed in a TechMate 500 automated machine (DAB detection kit; Dako ChemMate) and the sections were lightly counterstained with Mayer’s hematoxylin. The background for phosho-Akt staining was measured by incubating the primary antibody with blocking peptide (#1140, Cell Signaling Technology, MA, USA) and the background for PI3Kinase p110α staining was meansured by omitting the primary antibody in the staining solution. The staining results were interpreted as follows: staining corresponding to that seen in the epithelium of the Fallopian tube (normal serous epithelium) was considered as normal and staining intensity exceeding this was considered as elevated. The reader of staining intensity was blinded to the clinical outcome data.
Survival Analysis
Survival analysis was performed using the Kaplan-Meier survival curves with MedCalc software (MedCalc Software, Mariakerke, Belgium) and compared with the use of log-rank statistics. A p-value <0.05 was regarded significant. A Cox Proportional Hazards Model was used to identify independent prognostic factors for overall survival in the 522 patients in set 2. The study consisted of 522 patients treated for serous ovarian carcinoma at the Department of Obstetrics and Gynecology of the Helsinki University Central Hospital between 1964–2000 (median of recruitment 1989). The serous histology of all carcinomas had originally been determined by a gynecological pathologist and was verified by one of the authors (R.B.). The clinical information of the patients was extracted from the hospital records, and additional survival information was obtained from the Population Register Centre, where all death certificates are collected in Finland. To be included in the study, data of primary treatment and the survival status of the patient were required. In 406 (78%) of the 522 patients included in the study, total abdominal hysterectomy and bilateral salpingo-ophorectomy were performed along with surgical removal of tumor masses, and in 173 of these also pelvic and/or para-aortic lymphadenectomy was performed. In 61 (12%) cases uni- or bilateral salpingo-ophorectomy was performed, and in 55 (10%) cases only biopsies were obtained in the primary surgery. The tumor samples for the study were obtained from the primary surgery before patients recieved any chemotherapy. In 347 cases (66%) platinum-based combination therapy was given as first-line chemotherapy, and in 101 of these cases paclitaxel was given in combination with platinum compound. In 104 (20%) cases, the patient recieved other than platinum-based chemotherapy and/or radiotherapy, and in 71 (14%) cases no adjuvant therapy was given. Ovarian carcinoma specific overall survival was calculated from the date of diagnosis to death from ovarian carcinoma. Patients who died of intercurrent causes or were alive at follow-up were censored. The median follow-up of patients alive at the end of the study period was 5.2 years (range, 0.4 to 36.1 years). The 5-year overall survival rate for the whole cohort was 49% (95% CI, 44%–53%).
RNA Interference/ Transfection of Synthetic siRNA
Synthetic SMARTpool reagent siRNA targeting human AKT1, AKT2, PIK3CA, PIK3CB, and PIK3R1 (Dharmacon, Chicago, IL) or appropriate siCONTROL non-targeting siRNAs (Dharmacon) were transfected into cultured cells. Transfection was performed using HiPerfect transfection reagent (Qiagen) following the manufacturer’s instructions. Ovarian cancer cell lines were cultured in 6-well plates in antibiotics-free 10% fetal bovine serum plus medium. Upon 70~80% confluency, transfection of siRNAs at 100 nM was performed. Triplicate transfection was performed for each experiment group and the experiment was repeated at least two additional times. Total protein was extracted to confirm decreased expression of target genes by western blot 72 hours after transfection. The specificity of siRNA knock-down experiments was also tested with western blot using the antibody to other isoforms of the target proteins. For proliferation and apoptosis assays, cells were counted and plated in 96-well plates at 3000cell/well and cultured for 24 additional hours after the initial 72-hr transfection and subjected to the experiments.
Protein Isolation and Western Blot
Total protein from cell lines was extracted with M-PER mammalian protein extraction reagent (PIERCE, Rorkford, IL). Ten micrograms of total protein was electrophoresed in a 4–20% SDS-PAGE gel, transferred to a PVDF membrane (Millipore, Billerica, MA) in a Trans-Blot SD Semi-Dry Electrophoretic Transfer Cell (Bio-Rad, Hercules, CA) at 15 V for 30 min, blocked for 2 h at room temperature with 5% skim milk in Tris-buffered saline containing 0.05% Tween 20 (TTBS) and incubated overnight with primary antibodies diluted according to the manufacturer’s protocols. Antibodies to Akt1, Akt2, phospho-Akt and β-actin were obtained from Cell Signaling Technology (Danvers, MA); to p85α was obtained from Upstate (Charlottesville, VA); to p110α was obtained from BD Pharmingen (San Diego, CA); to p110β (S-19) was obtained from Santa Cruz Biotechnology (Santa Cruz, CA). The membrane was then probed with secondary peroxidase-conjugated anti-mouse or anti-rabbit antibodies (1:2,000 dilution in TTBS, Cell Signaling, Danvers, MA) for 1 h and developed with a LumiGLO detection kit (Cell Signaling) according to the manufacturers’ protocols.
Cell Proliferation Assay (MTT)
After siRNA transfection, cell viability was measured using the Cell Proliferation Kit I (MTT) (Roche, Indianapolis, IN) following the manufacturer’s protocol. Briefly, 10µl of MTT (3-[4,5-dimethylthiazol-2-yl]-2,5-diphenyl tetrazolium bromide) labeling reagent (5 mg/ml MTT in PBS) was added to each well of the 96-well plates and the cells were incubated for 4 hr at 37°C. Then, 100µl of solubilization solution (DMSO) was added and the plate was further incubated for 24 hours at 37°C to dissolve the formazan crystals. The optical density was measured at a wavelength of 570 nm on a Labsystem multiskan microplate reader (Merck Eurolab, Dietikon, Schweiz). Results represented the OD ratio between the cells transfected with targeting siRNA or control siRNA.
Histone/DNA ELISA for Detection of Apoptosis
Quantification of apoptotic cell death after siRNA transfection was determined by a ‘Cell Death Detection ELISA’ kit that measures cytoplasmic histone-DNA fragments produced during apoptosis following manufacturer’s protocol (Cat. Number 11 544 675 001, Roche, Indianapolis, IN). Cells cultured in the 96-well plates were centrifuged (200g) for 10 min, the supernatant was discarded, and lysis buffer was added. After lysis, the samples were centrifuged and 20µl of the supernatant was transferred to a strepavidin-coated microtitre plate. Anti-histone biotin and anti-DNA peroxidase antibodies were added to each well, and the plate was incubated at room temperature for 2 h. After three washes with buffer, the peroxidase substrate was added to each well. Following a 5-min incubation, the plates were read at 405 nm in a Labsystem multiskan microplate reader (Merck Eurolab, Dietikon, Schweiz). The enrichment of histone-DNA fragments is expressed as fold increase in absorbance as compared with negative-control siRNA transfection.
RESULTS
Pathway analysis of ovarian cancer aCGH data reveals frequent genetic aberrations in the PI3K/AKT pathway
Ninety-three frozen ovarian cancer specimens (Set I) were assayed by aCGH and analyzed by Circular Binary Segmentation (CBS) (10). While the copy number status of key PI3K pathway genes were largely concordant with previous studies (Zhang, et al. 2007), the frequency of alterations was slightly lower in this study, probably due to the more conservative CBS approach which requires two or more clones to confirm a copy number change. Nine canonical signaling pathways were interrogated using GenMAPP analysis software. These pathways were chosen based on their role in cell proliferation and apoptosis and their importance in human cancer(Elliott and Blobe 2005; Fesik 2005; Kops, et al. 2005; Luu, et al. 2004; Olson and Hallahan 2004; Sebolt-Leopold and Herrera 2004; Silva 2004; Vasilevskaya and O'Dwyer 2003). These pathways included the PI3K/AKT, MAPK, TGF-β, p38/MAPK, JNK, JAK/STAT, WNT/β-Catenin, NF-κB as well as the apoptosis pathway (data for all pathways shown in Supplementary Fig. S1). In this sample set, multiple components of the PI3K/AKT pathway had frequent amplifications and deletions (Fig. 1). Importantly, most amplifications and deletions were directionally concordant such that each could contribute to abnormally increased activity of the pathway, potentially resulting in survival and cell proliferation advantages. Among the other pathways analyzed, some pathways, like MAPK, showed copy number aberrations at lower frequencies for certain components in the pathway; however a majority of pathway components did not harbor frequent copy number changes. Some other pathways had frequent copy number aberrations (> 20%) in multiple components, but they were largely “non-directional”, (i.e. not consistent with oncogenic pathway activation) (Supplementary Fig. S1). For example, in the apoptosis pathway, the caspase-3 and caspase-6 genes had frequent copy number loss, but frequent copy number gains were seen in the caspase-2 gene. Also, the anti-apoptotic BCL2 gene had copy number loss but its inhibitor, pro-apoptotic BAK gene, had copy number gains. Collectively, these copy number changes would not favor decreased apoptosis and can be considered noise. Unlike these pathways, copy number changes in the PI3K/AKT pathway clearly would favor increased proliferation and decreased apoptosis. In the PI3K/AKT pathway, three of the four catalytic subunits of PI3K (PIK3CA, PIK3CB and PIK3CG) and two of the four regulatory subunits, PIK3R3 and PIK3R4, had copy number gains in more than 15% of the samples. Other altered critical components and downstream effectors of this pathway included gains in AKT2, TERT, and CCND2. In this sample set, 76% of tumors had at least one copy number aberration and 49% had at least two co-occurring activating events in a component of PI3K complex and/or an AKT isoform. Mutation analysis for PIK3CA also identified seven PIK3CA mutations among these tumors (7/93, 8%) (Supplementary Table S1). PI3K has been suggested as a target for ovarian cancer (Dent, et al. 2009; Zhang, et al. 2009). Collectively, our data not only support the important role of PI3K in ovarian cancer, but also suggest that even comparing to other cancer pathways, genetic activation of the PI3K/AKT pathway as a whole is an important characteristics of ovarian cancer. Transcriptomics analysis using publicly available ovarian cancer expression microarray data showed that at mRNA level, PI3K/AKT pathway is also one of the most significantly deregulated pathways in ovarian cancer (Supplementary Fig. S2 & S3)
Figure 1. GenMAPP view of the PI3K/AKT pathway for the ovarian cancer copy number data.

aCGH data for the ninty-three ovarian tumors were analyzed by GenMAPP software. Genes are labeled by color according to the frequency of copy number aberration. Dark green represents copy number gains in at least 20% of tumors; light green represents copy number gains in 15–20% of tumors; dark red represents copy number losses in at least 20% of tumors; light red represents copy number losses in 15–20 % of tumors; white represents genes with copy number changes in less than 15% of tumors. The number next to each gene indicates the exact frequency of copy number aberrations of the gene.
Copy number gain of PI3K genes is associated with decreased survival in the 55 frozen ovarian tumors
Among the 93 frozen ovarian tumors profiled for aCGH (set 1), 55 tumors have clinical data including survival. To study the impact of copy number aberrations of the PI3K/AKT signaling pathway on clinical outcome in ovarian cancer, we classified these 55 frozen tumors on the genomic status of the three most frequently gained genes in this pathway: PIK3CA, PIK3CB and PIK3R4. There was a significant association of shorter survival time with copy number gains or mutation of PIK3CA and copy number gains of PIK3CB or PIK3R4 (Fig. 2). Patients with two copies of wild-type PIK3CA (n=25) in tumor DNA had significantly greater survival time (59.3 vs.28 months, p=0.036) than those with copy number gains or mutation (n=30). Patients with tumors that were diploid for PIK3CB (n=36) or PIK3R4 (n=41) also had longer survival than those with copy number gains (n=19, p=0.0051 for PIK3CB; n=14, p=0.0185 for PIK3R4). No significant difference in survival was seen for copy number gain of AKT2 (data not shown) probably because the sample size for the AKT2 amplified group was too small (only 8 samples). A significant difference in survival was also detected when tumors were classified as: i) no copy number gains or mutation in PIK3CA, PIK3CB or PIK3R4 genes (n=23); ii) gains or mutation in only one of the three genes (n=14); and iii) gains or mutation in two or more of the three genes (n=18). The group with no detected genetic alterations in any of the three genes had the longest median survival time (80.4 months), while the group with copy number gains or mutation in two or more of the above three PI3K genes had the shortest survival (18.2 months, p=0.0094) (Fig. 2d).
Figure 2. Copy number aberrations in the PI3K/AKT pathway correlate with patient survival for the 55 frozen ovarian tumors with aCGH data.

For the 55 frozen ovarian tumors that both aCGH and survival data were available, survival of patients were grouped by genetic aberration status of PIK3CA, PIK3CB and PIK3R4 and presented as Kaplan Meier curves. The X-axis represents survival (in months) and the Y-axis represents probability of survival. For panels a, b and c, the blue solid line represents patients with no copy number gain/mutation; the red dashed line denotes presence of copy number gain/mutation in the single specified gene. In the combinatorial analysis (panel d), the blue solid line represents patients with no copy number gain/mutation; the red dashed line represents patients with copy number gain/mutation in only one of the three PI3K genes; the orange dotted line represents patients with copy number gain/mutation in more than one of the three genes. a) Patients grouped by PIK3CA copy number gain/mutation. (P value = 0.036 between the two groups). b) Patients grouped by PIK3CB copy number gain. (P value = 0.0051 between the two groups). c) Patients grouped by PIK3R4 copy number gain. (P value = 0.0185 between the two groups). d) Patients grouped by PIK3CB, PIK3R4 copy number gain and PIK3CA copy number gain/mutation. (P value = 0.0094 between the group with one genetic alteration and the group with more than one genetic alterations).
Overexpression of p110α and/or pAkt is associated with decreased survival in 522 archival ovarian tumors
To further validate the significance of the PI3K/AKT pathway in survival at protein level, we assessed the expression of the PIK3CA protein product p110α and p-Akt in an independent set of 522 serous ovarian carcinomas (Lassus, et al. 2003) (set 2) using immunohistochemistry. Overexpression of either p110α or p-Akt in these archival tumors was significantly associated with decreased survival (p<0.0001 and p<0.005, respectively) (Fig. 3). However there was no significant difference in survival for tumors overexpressing both proteins (n=12) compared to tumors overexpressing p110α alone or p-Akt alone (n=141). Multivariant analysis using Cox Proportional Hazards Model further showed that overexpression of p-Akt and /or p110α in these tumors is an independent prognostic factor for these patients, besides the known factors like residual tumor size and type of chemotherapy (Table 1).
Figure 3. Protein expression levels of PIK3CA and p-Akt correlate with patient survival for the 522 archival ovarian tumors.

Data are presented as Kaplan-Meier curves to estimate survival of patients by protein expression levels of p-Akt and PIK3CA for the 522 archival ovarian tumors. The X-axis represents survival (in years) and the Y-axis represents probability of survival. a) Patients grouped by p110α level. The blue solid line represents patients with normal protein levels; the red dashed line represents patients with elevated p110α protein levels. The survival is significantly worse for patients with elevated p110α protein (P value < 0.0001). b) Patients grouped by p-Akt level. The blue solid line represents patients with normal p-Akt protein level; the red dashed line represents patients with elevated p-Akt protein levels. The survival is significantly worse for patients with elevated p-Akt (P value < 0.005). c) Patients grouped by protein levels of p-Akt and p110α. The blue solid line represents patients with normal p110α and p-Akt levels; red dashed line represents patients with elevated protein levels of either p-Akt or p110α; orange dotted line represents patients with elevated protein levels of both p-Akt and p110α. While there is no significant survival difference between patients with tumors overexpressing both proteins vs patients with tumors overexpressing one of the two proteins (p > 0.05), both groups differ significantly from patients with tumors not overexpressing either of the proteins (p<0.0001).
Table 1. Cox proportional hazards model of independent prognostic factors for overall survival in stage III–IV serous ovarian carcinomas.
The covariates are: Residual tumor: ≤ 1cm vs. >1cm (reference value: ≤ 1cm); Chemotherapy: Taxane-platinum vs. Platinum vs. No chemotherapy/older regimen (reference value: taxane-platinum); Figo stage: III vs IV (reference value: stage III); p110α & pAkt: normal expresssion of both proteins vs. overexpression of pAkt or p110α or both (reference value: normal expression).
| Variable | β-coef | Chi- square |
P value | HR | 95% CI | |
|---|---|---|---|---|---|---|
| Residual tumor > 1 cm | 1.180 | 34.3 | < 0.0001 | 3.26 | 2.19–4.83 | |
| Chemotherapy | tax | ref | 25.46 | < 0.0001 | 1 | |
| cis | 0.54 | 5.63 | 0.0177 | 1.72 | 1.10–2.69 | |
| no | 1.11 | 22.16 | < 0.0001 | 3.04 | 1.91–4.84 | |
| Stage IV | 0.40 | 6.27 | 0.0123 | 1.55 | 1.10–2.19 | |
| p110α/pAkt overexpression | 0.40 | 7.44 | 0.0064 | 1.50 | 1.12–2.00 |
HR = hazard ratio; CI = confidence interval; ref = reference category; tax=taxane-platinum; cis=platinum; no= no chemotherapy/other regimens
Genetic alterations in the PI3K/AKT pathway of the cell lines predict effect of specific siRNAs targeting different components of the pathway
To test whether PI3K/AKT pathway genomic alterations have functional and possibly therapeutic implications, some major components of the PI3K/AKT pathway (PIK3CA, PIK3CB, PIK3R1, AKT1 and AKT2) were knocked down using siRNAs in vitro and the effect on cell apoptosis or proliferation was studied. We selected four ovarian cancer cell lines with representative genetic aberrationns: A2008 (PIK3CA mutation); OVCAR8 (AKT2 copy number gain); UPN251 (PIK3CA DNA copy number gain); OVCAR10 (wild type for both PIK3CA and AKT2); as well as two immortalized normal human ovarian surface epithelial lines (HOSE) serving as controls. Regardless of the genetic background of the cancer cells, all siRNA transfections were efficient. Western blottings demonstrated significantly reduced abundance of the target proteins in cells transfected with the targeted siRNAs relative to cells transfected with the non-targeting control siRNAs (Fig. 4c & 4d). β-actin was used as a loading control in all cases.
Figure 4. Induction of apoptosis and inhibition of proliferation in ovarian cell lines following siRNA knockdown of specific PI3K/AKT pathway components.

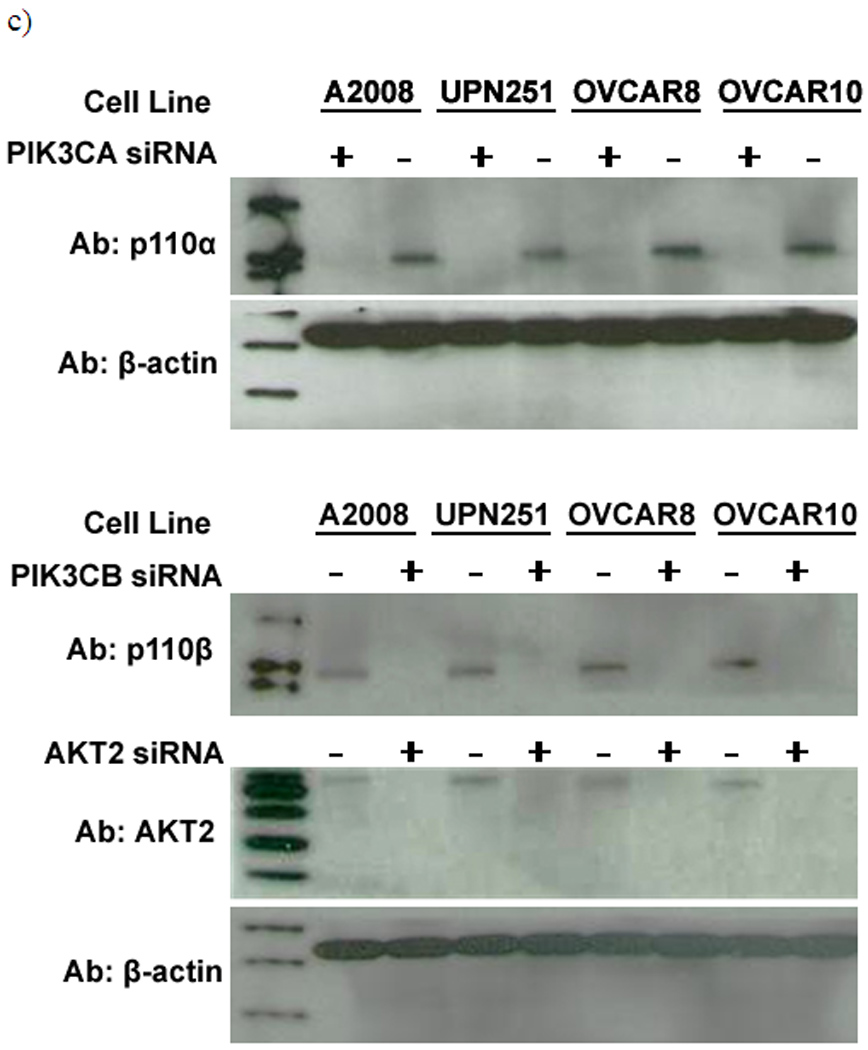
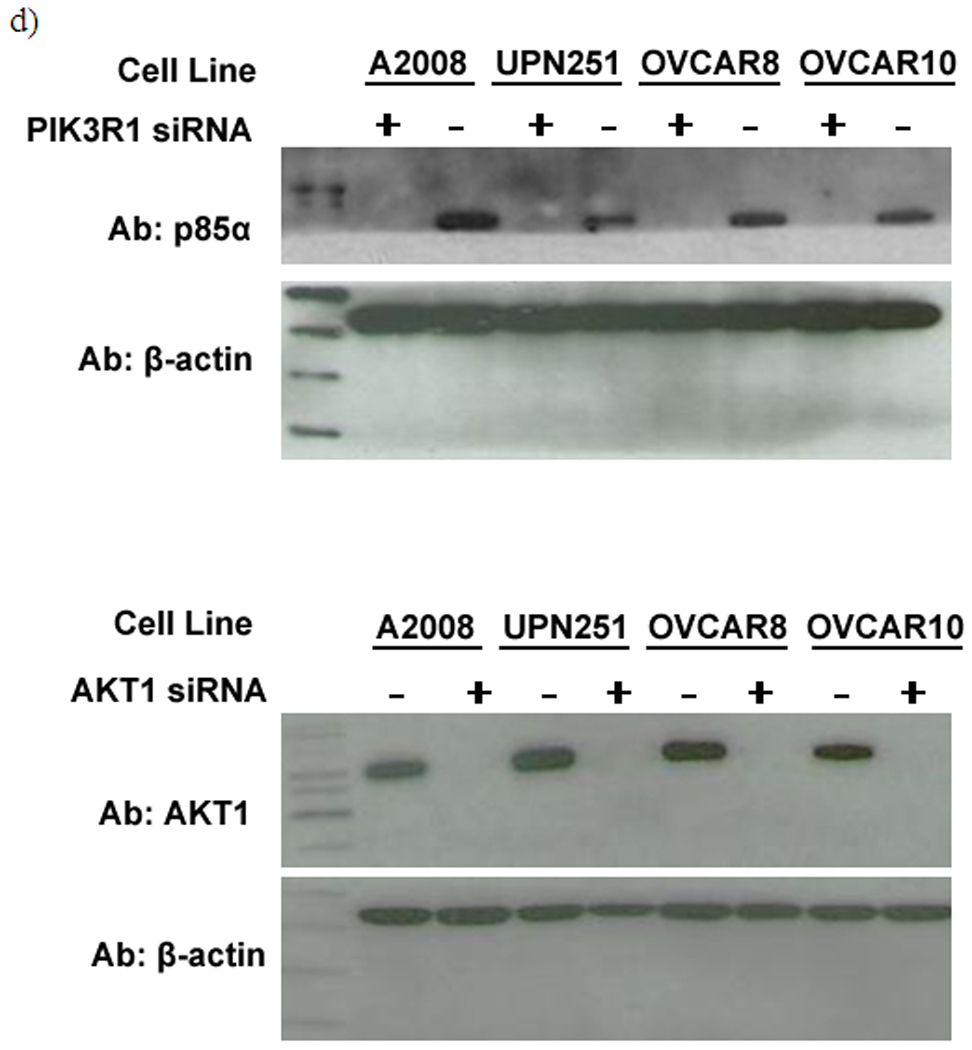
The X-axis in a) and b) represents cell lines studied (from left to right): OVCAR10, OVCAR8 (AKT2 copy number gain), A2008 (PIK3CA mutation), UPN251 (PIK3CA gain), and two immortalized ovarian epithelial control cell lines: H398 and IOSE6. a) Induction of apoptosis after siRNA treatments. The Y-axis represents the fold change in apoptosis for the cells transfected with the respective siRNAs compared to the same cell line transfected with the control non-targeting siRNA. b) Inhibition of proliferation after siRNA treatments. The Y-axis represents percentage of proliferation for the cells transfected with the respective siRNAs relative to the proliferation of the same cells transfected with the control non-targeting siRNA. c) Western blot demonstrating the knockdown efficiency of PIK3CA, PIK3CB and AKT2 using the antibodies for the respective target proteins. d) Western blot demonstrating the knockdown efficiency of PIK3R1 and AKT1 using the antibodies for the respective target proteins. The results demonstrate reduced abundance in cells transfected with targeted siRNAs vs cells transfected with the non-targeting control siRNA. Β-actin was used as a control in all cases.
Notably, none of the siRNAs induced apoptosis in the normal HOSE cell lines. In the cancer cell lines, AKT2 siRNA was the most effective inducer of apoptosis among all siRNA treatments in 3 of the 4 cancer cell lines (p<0.05). Only in cell line UPN251, which harbors a PIK3CA copy number gain, AKT2 and PIK3CA siRNAs showed similar potency in inducing apoptosis (Fig. 4a). Comparing to other cell lines, in the cell line with an AKT2 copy number gain (OVCAR8), AKT2 siRNA exhibited the strongest overall effect with a 5.53-fold increase of apoptosis and 51% decrease of proliferation (p<0.05). In this particular cell line OVCAR8, AKT2 siRNA showed the strongest overall effect in apoptosis and proliferation comparing to all other siRNAs (p<0.05). In a cell line with PIK3CA mutation (A2008) and a cell line with PIK3CA copy number gain (UPN251) PIK3CA siRNA caused the greatest decrease of proliferation comparing to other siRNAs (p<0.05) (Fig. 4b), although this correlation was not observed for apoptosis. For PIK3CA siRNA the strongest proliferation inhibition effect was observed in A2008 comparing to other cell lines (p<0.05). These data are consistent with the hypothesis that the genetic background of the cells determines and predicts response to targeting specific genes in the PI3K/AKT pathway.
DISCUSSION
In this study, by using array CGH to profile genetic aberrations in ovarian cancer, we identified the PI3K/AKT pathway to be the most frequently affected cancer pathway at genetic level. The copy number gains of multiple PI3K genes were associated both individually and additively with decreased patient survival when compared to tumors lacking copy number changes in the 55 frozen tumors with aCGH data. The overexpression of the p110α and p-Akt proteins were confirmed by IHC in an independent set of more than 500 serous ovarian tumors, and the result showed that overexpression of p110α or p-Akt protein had a significant negative impact on the survival of ovarian cancer patients. Furthermore, the overexpression of one or both proteins can serve as independent prognostic factor in this set of archival tumors. Knockdown studies in ovarian cancer cell lines showed that apoptosis induction and proliferation inhibition effect of the individual siRNAs targeting PI3K/AKT pathway components correlate with the specific genetic alteration that the cell line harbors. Collectively, these results suggest that PI3K/AKT pathway genes are important targets for ovarian cancer treatment and that genetic alterations in these genes may predict response to such targeted agents.
The tumor samples from this study overlap with the 89 tumors used in the paper from Zhang L. et al (Zhang, et al. 2007) with 4 additional tumors. In the study by Zhang et al. only PI3K family genes were studied. Here we looked at the entire PI3K/AKT pathway including genes downstream of the PI3K complex, and identified PI3K/AKT pathway as one of the most significantly deregulated cancer pathways in ovarian cancer. Different methods were used to analyze aCGH data as well. In this study we used a segmentation approach to analyzing DNA copy number changes. This method is more conservative as it requires two or more clones to confirm a copy number change. As such, 4/6 amplified PI3K family genes from Zhang’s paper have slightly lower alteration rates by this method. However even using two different methods, the result is mostly concordant (Figure 1 of this manuscript and Figure 1A of Zhang et. al) and both reached the same conclusion that multiple PI3K genes are amplified in ovarian cancer.
Previous microarray studies on ovarian cancer samples focused on identifying individual genes as potential cancer targets (Ramakrishna, et al.). Analysis of the aCGH data using GenMAPP software revealed the PI3K/AKT pathway with the most significant copy number changes relative to eight other signaling pathways implicated in human cancer. Notably, the frequent copy number changes of various components in the PI3K/AKT pathway were mostly directionally concordant (i.e. those suggesting oncogenic activation of the pathway and increased cell survival and proliferation). Multiple PI3K genes were frequently (> 15%) altered by copy number gain. However, PIK3R1 loss was seen in 22% of samples. The protein encoded by PIK3R1, the regulatory subunit p85α, actually stabilizes and also inhibits the activity of the catalytic p110α. This is concordant with our finding that it is more frequently deleted in tumors where the PI3K pathway is active. In fact, unlike PIK3R3 and PIK3R4, whose DNA amplification have been reported previously (Soroceanu, et al. 2007) (Wilting, et al. 2008), copy number loss for PIK3R1 has been reported in breast cancer (Johannsdottir, et al. 2006). When we took a survey of the published aCGH data, frequent loss of PIK3R1 loci was identified in tumor samples from different tissue origins (Supplementary Fig. S4). Deletions within the coding regions of PIK3R1 that causes truncated proteins have also been reported in GBM (2008) as well as ovarian and colon tumors (Philp, et al. 2001). These deletions seem to disrupt the interaction between the p85α and p110α proteins, relieving the inhibitory effects of p85α on p110α. Interestingly, when we knocked down the expression of PIK3R1 to non-detectable level, apoptosis and proliferation inhibition in cell lines with activated PI3K/AKT pathway was also observed (Fig. 4). It is noted that all the deletions we observed in our samples were heterozygous loss. It is possible that the dosage of PIK3R1 is important. One copy loss of PIK3R1 that causes reduced expression may activate the downstream pathway. But severe loss of the protein would cause destablization of p110α and inactivate the PI3K complex. This notion was supported by a mouse study which showed that for PIK3R1+/− mouse (one allele loss of PIK3R1), despite the decrease in p85α protein level, PI3-kinase activation was normal, and insulin-stimulated Akt activity was in fact increased (Mauvais-Jarvis, et al. 2002).
Although frequent copy number changes were observed for PI3K/AKT pathway genes, unfortunately gene expression data is not available for this panel of tumors. As an alternative we analyzed two publicly available ovarian cancer expression microarray datasets. By using Ingenuity pathway analysis tool, PI3K/AKT pathway was shown to be the most significantly altered cancer pathway (P-value =7.99E-12) at expression level in the Welsh dataset that was also used in Zhang’s paper (Welsh, et al. 2001) (the other ovarian dataset used in Zhang’s paper samples size is too small with only 11 tumors and 4 normals) (Supplementary Fig. S2). In another independent expression microarray dataset from an ovarian tumor collection with an even bigger sample size, PI3K/AKT pathway was identified to be the 2nd most significantly altered pathway with p-value of 1.42E-06 (Supplementary Fig. S3). These analyses strongly support the notion that the amplification of the PI3K/AKT pathway genes can be translated into the expression level. To further confirm the significance of PI3K/AKT pathway activation at protein level, we performed IHC for PIK3CA protein product p110α and p-Akt in an independent set of 522 serous ovarian carcinomas, and showed that overexpression of these two proteins are associated with decreased survival, and can be independent prognostic factor for these tumors. In the previous ovarian paper, among the six amplified PI3K genes, Zhang et al identified that PIK3R3 was the only one significantly overexpressed in the two publicly available ovarian cancer expression microarray datasets. Clearly at genetic level, multiple components along PI3K/AKT pathway can be activated. By comparing the DNA copy number data from one sample collection with expression data from a different sample collection, the significance of individual genes can be masked.
A tumor phenotype is predominantly a result of the genetic alterations that occur during cancer development. Thus, specific genetic changes may segregate with clinical parameters such as grade and survival (Wilhelm, et al. 2002). Here we demonstrate that copy number gains of PIK3CA, PIK3CB, and PIK3R4, or overexpression of PIK3CA protein product p110α and p-AKT protein were significantly associated with decreased survival in two independent ovarian cancer cohorts. Further, survival was negatively correlated with the extent of copy number gain of selected PI3K/AKT pathway components. The shortest survival was observed in patients whose tumors have copy number gains in more than one gene and longest survival in patients whose tumors harbor no copy number gains of these genes. However, unlike PIK3CA, there was no significant association between AKT2 copy number gain and reduced survival. This finding may be explained by the relatively small sample size of tumors harboring an AKT2 copy number gain (8 out of 55). Also there is no direct BAC clone covering the AKT2 gene. The closest BAC clone is still over 2Mb away. Thus the sensitivity and accuracy for detecting AKT2 copy number gains could be compromised.
Using siRNA gene knockdown, we observed that downregulating key components of the PI3K/AKT pathway can effectively induce ovarian cancer cell apoptosis and inhibit proliferation. Non-tumorigenic HOSE cells did not exhibit increased cell death following any siRNA exposure, suggesting that increased apoptosis caused by inhibition of the PI3K/AKT pathway may be a tumor-specific phenomenon and that inhibitory agents targeting the PI3K/AKT pathway might be an opportune choice for treatment of ovarian cancer. Furthermore, the effect of the siRNAs in different cell lines seemed to correlate with the specific genetic alterations that the cell line carries. For the siRNA targeting AKT2, the apoptosis induction and proliferation inhibition effect was most prominent in a cell line with AKT2 copy number gains (Fig. 4a). Similarly PIK3CA siRNA caused the greatest decrease of proliferation in a cell line with PIK3CA mutation (A2008) and a cell line with PIK3CA copy number gain (UPN251), although this correlation was not observed for apoptosis (Fig. 4b). Knockdown of PIK3CA has been shown to attenuate growth of ovarian cancer cell lines (Zhang, et al. 2009). Mutation in PIK3CA was reported to predict response to PI3K inhibitor (Ihle, et al. 2009). Our siRNA experiments on 5 different PI3K pathway components further suggested that identifying the specific component in the PI3K pathway that is genetically altered has the potential to help select the most effective therapy. For this purpose, both mutations as well as copy number changes can serve as predictive markers. This is particularly important since many therapies targeting different components along PI3K pathway are currently under clinical development, including Akt, different PI3Ks and mTOR inhibitors.
Overall, the results from this study suggest that a subset of ovarian cancers is “addicted’ to the PI3K/AKT pathway and strongly support the development of PI3K/AKT inhibitors for the treatment of ovarian cancer. The data further suggests that copy number and/or mutation status of the genes along this pathway can potentially serve as predictive biomarkers for identifying responsive patients for individual therapies.
Supplementary Material
ACKNOWLEDGMENTS
We thank Ms. L. Vanderveer for her technical assistance.
Supported by: This work was supported in part by the grants from the Breast Cancer Research Foundation, the Breast Cancer Alliance, the Abramson Family Cancer Research Institute, the Ovarian Cancer Research Fund, American Cancer Society IRG-78-002-30, Mary Kay Ash Charitable Foundation, the National Cancer Institute (R01CA142776, R01CA140323, P50-CA083638), the US Department of Defense (W81XWH-10-1-0082) and an appropriation from the Commonwealth of Pennsylvania. A.K.G. is the Chancellors Distinguished Chair in Biomedical Sciences endowed Professor.
REFERENCES
- Gene Expression Omnibus (GEO) database. Available from: http://www.ncbi.nlm.nih.gov/geo/
- GenMAPP, gene map annotator and pathway profiler. Available from: http://www.GenMAPP.org/
- Ingenuity Pathway Tools. Available from: http://www.ingenuity.com/
- The Cancer Genome Atlas Research Network. Comprehensive genomic characterization defines human glioblastoma genes and core pathways. Nature. 2008;455(7216):1061–1068. doi: 10.1038/nature07385. [DOI] [PMC free article] [PubMed] [Google Scholar]
- Bell DA. Origins and molecular pathology of ovarian cancer. Mod Pathol. 2005;18 Suppl 2:S19–S32. doi: 10.1038/modpathol.3800306. [DOI] [PubMed] [Google Scholar]
- Dent P, Grant S, Fisher PB, Curiel DT. PI3K: A rational target for ovarian cancer therapy? Cancer Biol Ther. 2009;8(1):27–30. doi: 10.4161/cbt.8.1.7365. [DOI] [PubMed] [Google Scholar]
- Elliott RL, Blobe GC. Role of transforming growth factor Beta in human cancer. J Clin Oncol. 2005;23(9):2078–2093. doi: 10.1200/JCO.2005.02.047. [DOI] [PubMed] [Google Scholar]
- Fesik SW. Promoting apoptosis as a strategy for cancer drug discovery. Nat Rev Cancer. 2005;5(11):876–885. doi: 10.1038/nrc1736. [DOI] [PubMed] [Google Scholar]
- Greshock J, Nathanson K, Martin AM, Zhang L, Coukos G, Weber BL, Zaks TZ. Cancer cell lines as genetic models of their parent histology: analyses based on array comparative genomic hybridization. Cancer Res. 2007;67(8):3594–3600. doi: 10.1158/0008-5472.CAN-06-3674. [DOI] [PubMed] [Google Scholar]
- Greshock J, Naylor TL, Margolin A, Diskin S, Cleaver SH, Futreal PA, deJong PJ, Zhao S, Liebman M, Weber BL. 1-Mb resolution array-based comparative genomic hybridization using a BAC clone set optimized for cancer gene analysis. Genome Res. 2004;14(1):179–187. doi: 10.1101/gr.1847304. [DOI] [PMC free article] [PubMed] [Google Scholar]
- Ihle NT, Lemos R, Jr, Wipf P, Yacoub A, Mitchell C, Siwak D, Mills GB, Dent P, Kirkpatrick DL, Powis G. Mutations in the phosphatidylinositol-3-kinase pathway predict for antitumor activity of the inhibitor PX-866 whereas oncogenic Ras is a dominant predictor for resistance. Cancer Res. 2009;69(1):143–150. doi: 10.1158/0008-5472.CAN-07-6656. [DOI] [PMC free article] [PubMed] [Google Scholar]
- Johannsdottir HK, Jonsson G, Johannesdottir G, Agnarsson BA, Eerola H, Arason A, Heikkila P, Egilsson V, Olsson H, Johannsson OT, et al. Chromosome 5 imbalance mapping in breast tumors from BRCA1 and BRCA2 mutation carriers and sporadic breast tumors. Int J Cancer. 2006;119(5):1052–1060. doi: 10.1002/ijc.21934. [DOI] [PubMed] [Google Scholar]
- Kononen J, Bubendorf L, Kallioniemi A, Barlund M, Schraml P, Leighton S, Torhorst J, Mihatsch MJ, Sauter G, Kallioniemi OP. Tissue microarrays for high-throughput molecular profiling of tumor specimens. Nat Med. 1998;4(7):844–847. doi: 10.1038/nm0798-844. [DOI] [PubMed] [Google Scholar]
- Kops GJ, Weaver BA, Cleveland DW. On the road to cancer: aneuploidy and the mitotic checkpoint. Nat Rev Cancer. 2005;5(10):773–785. doi: 10.1038/nrc1714. [DOI] [PubMed] [Google Scholar]
- Lassus H, Leminen A, Lundin J, Lehtovirta P, Butzow R. Distinct subtypes of serous ovarian carcinoma identified by p53 determination. Gynecol Oncol. 2003;91(3):504–512. doi: 10.1016/j.ygyno.2003.08.034. [DOI] [PubMed] [Google Scholar]
- Lu Y, Wang H, Mills GB. Targeting PI3K-AKT pathway for cancer therapy. Rev Clin Exp Hematol. 2003;7(2):205–228. [PubMed] [Google Scholar]
- Luu HH, Zhang R, Haydon RC, Rayburn E, Kang Q, Si W, Park JK, Wang H, Peng Y, Jiang W, et al. Wnt/beta-catenin signaling pathway as a novel cancer drug target. Curr Cancer Drug Targets. 2004;4(8):653–671. doi: 10.2174/1568009043332709. [DOI] [PubMed] [Google Scholar]
- Mauvais-Jarvis F, Ueki K, Fruman DA, Hirshman MF, Sakamoto K, Goodyear LJ, Iannacone M, Accili D, Cantley LC, Kahn CR. Reduced expression of the murine p85alpha subunit of phosphoinositide 3-kinase improves insulin signaling and ameliorates diabetes. J Clin Invest. 2002;109(1):141–149. doi: 10.1172/JCI13305. [DOI] [PMC free article] [PubMed] [Google Scholar]
- Mills GB, Lu Y, Fang X, Wang H, Eder A, Mao M, Swaby R, Cheng KW, Stokoe D, Siminovitch K, et al. The role of genetic abnormalities of PTEN and the phosphatidylinositol 3-kinase pathway in breast and ovarian tumorigenesis, prognosis, and therapy. Semin Oncol. 2001;28(5) Suppl 16:125–141. doi: 10.1016/s0093-7754(01)90290-8. [DOI] [PubMed] [Google Scholar]
- Nakayama K, Nakayama N, Kurman RJ, Cope L, Pohl G, Samuels Y, Velculescu VE, Wang TL, Shih Ie M. Sequence mutations and amplification of PIK3CA and AKT2 genes in purified ovarian serous neoplasms. Cancer Biol Ther. 2006;5(7):779–785. doi: 10.4161/cbt.5.7.2751. [DOI] [PubMed] [Google Scholar]
- Nicosia SV, Bai W, Cheng JQ, Coppola D, Kruk PA. Oncogenic pathways implicated in ovarian epithelial cancer. Hematol Oncol Clin North Am. 2003;17(4):927–943. doi: 10.1016/s0889-8588(03)00056-x. [DOI] [PubMed] [Google Scholar]
- Olshen AB, Venkatraman ES, Lucito R, Wigler M. Circular binary segmentation for the analysis of array-based DNA copy number data. Biostatistics. 2004;5(4):557–572. doi: 10.1093/biostatistics/kxh008. [DOI] [PubMed] [Google Scholar]
- Olson JM, Hallahan AR. p38 MAP kinase: a convergence point in cancer therapy. Trends Mol Med. 2004;10(3):125–129. doi: 10.1016/j.molmed.2004.01.007. [DOI] [PubMed] [Google Scholar]
- Philp AJ, Campbell IG, Leet C, Vincan E, Rockman SP, Whitehead RH, Thomas RJ, Phillips WA. The phosphatidylinositol 3'-kinase p85alpha gene is an oncogene in human ovarian and colon tumors. Cancer Res. 2001;61(20):7426–7429. [PubMed] [Google Scholar]
- Pinkel D, Albertson DG. Array comparative genomic hybridization and its applications in cancer. Nat Genet. 2005;37 Suppl:S11–S17. doi: 10.1038/ng1569. [DOI] [PubMed] [Google Scholar]
- Ramakrishna M, Williams LH, Boyle SE, Bearfoot JL, Sridhar A, Speed TP, Gorringe KL, Campbell IG. Identification of candidate growth promoting genes in ovarian cancer through integrated copy number and expression analysis. PLoS One. 5(4):e9983. doi: 10.1371/journal.pone.0009983. [DOI] [PMC free article] [PubMed] [Google Scholar]
- Samuels Y, Wang Z, Bardelli A, Silliman N, Ptak J, Szabo S, Yan H, Gazdar A, Powell SM, Riggins GJ, et al. High frequency of mutations of the PIK3CA gene in human cancers. Science. 2004;304(5670):554. doi: 10.1126/science.1096502. [DOI] [PubMed] [Google Scholar]
- Sebolt-Leopold JS, Herrera R. Targeting the mitogen-activated protein kinase cascade to treat cancer. Nat Rev Cancer. 2004;4(12):937–947. doi: 10.1038/nrc1503. [DOI] [PubMed] [Google Scholar]
- Silva CM. Role of STATs as downstream signal transducers in Src family kinase-mediated tumorigenesis. Oncogene. 2004;23(48):8017–8023. doi: 10.1038/sj.onc.1208159. [DOI] [PubMed] [Google Scholar]
- Soroceanu L, Kharbanda S, Chen R, Soriano RH, Aldape K, Misra A, Zha J, Forrest WF, Nigro JM, Modrusan Z, et al. Identification of IGF2 signaling through phosphoinositide-3-kinase regulatory subunit 3 as a growth-promoting axis in glioblastoma. Proc Natl Acad Sci U S A. 2007;104(9):3466–3471. doi: 10.1073/pnas.0611271104. [DOI] [PMC free article] [PubMed] [Google Scholar]
- Vasilevskaya I, O'Dwyer PJ. Role of Jun and Jun kinase in resistance of cancer cells to therapy. Drug Resist Updat. 2003;6(3):147–156. doi: 10.1016/s1368-7646(03)00043-8. [DOI] [PubMed] [Google Scholar]
- Vivanco I, Sawyers CL. The phosphatidylinositol 3-kinase-Akt pathway in human cancer. Nature Reviews Cancer. 2002;2(7):489–501. doi: 10.1038/nrc839. [DOI] [PubMed] [Google Scholar]
- Vogelstein B, Kinzler KW. Cancer genes and the pathways they control. Nat Med. 2004;10(8):789–799. doi: 10.1038/nm1087. [DOI] [PubMed] [Google Scholar]
- Welsh JB, Zarrinkar PP, Sapinoso LM, Kern SG, Behling CA, Monk BJ, Lockhart DJ, Burger RA, Hampton GM. Analysis of gene expression profiles in normal and neoplastic ovarian tissue samples identifies candidate molecular markers of epithelial ovarian cancer. Proc Natl Acad Sci U S A. 2001;98(3):1176–1181. doi: 10.1073/pnas.98.3.1176. [DOI] [PMC free article] [PubMed] [Google Scholar]
- Wilhelm M, Veltman JA, Olshen AB, Jain AN, Moore DH, Presti JC, Jr, Kovacs G, Waldman FM. Array-based Comparative Genomic Hybridization for the Differential Diagnosis of Renal. Cell Cancer. 2002:957–960. [PubMed] [Google Scholar]
- Wilting SM, de Wilde J, Meijer CJ, Berkhof J, Yi Y, van Wieringen WN, Braakhuis BJ, Meijer GA, Ylstra B, Snijders PJ, et al. Integrated genomic and transcriptional profiling identifies chromosomal loci with altered gene expression in cervical cancer. Genes Chromosomes Cancer. 2008;47(10):890–905. doi: 10.1002/gcc.20590. [DOI] [PMC free article] [PubMed] [Google Scholar]
- Zhang L, Huang J, Yang N, Greshock J, Liang S, Hasegawa K, Giannakakis A, Poulos N, O'Brien-Jenkins A, Katsaros D, et al. Integrative genomic analysis of phosphatidylinositol 3'-kinase family identifies PIK3R3 as a potential therapeutic target in epithelial ovarian cancer. Clin Cancer Res. 2007;13(18 Pt 1):5314–5321. doi: 10.1158/1078-0432.CCR-06-2660. [DOI] [PubMed] [Google Scholar]
- Zhang X, Deng HX, Zhao X, Su D, Chen XC, Chen LJ, Wei YQ, Zhong Q, Li ZY, He X, et al. RNA interference-mediated silencing of the phosphatidylinositol 3-kinase catalytic subunit attenuates growth of human ovarian cancer cells in vitroand in vivo. Oncology. 2009;77(1):22–32. doi: 10.1159/000218201. [DOI] [PubMed] [Google Scholar]
Associated Data
This section collects any data citations, data availability statements, or supplementary materials included in this article.