Abstract
Organ transplant recipients (OTRs) develop multiple aggressive and metastatic non-melanoma skin cancers (NMSCs). Yet, the underlying mechanism remains elusive. Employing a variety of immune-compromised murine models, immunoblotting, immunohistochemical and immunofluorescence techniques, we show that human squamous xenograft tumors in nude mice grow faster and become significantly larger in size following treatment with the immunosuppressive drug, cyclosporine A (CsA). Re-injected tumor cells isolated from CsA-treated xenografts continued to form larger tumors in nude mice than those from vehicle-controls and retained the CsA-signatures of calcineurin signaling inhibition. Similar results were obtained when these tumors were grown in SCID-beige mice or in immuno-competent mice inoculated with syngeinic tumor cells. Consistently, tumors in the CsA group manifested enhanced cellular proliferation and decreased apoptosis. Tumors in CsA-treated animals also showed an augmented epithelial-mesenchymal transition (EMT) characterized by an increased expression of fibronectin, α-SMA, vimentin, N-cadherin, MMP-9/-2, snail and twist with a concomitant decrease in E-cadherin. CsA-treated xenograft tumors manifested increased TGFβ1 expression and TGFβ-dependent signaling characterized by increased nuclear p-Smad2/3. Our data demonstrate that CsA alters the phenotype of skin SCCs to an invasive and aggressive tumor-type by enhancing expression of proteins regulating EMT acting through the TGFβ1 signaling pathway providing at least one unique mechanism by which multiple aggressive and metastatic NMSCs develop in OTRs.
Keywords: skin carcinogenesis, immune suppression, cyclosporine A, TGF-β, EMT, Nuclear factor of activated T-cells, Carcinogenesis, Tumor progression
Introduction
The lifetime risk for skin cancer (SC) development in the US is estimated to be 1 in 5 and greatly exceeds the incidence of all other neoplasms (1, 2). About 1/3 of all human cancers occur in skin and more than 1.2 million new cases of non-melanoma skin cancer (NMSC) including both squamous cell carcinoma (SCC) and basal cell carcinoma (BCC) are reported annually in the US alone (1). Ultraviolet B (UVB) is the major etiologic factor for NMSCs (2). Interestingly, risk for NMSCs is further augmented in chronically immune-suppressed organ transplant recipients (OTR). Of all cancers that arise in OTRs, 95% are SC (3). The risk of SCC induction in immunosuppressed patients is between 65- and 250-fold higher, and the risk of BCC is 10-fold greater than that seen in the general population (4). Analyses of Medicare claims data and the Organ Procurement and Transplant Network/United Network of Organ Sharing database have shown that the incidence of NMSC in chronically immunesuppressed OTRs increases from 2.25% at 1 year to 4.95% at 2 years, and 7.43% at 3 years, which further increases to 10-27% and 40-60% respectively after 10 and 20 years of immune suppression (5). These patients develop NMSCs at a relatively young age with an increased risk of local recurrence, regional and distant metastasis and significant morbidity and mortality (4, 6). In both immune-competent and immune-suppressed populations UVB induces mutagenic photoproducts in DNA that include cyclobutane dimers and (6-4) photoproducts. These lesions are potentially mutagenic and if not repaired, can lead to C to T and CC to TT transition mutations, also known as UVB “signature” mutations (7). These mutation frequently occur in tumor suppressor genes, oncogenes and/or other genes involved in the pathogenesis of these lesions (8). Although the aggressive phenotypes of NMSCs are well-described in chronically immunesuppressed populations, the exact mechanism(s) by which this aggressive phenotype is achieved remains elusive. It is believed that immunosuppressive medications lead to impaired immune surveillance and failure to eradicate cells with precancerous changes (7). In addition, direct carcinogenic effects of these agents cannot be ruled out.
Cyclosporine A (CsA) is a common immunosuppressive drug used in OTRs to prevent rejection of the transplanted organ. It is also employed in the treatment of several diseases (9). Similar to many other immune suppressants, the risk of SC in patients receiving prolonged treatment with CsA is augmented. For example, patients receiving CsA-azathioprine-prednisone were found to have a 3-fold increased risk of NMSC, compared to patients receiving azathioprine-prednisone alone. In a 66 month follow-up, 60 of 231 transplant (26%) recipients receiving CsA developed cancers, 66% of which were SCs. (10). Kidney transplant patients receiving CsA-azathioprine-prednisone had 4.2-fold higher risk for developing cutaneous SCC than those receiving azathioprine-prednisone. Over 4638 patient-years of exposure, 10.4% of OTRs receiving CsA developed a first NMSC (11). These data clearly indicate that CsA administration enhances SC risk in humans.
CsA acts by binding to a cytoplasmic protein, cyclophilin (immunophilin) of immuno-competent lymphocytes, particularly T-lymphocytes. The CsA-cyclophylin complex inhibits calcineurin, which dephosphorylates transcription factor, nuclear factor of activated T-cells (NFAT), promoting its movement from the cytoplasm to the nucleus (12). This transcription factor is required for the transcription of interleukin-2 (IL-2). Thus calcineurin inhibition blocks IL-2 production leading to a reduced function of effector T-cells. In addition, to its effects on T-cells, it alters mitochondria-dependent cellular functions and blocks the mitochondrial permeability pore (MPP) opening, which alters the ability of cells to undergo apoptotic cell death (13). We and others have shown that CsA-pretreated skin carcinoma cells do not respond to agents that induce apoptosis by inhibiting mitochondrial cytochrome c release, a potent pro-apoptotic stimulation factor (14).
In this study, we show that A431 SCC xenograft tumors grown in nude mice develop much faster and become much larger in size following treatment with CsA. CsA-tumors manifested enhanced cellular proliferation and tumor vascularity associated with high expression of vascular endothelial growth factor (VEGF). These tumors also showed increased epithelial-mesenchymal transition (EMT) CsA increased transforming growth factor beta-1 (TGFβ1) expression with a concomitant increase in cell migration/invasion and a decrease in apoptosis.
Materials and Methods
Antibodies
The antibodies were procured from different commercial sources. The details are provided in Table 1.
Table 1.
Description of antibodies used in this study.
| Antibody | Company | Dilution Used | Technique |
|---|---|---|---|
| β-actin (AC-74) | Sigma | 1:10,000 | WB |
| Akt (B-1) | Santa Cruz Biotechnology | 1:200 | WB |
| BAX (Δ 21) | Santa Cruz Biotechnology | 1:200 | WB |
| Bcl-2 (C-21) | Santa Cruz Biotechnology | 1:100 | IF |
| Calcineurin (H209) | Santa Cruz Biotechnology | 1:100 | IF |
| CDK4 (H-22) | Santa Cruz Biotechnology | 1:200 | WB |
| CDK6 (C-21) | Santa Cruz Biotechnology | 1:200 | WB |
| Cyclin D1 (HD11) | Santa Cruz Biotechnology | 1:200 | WB |
| Cyclin D3 (D7) | Santa Cruz Biotechnology | 1:200 | WB |
| Cytokeratin 1 | Santa Cruz Biotechnology | 1:100 | IF |
| Cytokeratin 10 | Abcam | 1:500 | IF |
| E-cadherin (H108) | Santa Cruz Biotechnology | 1:100, 1:500 | IF, WB |
| Fibronectin (C-20) | Santa Cruz Biotechnology | 1:100 | IF |
| Goat anti mouse Dylight 488 | Pierce | 1:500 | IF |
| Goat anti-mouse AlexaFluor 594 | Invitrogen | 1:500 | IF |
| Goat anti-mouse HRP | Pierce | 1:8,000 | WB |
| Goat antirabbit AlexaFluor 594 | Invitrogen | 1:500 | IF |
| Goat anti-rabbit Dylight 488 | Pierce | 1:500 | IF |
| Goat anti-rabbit HRP | Pierce | 1:8,000 | WB |
| VEGF (C-1) | Santa Cruz Biotechnology | 1:200, 1:100 | WB, IHC |
| Vimentin (C-20) | Santa Cruz Biotechnology | 1:100 | IF |
| MMP-2 (8B4) | Santa Cruz Biotechnology | 1:100, 1:500 | IF, WB |
| MMP-9 (C-20) | Santa Cruz Biotechnology | 1:100, 1:500 | IF, WB |
| Mouse anti-goat Fluorescein | ThermoScientific | 1:500 | IF |
| Mouse anti-goat HRP | Pierce | 1:8,000 | WB |
| N-cadherin (H63) | Santa Cruz Biotechnology | 1:100, 1:500 | IF, WB |
| NFAT (7A6) | Santa Cruz Biotechnology | 1:100 | IF |
| α-SMA (1A4) | Sigma | 1:100, 1:500 | IF, WB |
| Fibronectin | Abcam | 1:1000 | WB |
| PCNA (C-20) | Santa Cruz Biotechnology | 1:100 | IHC |
| PCNA (PC10) | Abcam Incorporated | 1:5000 | WB |
| p-Smad 2/3 (Ser423/425) | Santa Cruz Biotechnology | 1:100 | IF |
| Rabbit anti-goat AlexaFluor 594 | Invitrogen | 1:500 | IF |
| Smad 2 (Y2-13) | Santa Cruz Biotechnology | 1:100, 1:500 | IF, WB |
| Smad 4 (B-8) | Santa Cruz Biotechnology | 1:100, 1:500 | IF, WB |
| Smad 7 (Z8B) | Santa Cruz Biotechnology | 1:100, 1:400 | IF, WB |
| Snai | Abcam | 1:1000 | WB |
| TGFβRI (T-19) | Santa Cruz Biotechnology | 1:100, 1:500 | IF, WB |
| TGFβRII (C-21) | Santa Cruz Biotechnology | 1:100, 1:500 | IF, WB |
| Twist (Twist 2C1A) | Santa Cruz Biotechnology | 1:100 | IF |
Cells
Human epidermoid carcinoma A431 (CRL-2592) cells and murine Lewis lung carcinoma (CRL-1642) cells were obtained from the American Type Culture Corporation (Manassas, VA, USA). Cells were cultured in Dulbecco’s modified Eagle’s medium (DMEM) supplemented with 10% fetal bovine serum, 100 U/ml of penicillin, and 100 μg/ml of streptomycin at 37°C in a humidified atmosphere of 5% CO2. Cells were cultured on 100mm plates and split when plates were at 70-80% confluence.
Animals
Female nude mice (Athymic NCr-nu/nu, 3-5 weeks, 25-30g) were purchased from NCI-Frederick Animal Production Program (Frederick, MD, USA). Female Fox Chase SCID-beige mice (CB17.B6-Prkdcscid Lystbg/Crl, 3-5 weeks, 25-30g) and C57BL/6 mice (C57BL/6NCrl, 3-5 weeks, 25-30g) were purchased from Charles River Laboratories (Hartford, CT, USA). All experiments were approved by the University of Alabama at Birmingham Institutional Animal Care and Use Committee.
Wound Healing Assay
A431 cells (5 × 10⁵) were seeded in six-well plates and incubated overnight in starvation medium. Then, the cell monolayers were wounded with a sterile 100-μl pipette tip, washed with medium to remove detached cells from the plates. Cells were left in DMEM either untreated or treated with CsA, and kept for 24 hrs in CO2 incubator. After 24 hrs, medium was replaced with PBS and cells were photographed using an Olympus (Japan) IX-TVAD digital camera connected to an Olympus IX70 phase-contrast microscope (4X objective). The migration of cells was recorded at time 0 (immediately after scratch) and every 12 hours. The area of open gap left was measured. Three independent experiments were performed, with each in triplicate. The migration index was calculated by the following formula: % Migration = (the width of initial wound – the width of wound after 12 h) × 100/the width of initial wound.
Invasion Assay
Cell invasion was measured with a blind well chemotaxis invasion chamber (Neuro Probe, Cabin John, MD, USA) according to the manufacturer’s instructions. Briefly, approximately 100μl of DMEM containing 20% fetal bovine serum was added into the lower chamber and covered with an 8μm pore size polycarbonate membrane filter (Neuro Probe). Cells (2.5 × 10⁴) in 100μL of serum free DMEM were seeded into the upper chamber. After incubating for 24 hours at 37°C, membranes were collected and non-invading cells were removed from the upper surface of the membrane using a cotton swab. The membranes were then fixed with methanol, stained with Harris hematolxylin (Sigma, St. Louis, MO, USA), and photographed microscopically with a 10X objective. The number of invading cells on the lower surface of the membrane was counted in 10 fields per membrane. Mean number of cells per field was calculated.
Tumor Sample Preparation
At the termination of experiments, mice were sacrificed via cervical dislocation following sedation with isoflurane (MWI Veterinary Supply, Meridian, ID, USA). Tumor tissues were excised and washed with ice-cold PBS. All samples were routinely fixed in 10% neutral buffered formalin, embedded in paraffin, and cut into 5-μm sections. Tissue slides were stained with hematoxylin and eosin (H&E) for histology. The rest of the tumor tissue was flash frozen in liquid nitrogen and then placed at −80°C. Frozen tumor tissue was further processed when necessary to prepare cell lysate as follows. Tumor tissue was thawed on ice and homogenized in ice-cold lysis buffer (50mM 1M Tris pH 7.5, 1% Triton X-100, 0.25% NaF, 10mM β-glycerol phosphate, 1mM 0.5M EDTA, 5mM sodium pyrophosphate, 0.5mM Na3VO4, 0.1% 1M DTT, 1% PMSF, and protease inhibitor). Clear lysate was prepared by centrifugation at 7,000g for 20 minutes and then the supernatant was centrifuged at 13,000g for 20 minutes. Extracts were aliquotted in small volumes and stored at −80°C before use.
Western blotting
Briefly, 40-80μg of total protein from tumor cell lysate was electrophoresed on 8-12% polyacrylamide gel (BioRad, Hercules, CA, USA). The protein was transferred, via electrotransfer, to a nitrocellulose membrane. Nonspecific binding sites were blocked with 5% non-fat milk in Tris-buffered saline with 0.1% Tween-20 (TBST) and then the membranes were incubated with primary antibody overnight at 4°C. After washing with TBST the membranes were incubated with appropriate horseradish peroxidase-conjugated secondary antibody (Pierce, Rockford, IL, USA) for 1 hour. The immunocomplex was detected with chemiluminescent substrate (Pierce) and was exposed to HyBlot CL autoradiography film (Denville Scientific Incorporated, Metuchen, NJ, USA).
Immunofluorescence analysis
Sections of tumor tissues (5μm) were cut, deparaffinized, rehydrated and then processed as follows. Briefly, tissue sections were first treated with Vector Antigen Unmasking solution according to the manufacturer’s instructions (Vector Laboratories, Burlingame, CA, USA). The nonspecific binding sites were blocked with 2% bovine serum albumin (BSA) (Sigma) in PBS for 30 minutes at 37°C. Tissues were then incubated at 4°C overnight with primary antibody, washed and positive cells were detected by an Alexa Fluor 594 (Invitrogen, Carlsbad, CA, USA), Dylight 488 (Pierce) or Fluorescein (Pierce)–coupled secondary antibody. Sections were mounted with Vectashield mounting medium for fluorescence with DAPI (Vector Laboratories). Results were evaluated and pictures were taken microscopically using an Olympus BX51 microscope with an Olympus DP71 digital camera using software from the manufacturer (Olympus).
Immunohistochemical analysis
Briefly, deparaffinized and rehydrated tissue sections (5μm) were first treated with Vector Antigen Unmasking solution according to the manufacturer’s instructions (Vector Laboratories). After cooling, endogenous peroxidase activity was quenched by incubating in 3% hydrogen peroxide solution in water for 5 minutes. The nonspecific sites were blocked with 2% BSA (Sigma) in PBS for 30 minutes at 37°C. Tissues were then incubated at 4°C overnight with primary antibodies, washed and positive cells were detected by a peroxidase-coupled secondary antibody (Pierce) and visualized with 3′3-Diaminobenzidine (DAB) Set (BD Pharmingen, San Diego, CA, USA). Sections were counterstained with Harris hematoxylin (Sigma) and briefly exposed to 1% HCl and 70% ethanol solution, then dehydrated through alcohol to xylene, and mounted using Permount (Sigma). Results were evaluated and pictures were taken as described earlier.
Terminal deoxynucleotidyl transferase–mediated nick end labeling(TUNEL)
Tumor samples were fixed in 10% formalin and sections (5μm) were made. TUNEL assay was performed using a commercial apoptosis detection kit (Roche, Mannheim, Germany) according to the manufacturer’s instruction on formalin fixed, paraffin embedded tumor tissue sections (5μm). Sections were counterstained with DAPI, mounted, and photographed as described earlier.
Real Time Polymerase Chain Reaction (RT-PCR)
Briefly, total RNA was extracted from cells using Trizol reagent (Invitrogen), according to the manufacturer’s protocol. Real-time PCR primers were designed using Beacon Design software (Bio-Rad). Each primer pair was validated by performing electrophoresis and melting temperature analysis of the PCR product. First-strand cDNA was synthesized using oligo-dT primers and Moloney murine leukemia virus (MMLV) reverse transciptase (Superscript II, Invitrogen). PCR amplification was performed on a My-IQ thermocycler (Bio-Rad) using SYBR Green I (Bio-Rad). For PCR, 5 μL each of the standard and sample cDNA dilutions were added to individual tubes. Amplification (40 cycles) was conducted in a total volume of 25 μL containing primer concentrations of 3 pmol and equal volumes (12 μL each) of iQ SYBR Green supermix (Bio-Rad) and nuclease free water. The iQ SYBR Green supermix contains the SYBR Green I dye, hot-start iTaq DNA polymerase, dNTPs and buffers. Amplification efficiency was controlled by the use of an internal control (GAPDH) and external standards, which were homologous to the targets. Relative quantification of target mRNA expression was calculated and normalized to GAPDH expression. The 2–ΔΔCT method was used to compare gene expression levels between samples, which are presented as the fold induction of mRNA expression relative to the amount present in control samples.
Statistics
Statistical analysis was performed using Microsoft Excel software. The significance between the 2 test groups was determined using Student’s t test.
Results
CsA treatment increases tumor size of xenograft human SCCs
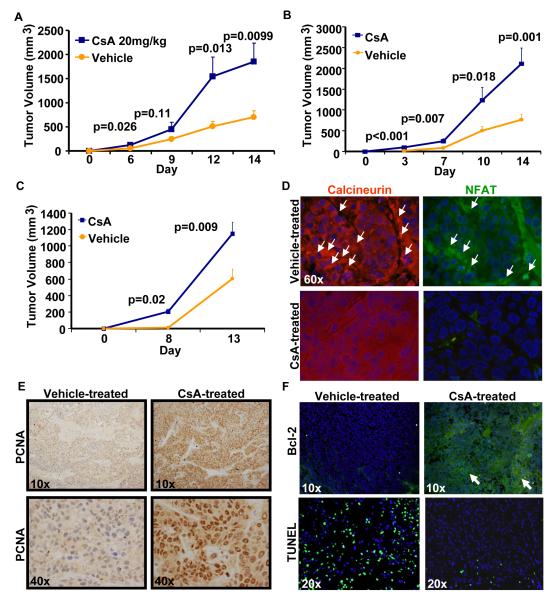
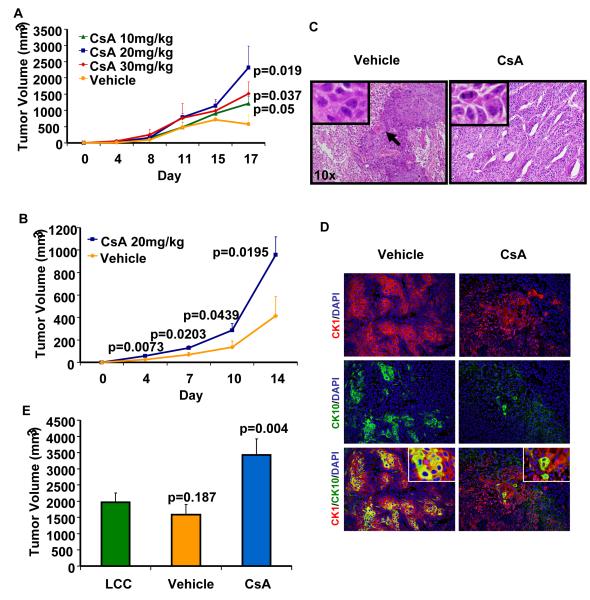
Nude mice injected with A431 cells and treated with CsA developed much larger tumors as compared to mice injected with A431 cells and treated with vehicle. As shown in Fig. 1A, the tumors were significantly larger (p=0.026) beginning from day 6 to day 14. During this period of observation, these tumors continued to grow faster to larger volumes. At the termination of the experiment, the mean tumor volume in CsA-treated mice was 1854.7±379.7mm3 as compared to 703.9±133.4mm3 in vehicle-treated controls (p=0.0099) (Fig. 1A). Similar results were obtained when A431 cells treated with CsA (5μM) for three weeks in vitro in culture were inoculated in nude mice (Fig. 1B). Grossly, CsA-treated mice developed tumors that exhibited greater erythema, telangectasias and ulcerations. The effects of CsA on tumor growth were largely dose-dependent (Fig. 2A). To show that the observed increase in CsA-mediated tumor growth is not due to suppression of the immune responses present in nude mice, we conducted similar experiments in SCID-beige mice which are devoid of most of the innate immunity components. Moreover, SCC xenograft tumors grew significantly larger following treatment with CsA in SCID-beige mice as shown in Fig. 2B. Histology of tumors from CsA-treated mice displayed poorly differentiated tumor phenotype with an increased number of mitotic figures and decreased keratinization as compared to vehicle-treated controls (Fig. 2C). Consistent with their histology, CsA tumors also exhibited reduced expression of keratin1 and 10, the markers of differentiation (Fig. 2D). However, at the highest dose of 30mg/kg, a statistically non-significant decrease in mean tumor volume was observed. A dose of 20mg/kg used in this study is comparable to the dose regimen used to induce chronic immune suppression in OTRs (Epocrates Online [database on the Internet]. San Mateo (CA): Epocrates, Inc. c2006 [continuously updated; cited 2008 Aug 15]. Available from: http://www.epocrates.com). Interestingly, it was found that treatment with CsA at a dose of 30mg/kg was toxic as many of the CsA-treated mice at this dose regimen died before the termination of the experiment (15).
Fig 1. CsA augments xenograft tumor growth in immune deficient mice.
CsA treatment induces proliferation and reduces apoptosis in xenograft tumors in nude mice. A,-Tumor volume (mean ± S.E.) of xenograft tumors grown in nude mice treated with CsA. B,-Growth curves of tumors in nude mice developed following inoculation with A431 cells treated in culture for 3 weeks with vehicle or CsA (5μM). C,-Growth-curves of tumors developed in nude mice following inoculation with tumor keratinocytes isolated from vehicle- or CsA-treated tumors. D,-Molecular phenotype of tumors excised from mice as shown in Figure-1c demonstrating downregulation of NFAT and calcineurin expression (immunofluorescence staining), (arrows show areas of intense staining) E,-Immunohistochemical staining for PCNA. F,-Immunofluorescence staining for Bcl-2 and TUNEL (arrows show areas of enhanced staining)
Fig 2.
(A) Dose-dependent effects of CsA on xenograft tumor growth in nude mice. (B) Effects of CsA treatment on the growth of xenograft tumors in SCID-beige mice. (C) Histology of tumors harvested from CsA-treated and vehicle-treated mice. Inset shows mitotic figures in CsA-treated tumor and black arrow shows keratin pearl in vehicle-treated tumor. (D) Expression of cytokeratin 1 and 10 in vehicle and CsA treated tumors (E) Tumor volume of xenograft tumors developed in C57BL/6 immune competent mice following inoculation with LCC cells or LCC cells isolated from vehicle- or CsA-treated tumors developed in nude mice.
Effects of cessation of CsA treatment on tumor growth
To determine whether the observed CsA-related alterations are reversible following cessation of CsA treatment, we isolated tumor keratinocytes from the tumors of both CsA- and vehicle-treated groups, passaged them for at least 4 cycles in culture in normal medium which contained no CsA and then re-injected them in nude mice. We observed that tumor cells isolated from the CsA-treatment group continued to form significantly larger xenograft tumors when inoculated in nude mice (p<0.01) than those isolated from the vehicle-treated control animals (1150.7±140.8mm3 verses 604.5±116.7mm3 respectively) as shown in Fig. 1C. In these tumors, we also assessed calcineurin-NFAT signaling which is known to be inhibited by CsA treatment. Interestingly, the aggressive phenotype of keratinocytes isolated from the CsA-treatment group was accompanied by retention of the molecular phenotype characterized by the inhibited calcineurin-NFAT signaling (Fig. 1D). To further ascertain that the manifestation of the CsA-mediated aggressive phenotype is not limited to immune-suppressed mice, we conducted similar studies in immune competent mice. In this experiment, we inoculated Lewis lung carcinoma (LCC) cells (a cell line established from the lung of a C57BL/6 mouse) subcutaneously in nude mice which were treated with either CsA or vehicle until these animals developed large tumors. Cells isolated from the tumors of both CsA- and vehicle-treated groups were then passaged for at least 4 cycles in culture in normal medium without CsA and re-injected in C57BL/6 syngeneic mice. Interestingly, cells isolated from the CsA-treatment group continued to form significantly larger allograft tumors when inoculated in C57BL/6 mice (p<0.01) than those isolated from the vehicle-treated control animals (3428.27±497.35mm3 verses 1586.67±306.84mm3 respectively) as shown in Fig. 2E.
CsA increases cell proliferation and decreases apoptosis
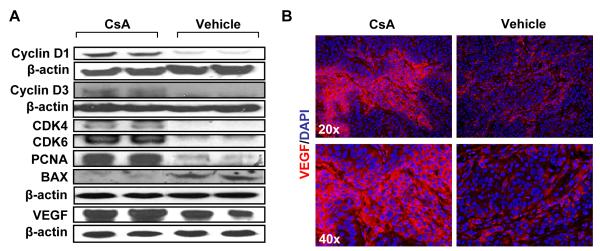
To assess whether CsA-mediated enhancement in tumor growth is related to increased cell proliferation or diminished apoptotic response or both, we determined the expression of various proteins known to be involved in cell cycle progression, proliferation and apoptosis. As shown in Fig. 3A, CsA increased expression of cell cycle regulatory proteins, cyclin D1, cyclin D3, and their kinase partners CDK4 and CDK6. The proliferation marker protein, proliferative cell nuclear antigen (PCNA) also showed an enhancement by both western blotting (Fig. 3A) and immunohistochemical localization studies (Fig. 1E). In addition, the angiogenesis marker VEGF was increased by CsA as compared to control treatment (Fig. 3A & B). The pro-apoptotic protein BAX was found to be decreased in tumors from CsA-treated mice as compared to control (Fig. 3A), whereas anti-apoptotic Bcl-2 was increased with a concomitant decrease in TUNEL positive cells (Fig. 1F).
Fig 3.
(A) Western blot analysis showing expression of proteins regulating proliferation, angiogenesis and apoptosis. (B) Immunofluorescence staining for VEGF.
CsA increases TGFβ and TGFβ-dependent signaling
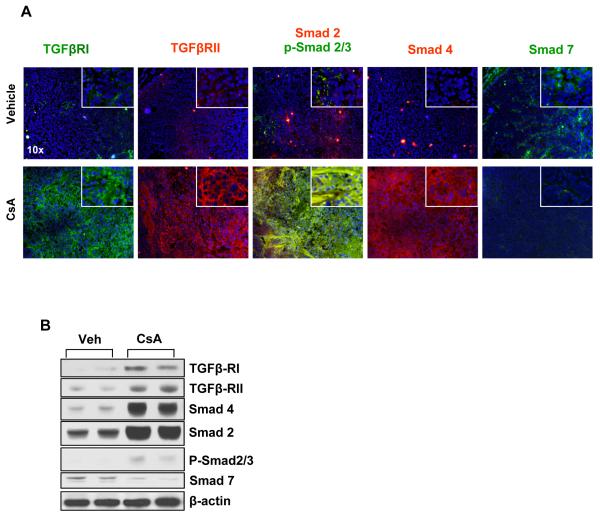
It is known that CsA treatment induces TGFβ (16). To confirm this, we assessed TGFβ transcript levels in A431 xenograft tumors formed following CsA or vehicle treatment. Real-time polymerase chain reaction (RT-PCR) revealed a >10-fold increase in the transcription levels of TGFβ in tumors excised from mice that received CsA as compared to those that received vehicle (data not shown). TGFβ1 acts through its receptor complex formed by the heterodimerization of TGFβ receptors type-I (TGFβRI) and type-II (TGFβRII) (17). Binding of TGFβ1 to the TGFβRI/TGFβRII complex triggers the TGFβRI-mediated phosphorylation of Smad 2 and Smad 3. The p-Smad 2/3 form a heterotrimeric complex with Smad 4 which then translocates to the nucleus to regulate the transcription of TGFβ-responsive genes (17). Under normal circumstances, TGFβ signaling downregulates proliferation in many epithelial tissues including skin keratinocytes. However, in tumor tissue, it often plays a reverse role and augments tumor progression (18 and references therein). In this study, we therefore determined the levels of important proteins induced by the TGFβ signaling pathway. As shown in Fig. 5, the expression of TGFβRI and TGFβRII is enhanced in tumors developed in CsA-treated mice. Furthermore, we observed an enhanced nuclear localization of p-Smad 2/3 in CsA-treated tumors. Consistently, expression of Smad 7, which is known to block the transcriptional effects of the p-Smad 2/3-Smad 4 complex, was found to be reduced (19). Similar results were observed in the western blot analysis of these proteins (Fig. 5).
Fig 5. CsA increases TGFβ pathway-dependent signaling in xenograft human squamous tumors.
(A) Immunofluorescence staining illustrates expression of TGFβ receptors and downstream signaling proteins Smads, Smad 2, 3, 4, and 7, in vehicle and CsA-treated tumors. (B) Western Blot analysis showing expression of TGFβ receptors and downstream signaling proteins Smads, Smad 2, 3, 4, and 7, in vehicle and CsA-treated tumors.
CsA increases cell migration and invasion
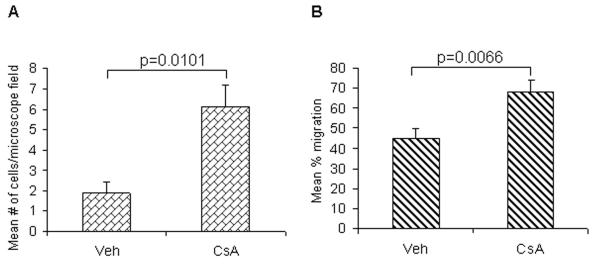
To confirm whether CsA-dependent TGFβ1-mediated effects enhance progression of SCCs, we assessed its effects on cell migration and invasion in vitro. As shown in Figure 4, A431 cells treated with CsA (0.1μM) for 10 weeks in culture displayed a significant increase in cell migration when tested in a wound healing assay (p=0.006) and enhanced invasion when tested in transwell invasion assay (p=0.01).
Fig 4.
Effects of CsA treatment on the (A) invasion and (B) wound healing capabilities of A431 cells. Cell invasion was measured with a blind well chemotaxis invasion chamber. 100μl of DMEM containing 20% fetal bovine serum was added into the lower chamber and covered with an 8μm pore size polycarbonate membrane filter. Cells (2.5 × 10⁴) in 100μL of serum free DMEM were seeded into the upper chamber. After incubating for 24 hours at 37°C, membranes were collected and non-invading cells were removed from the upper surface of the membrane using a cotton swab. The membranes were then fixed with methanol, stained with Harris hematolxylin, and photographed microscopically with a 10X objective. The number of invading cells on the lower surface of the membrane was counted in 10 fields per membrane. For wound healing assay, A431 cells were seeded in six-well plates and incubated overnight in starvation medium. Then, the cell monolayers were wounded with a sterile 100-μl pipette tip, washed with starvation medium to remove detached cells from the plates. Cells were left either untreated or treated with CsA, and kept for 24 hrs in CO2 incubator. After 24 hrs, medium was replaced with PBS and cells were photographed using an Olympus (Japan) IX-TVAD digital camera connected to an Olympus IX70 phase-contrast microscope (4X objective).
CsA increases epithelial-mesenchymal transition (EMT)
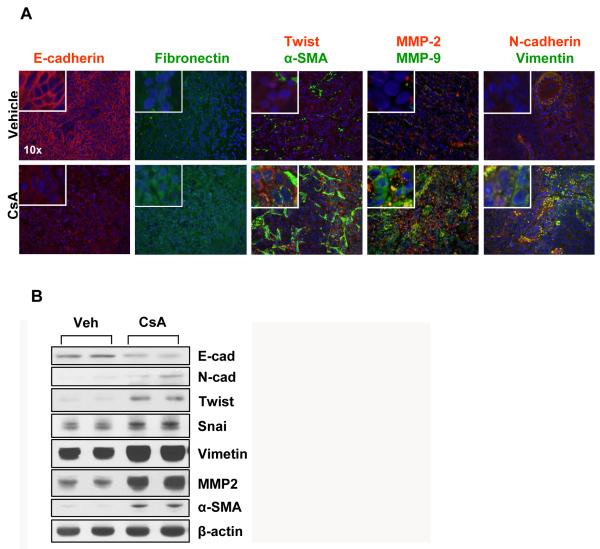
After showing that CsA treatment activated TGFβ-dependent signaling which may contribute to enhanced proliferation and invasiveness of skin SCCs, we tested whether it acts by augmenting EMT. TGFβ signaling under various experimental protocols has been shown to influence EMT (20 and references therein). TGFβ signaling is also considered important in mediating tumor aggression and metastasis by invoking pathways which regulate the polarity of epithelial cells and/or help in retaining a mesenchymal phenotype. We therefore assessed a battery of biomarkers representing EMT. As shown in Fig. 6A, CsA treatment reduced expression of E-cadherin, an epithelial marker, while it enhanced the expression of mesenchymal markers, N-cadherin, vimentin, snail, twist, and fibronectin. α-SMA, another mesenchymal protein, showed a remarkable pattern of induction. While its staining was restricted to a few stromal cells in the vehicle-treatment group, it showed very prominent staining in the CsA-treatment group. Compared to vehicle-treated controls, the area of α-SMA positive stromal cells was much larger in CsA-treated tumors (Fig. 6A). These results were confirmed by Western Blot analyses of these proteins (Fig 6B).
Fig 6. CsA increases epithelial-mesenchymal transition (EMT).
(A) Immunofluorescence staining showing expression of biomarkers of EMT in tumors excised from vehicle- and CsA-treated mice (B) Western Blot analysis of tumors showing the effects of CsA on the expression of EMT marker proteins
Discussion
It is believed that immunosuppressive drugs (IDs) impair immune functions including those related to immune surveillance of cancer cells leading to enhanced cancer incidence (7). Accordingly, OTRs are highly susceptible to early cancer development in multiple organs (21) and particularly manifest enhanced NMSCs as compared to normal cohorts (4). The early molecular pathogenesis of the majority of NMSCs in this population appears qualitatively similar to that which occurs in an immune competent population (7). O’Donovan et al demonstrated that the ID, azathioprine, in the presence of UVA generates mutagenic adducts which are detectable in the skin of patients receiving treatment with this agent, and these adducts can be correlated with the enhanced occurrence of SC in these patients (22). These results suggest that IDs may also alter tumor growth by acting directly on tumor cells.
In this study, we designed experiments to test whether CsA manifests direct effects on human cancer cells and transforms them to a highly aggressive and invasive phenotype. CsA is given to OTRs to prevent graft organ rejection (23). In our experiments, employing A431 cells that form stable xenograft tumors in immunodeficient murine models and carry UVB signature p53 mutations (7, 14), we observed >300% increase in the growth of xenograft tumors following treatment with CsA, suggesting that CsA augments the growth of SC cells through direct effects on tumor cells. This enhancement in tumor growth by CsA appears similar to the known increase in skin tumor growth in humans receiving chronic treatment with CsA (10, 11). The enhanced VEGF expression, a pro-angiogenic factor in CsA-affected lesions, supports our observations that, on clinical examination, these tumors are more vascularized than the vehicle-treated controls. In this regard, CsA was reported to increase VEGF expression in renal cancer cells by augmenting protein kinase C (PKC) and Sp-1-dependent signaling (24). We also observed an increase in Sp-1 expression in CsA-treated tumors.
The CsA-mediated increase in xenograft tumor growth was found to be similar both in nude mice (which have impaired T-cell function) and SCID-beige mice (which have impaired T-cell, B-cell and natural killer cell functions), ruling out the possibility that the increase in tumor growth was due to its effects on immune functions. Significantly, the effects of CsA on the growth of xenograft tumors in these animals were not reversible since cessation of CsA treatment did not retard tumor growth. Furthermore, tumor keratinocytes isolated from A431 xenograft tumors developed in both nude and SCID-beige mice receiving CsA form larger tumors when re-inoculated in nude or SCID-beige mice as compared to keratinocytes isolated from xenograft tumors developed in mice receiving vehicle, reinforcing the notion that CsA-mediated effects on the skin tumor phenotype are not reversible. This is confirmed by the retention of the CsA signature molecular phenotype in CsA-mediated tumors characterized by the inhibition of calcineurin-NFAT signaling (25 and references therein).
Our findings that these tumors manifest increased expression of proliferation-related markers, PCNA, Cyclin D1/D3, and CDK4/6 is commensurate with the observed increased growth rate of CsA tumors (14). These results confirm previous studies in which CsA-mediated inhibition of calcineurin-NFAT signaling leads to enhanced expression of CDK4 in normal follicular keratinocytes and fibroblasts (25, 26). Our observations that CsA tumors manifest increased Bcl-2 positive cells with a decrease in TUNEL-positive cells indicate that enhanced tumor growth by CsA is not only due to its ability to enhance proliferation but is also associated with anti-apoptosis effects. We showed that CsA blocks MPP transition and the mitochondrial-dependent apoptosis pathway by diminishing cytochrome c release from the mitochondria to the cytoplasm, which may be the underlying mechanism by which CsA diminishes apoptosis induction in these xenograft tumors (14). In this regard, Gafter-Gvili et al showed that CsA increases Bcl-2/BAX ratio in follicular keratinocytes leading to a reduced apoptosis response (27). Interestingly, Yarosh et al demonstrated that CsA inhibits UVB-induced apoptosis and DNA repair leading to enhanced skin SCCs independent of CsA-mediated immune suppression (28). Additionally, in a recent study, immune suppression was found to enhance the number of microscopic cell clones over-expressing mutant p53, considered precursors of actinic keratoses and SCCs (14, 29).
The observations that keratinocytes isolated from CsA-induced tumors retain the aggressive phenotype and form larger xenograft tumors are consistent with a previous report in humans in which tapering or withdrawing IDs often represses virus-induced cancers more efficiently than it reduces the incidence of UVB-induced SCCs (30). Our observations that the molecular phenotype of CsA-induced cancer is also retained in this study further strengthens the notion that the direct effects of CsA on tumor cells are largely irreversible and contribute to the observed aggressive phenotype of SCCs occurring in OTRs. It may be argued that the enhanced growth of tumors developed by keratinocytes isolated from CsA-treated tumors may be due to the possible selection of a fast-growing tumor clone by CsA as opposed to CsA-induced epigenetic changes. However, we discount this possibility since we consistently observed identical results in our in vitro and in vivo approaches (experiments conducted using in vitro CsA-treated A431 cells assessing their ability to form xenograft tumors and employing tumor cells obtained from CsA-treated xenograft tumors developed in immune-deficient or immune-competent mice and then studying their ability to form aggressive tumors).
It has been shown that CsA increases expression of TGFβ in human pulmonary adenocarcinoma (A-594), murine renal cell carcinoma (Renca) and mink lung epithelial (CCL-64) cells (16). Parallel to these observations, we also found a significant induction of TGFβ1 (>10-fold). In addition, TGFβ-dependent signaling proteins including its receptors TGFβRI and TGFβRII and their target proteins, Smads, are increased in CsA-treated A431 tumor tissues. Although CsA-mediated effects in skin SCCs observed in this study are novel, CsA is known to enhance the binding of TGFβ1 to its receptor complex in lung and renal carcinoma xenografts (16). CsA also up-regulates the expression of TGFβ1 and its receptors TGFβRI and TGFβRII in normal rat mesangial cells (31). SCID-beige mice carrying lung and bladder xenograft tumors manifested increased pulmonary metastatic lesions when treated with CsA whereas this metastatic tumor growth was significantly reduced in mice receiving treatment with anti-TGFβ antibodies, suggesting a role of TGFβ signaling in CsA-mediated tumor metastasis (16).
Our results suggest that CsA-augmented tumor growth involves up-regulation of TGFβ signaling-dependent causation of an invasive and aggressive phenotype. TGFβ plays an important role in EMT (20, 26, 27). However, the role of CsA-mediated EMT in tumor progression is not known. Our observations that CsA-treated A431 xenograft tumors overexpress markers of EMT and that CsA enhances migration and invasion of A431 cells indicate that CsA acts through TGFβ signaling that may be involved in altering the tumor phenotype to more aggressive and invasive SCC by augmenting EMT. In conclusion, CsA directly affects the pathogenesis of SCCs through TGFβ-dependent enhancement in the EMT leading to an aggressive and invasive phenotype.
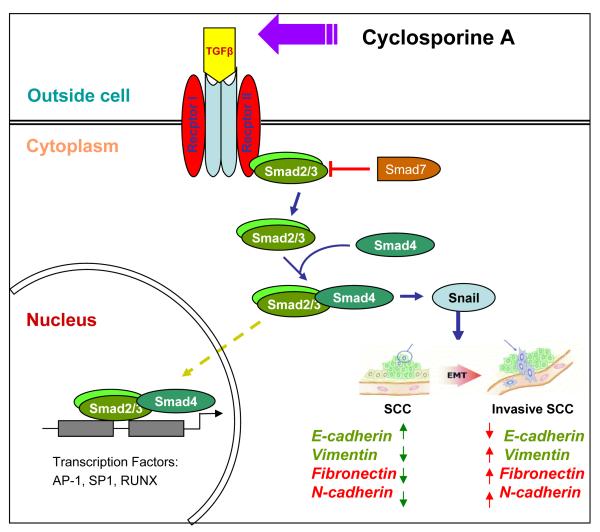
Fig. 7.
Cartoon representing CsA-mediated activation of TGF β1-dependent signaling leading to epithelial-mesenchymal transition in epidermoid carcinoma cells. Green arrows represent levels of proteins in parental carcinoma cells and red arrows represent the alterations in the expression of these proteins following CsA treatment.
Acknowledgement
This work was supported in part by NIH grants R01 ES015323, NO1-CN-43300, P30 AR050948, R21 ES017494, and T32AR053458.
List of Abbreviations
- Organ transplant recipients
OTRs
- non-melanoma skin cancers
NMSCs
- cyclosporine A
CsA
- epithelial-mesenchymal transition
EMT
- skin cancer
SC
- Ultraviolet B
UVB
- nuclear factor of activated T-cells
NFAT
- vascular endothelial growth factor
VEGF
- mitochondrial permeability pore
MPP
- transforming growth factor beta-1
TGFβ1
Footnotes
Conflict of interest: The authors declare no conflict of interest.
References
- 1.Neville JA, Welch E, Leffell DJ. Management of nonmelanoma skin cancer in 2007. Nat Clin Pract Oncol. 2007;4:462–9. doi: 10.1038/ncponc0883. [DOI] [PubMed] [Google Scholar]
- 2.Jemal A, Siegel R, Ward E, Hao Y, Xu J, Thun MJ. Cancer statistics, 2009. CA Cancer J Clin. 2009;59:225–49. doi: 10.3322/caac.20006. [DOI] [PubMed] [Google Scholar]
- 3.Ulrich C, Kanitakis J, Stockfleth E, Euvrard S. Skin cancer in organ transplant recipients--where do we stand today? Am J Transplant. 2008;8:2192–8. doi: 10.1111/j.1600-6143.2008.02386.x. [DOI] [PubMed] [Google Scholar]
- 4.Euvrard S, Kanitakis J, Claudy A. Skin cancers after organ transplantation. N Engl J Med. 2003;348:1681–91. doi: 10.1056/NEJMra022137. [DOI] [PubMed] [Google Scholar]
- 5.Otley CC, Cherikh WS, Salasche SJ, McBride MA, Christenson LJ, Kauffman HM. Skin cancer in organ transplant recipients: effect of pretransplant end-organ disease. J Am Acad Dermatol. 2005;53:783–90. doi: 10.1016/j.jaad.2005.07.061. [DOI] [PubMed] [Google Scholar]
- 6.Berg D, Otley CC. Skin cancer in organ transplant recipients: Epidemiology, pathogenesis, and management. J Am Acad Dermatol. 2002;47:1–17. doi: 10.1067/mjd.2002.125579. quiz 8-20. [DOI] [PubMed] [Google Scholar]
- 7.Martinez OM, de Gruijl FR. Molecular and immunologic mechanisms of cancer pathogenesis in solid organ transplant recipients. Am J Transplant. 2008;8:2205–11. doi: 10.1111/j.1600-6143.2008.02368.x. [DOI] [PubMed] [Google Scholar]
- 8.Phan TA, Halliday GM, Barnetson RS, Damian DL. Spectral and dose dependence of ultraviolet radiation-induced immunosuppression. Front Biosci. 2006;11:394–411. doi: 10.2741/1807. [DOI] [PubMed] [Google Scholar]
- 9.Bach JF. The contribution of cyclosporine A to the understanding and treatment of autoimmune diseases. Transplant Proc. 1999;31:16S–8S. doi: 10.1016/s0041-1345(98)02075-2. [DOI] [PubMed] [Google Scholar]
- 10.Dantal J, Hourmant M, Cantarovich D, et al. Effect of long-term immunosuppression in kidney-graft recipients on cancer incidence: randomised comparison of two cyclosporin regimens. Lancet. 1998;351:623–8. doi: 10.1016/S0140-6736(97)08496-1. [DOI] [PubMed] [Google Scholar]
- 11.Kessler M, Jay N, Molle R, Guillemin F. Excess risk of cancer in renal transplant patients. Transpl Int. 2006;19:908–14. doi: 10.1111/j.1432-2277.2006.00383.x. [DOI] [PubMed] [Google Scholar]
- 12.McCaffrey PG, Luo C, Kerppola TK, et al. Isolation of the cyclosporin-sensitive T cell transcription factor NFATp. Science. 1993;262:750–4. doi: 10.1126/science.8235597. [DOI] [PubMed] [Google Scholar]
- 13.Walter DH, Haendeler J, Galle J, Zeiher AM, Dimmeler S. Cyclosporin A inhibits apoptosis of human endothelial cells by preventing release of cytochrome C from mitochondria. Circulation. 1998;98:1153–7. doi: 10.1161/01.cir.98.12.1153. [DOI] [PubMed] [Google Scholar]
- 14.Tang X, Zhu Y, Han L, et al. CP-31398 restores mutant p53 tumor suppressor function and inhibits UVB-induced skin carcinogenesis in mice. J Clin Invest. 2007;117:3753–64. doi: 10.1172/JCI32481. [DOI] [PMC free article] [PubMed] [Google Scholar]
- 15.Iwamura H, Sato M, Wakitani K. Comparative study of glucocorticoids, cyclosporine A, and JTE-607 [(-)-Ethyl-N[3,5-dichloro-2-hydroxy-4-[2-(4-methylpiperazin-1-yl)ethoxy]be nzoyl]-L-phenylalaninate dihydrochloride] in a mouse septic shock model. J Pharmacol Exp Ther. 2004;311:1256–63. doi: 10.1124/jpet.104.072421. [DOI] [PubMed] [Google Scholar]
- 16.Hojo M, Morimoto T, Maluccio M, et al. Cyclosporine induces cancer progression by a cell-autonomous mechanism. Nature. 1999;397:530–4. doi: 10.1038/17401. [DOI] [PubMed] [Google Scholar]
- 17.Massague J, Seoane J, Wotton D. Smad transcription factors. Genes Dev. 2005;19:2783–810. doi: 10.1101/gad.1350705. [DOI] [PubMed] [Google Scholar]
- 18.Bierie B, Moses HL. Tumour microenvironment: TGFbeta: the molecular Jekyll and Hyde of cancer. Nat Rev Cancer. 2006;6:506–20. doi: 10.1038/nrc1926. [DOI] [PubMed] [Google Scholar]
- 19.Heldin CH, Miyazono K, ten Dijke P. TGF-beta signalling from cell membrane to nucleus through SMAD proteins. Nature. 1997;390:465–71. doi: 10.1038/37284. [DOI] [PubMed] [Google Scholar]
- 20.Xu J, Lamouille S, Derynck R. TGF-beta-induced epithelial to mesenchymal transition. Cell Res. 2009;19:156–72. doi: 10.1038/cr.2009.5. [DOI] [PMC free article] [PubMed] [Google Scholar]
- 21.Agraharkar ML, Cinclair RD, Kuo YF, Daller JA, Shahinian VB. Risk of malignancy with long-term immunosuppression in renal transplant recipients. Kidney Int. 2004;66:383–9. doi: 10.1111/j.1523-1755.2004.00741.x. [DOI] [PubMed] [Google Scholar]
- 22.O’Donovan P, Perrett CM, Zhang X, et al. Azathioprine and UVA light generate mutagenic oxidative DNA damage. Science. 2005;309:1871–4. doi: 10.1126/science.1114233. [DOI] [PMC free article] [PubMed] [Google Scholar]
- 23.Meier-Kriesche HU, Li S, Gruessner RW, et al. Immunosuppression: evolution in practice and trends, 1994-2004. Am J Transplant. 2006;6(5 Pt 2):1111–31. doi: 10.1111/j.1600-6143.2006.01270.x. [DOI] [PubMed] [Google Scholar]
- 24.Basu A, Contreras AG, Datta D, et al. Overexpression of vascular endothelial growth factor and the development of post-transplantation cancer. Cancer Res. 2008;68:5689–98. doi: 10.1158/0008-5472.CAN-07-6603. [DOI] [PMC free article] [PubMed] [Google Scholar]
- 25.Horsley V, Aliprantis AO, Polak L, Glimcher LH, Fuchs E. NFATc1 balances quiescence and proliferation of skin stem cells. Cell. 2008;132:299–310. doi: 10.1016/j.cell.2007.11.047. [DOI] [PMC free article] [PubMed] [Google Scholar]
- 26.Kahl CR, Means AR. Calcineurin regulates cyclin D1 accumulation in growth-stimulated fibroblasts. Mol Biol Cell. 2004;15:1833–42. doi: 10.1091/mbc.E03-10-0730. [DOI] [PMC free article] [PubMed] [Google Scholar]
- 27.Gafter-Gvili A, Sredni B, Gal R, Gafter U, Kalechman Y. Cyclosporin A-induced hair growth in mice is associated with inhibition of calcineurin-dependent activation of NFAT in follicular keratinocytes. Am J Physiol Cell Physiol. 2003;284:C1593–603. doi: 10.1152/ajpcell.00537.2002. [DOI] [PubMed] [Google Scholar]
- 28.Yarosh DB, Pena AV, Nay SL, Canning MT, Brown DA. Calcineurin inhibitors decrease DNA repair and apoptosis in human keratinocytes following ultraviolet B irradiation. J Invest Dermatol. 2005;125:1020–5. doi: 10.1111/j.0022-202X.2005.23858.x. [DOI] [PubMed] [Google Scholar]
- 29.Athar M, Kim AL, Ahmad N, Mukhtar H, Gautier J, Bickers DR. Mechanism of ultraviolet B-induced cell cycle arrest in G2/M phase in immortalized skin keratinocytes with defective p53. Biochem Biophys Res Commun. 2000;277:107–11. doi: 10.1006/bbrc.2000.3436. [DOI] [PubMed] [Google Scholar]
- 30.Nagy S, Gyulai R, Kemeny L, Szenohradszky P, Dobozy A. Iatrogenic Kaposi’s sarcoma: HHV8 positivity persists but the tumors regress almost completely without immunosuppressive therapy. Transplantation. 2000;69:2230–1. doi: 10.1097/00007890-200005270-00053. [DOI] [PubMed] [Google Scholar]
- 31.Waiser J, Dell K, Bohler T, et al. Cyclosporine A up-regulates the expression of TGF-beta1 and its receptors type I and type II in rat mesangial cells. Nephrol Dial Transplant. 2002;17:1568–77. doi: 10.1093/ndt/17.9.1568. [DOI] [PubMed] [Google Scholar]
- 32.McMorrow T, Gaffney MM, Slattery C, Campbell E, Ryan MP. Cyclosporine A induced epithelial-mesenchymal transition in human renal proximal tubular epithelial cells. Nephrol Dial Transplant. 2005;20:2215–25. doi: 10.1093/ndt/gfh967. [DOI] [PubMed] [Google Scholar]
- 33.Slattery C, Campbell E, McMorrow T, Ryan MP. Cyclosporine A-induced renal fibrosis: a role for epithelial-mesenchymal transition. Am J Pathol. 2005;167:395–407. doi: 10.1016/S0002-9440(10)62984-7. [DOI] [PMC free article] [PubMed] [Google Scholar]


