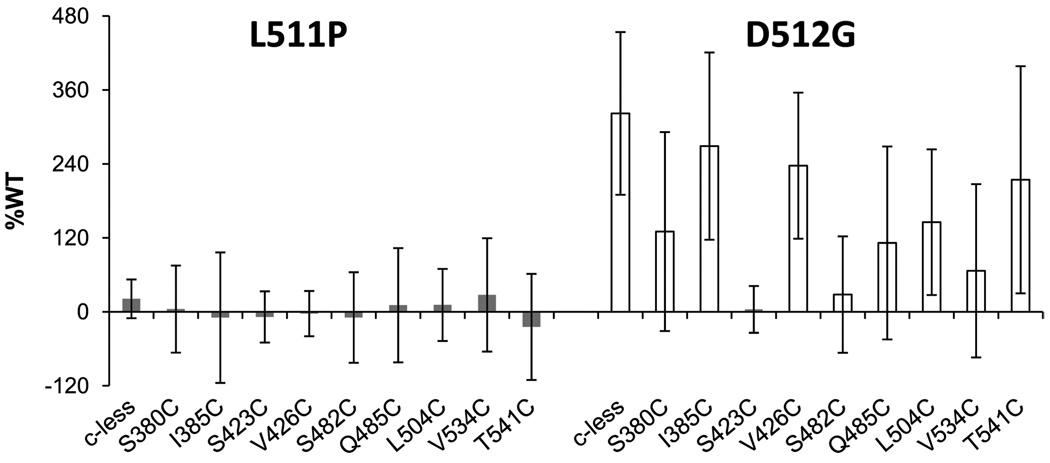
Figure 3.
ATP hydrolysis rates as a percentage of WT activity over 2 min at 37 °C for L511P (gray) and D512G (white) in the Cys-less and single-cysteine reporter backgrounds, as indicated. Rates for the single-cysteine reporters in the Cys-less background have been published previously.22 Standard deviations are from experiments conducted in triplicate.

