

Abstract
The different brain anatomy of men and women is both a classic and continuing topic of major interest. Among the most replicated and robust sex differences are larger overall brain dimensions in men, and relative increases of global and regional gray matter (GM) in women. However, the question remains whether sex-typical differences in brain size (i.e., larger male and smaller female brains) or biological sex itself account for the observed sex effects on tissue amount and distribution. Exploring cerebral structures in men and women with similar brain size may clarify the true contribution of biological sex. We thus examined a sample of 24 male and 24 female subjects with brains identical in size, in addition to 24 male and 24 female subjects with considerable brain size differences. Using this large set of brains (n = 96), we applied a well validated and automated voxel-based approach to examine regional volumes of GM. While we revealed significant main effects of sex, there were no significant effects of brain size (and no significant interactions between sex and brain size). When conducting post hoc tests, we revealed a number of regions where women had larger GM volumes than men. Importantly, these sex effects remained evident when comparing men and women with the same brain size. Altogether, our findings suggest that the observed increased regional GM volumes in female brains constitute sex-dependent redistributions of tissue volume, rather than individual adjustments attributable to brain size.
Introduction
Although there are many similarities in male and female brains, there are also various neuroanatomical features that differ between men and women (Cosgrove et al., 2007). Among the most replicated sexually dimorphic characteristics are larger overall brain sizes in men and larger global gray matter (GM) proportions as well as regional GM volumes and concentrations in women (Schlaepfer et al., 1995; Gur et al., 1999; Nopoulos et al., 2000; Good et al., 2001; Luders et al., 2005; Leonard et al., 2008). Similarly, larger measurements in women than in men have been reported with respect to cortical thickness (Narr et al., 2005; Im et al., 2006; Luders et al., 2006a), cortical convolution (Luders et al., 2004, 2006b), and the dimensions of predefined regions (Filipek et al., 1994; Giedd et al., 1996; Harasty et al., 1997; Goldstein et al., 2001; Rademacher et al., 2001). While some of these prior studies controlled for individual differences in brain size, others did not. Regardless of such corrections, it remains unclear whether the observed larger measurements in female brains are characteristic for women (i.e., attributable to biological sex per se), or whether they are just typical for small brains (i.e., attributable to brain size) (Leonard et al., 2008).
Evaluating men and women who have the same brain sizes provides an invaluable opportunity to study the true contribution of biological sex on cerebral characteristics, independently of brain size. Interestingly, only one previous study has analyzed a subset of 18 female and 18 male subjects matched for age and brain volume to confirm the presence of thicker cortices observed in females than in males (Sowell et al., 2007). However, no details concerning the age of subjects (the whole sample consisted of 176 healthy individuals between the ages of 7 and 87 years) or the brain size matching procedures were provided. To our knowledge, no other study has compared cerebral features in equally sized male and female brains. The sparseness of such analyses is most likely attributable to the difficulty creating samples comprising men and women of similar brain size, as intracranial volumes of male and female brains differ on average by about 13–15% (Gur et al., 1999; Luders et al., 2005; Leonard et al., 2008). Fortunately, the recent establishment of large-scale databases encompassing thousands of brain images now provides the opportunity to select from a vast pool of subjects. In the present study we used the International Consortium for Brain Mapping (ICBM) database (Mazziotta et al., 2009) to select a sample of 24 male and 24 female brains identical in size. In addition, we selected the 24 largest male brains and the 24 smallest female brains. Using this set of brains (n = 96), we analyzed regional volumes of GM to address whether brain size accounts for observed sex differences, or whether anatomical differences between male and female brains exist independently of brain size effects.
Materials and Methods
Subjects.
Our initial sample included 153 healthy subjects (72 men and 81 women), ranging between 18 and 82 years, from the ICBM database of normal adults (http://www.loni.ucla.edu/ICBM/). Subjects with any potential medical disorders that could affect brain structure or function as well as subjects with brain-structural abnormalities in their MRI scans had been excluded from this database (Mazziotta et al., 2009). To minimize the confounding effects of age-related brain atrophy on outcomes of the present study, we additionally excluded all subjects who were older than 70 years. The images of the remaining sample of 145 subjects (72 men and 73 women) were preprocessed as detailed below to calculate the total brain volumes (TBVs). Based on the resulting TBVs, we created two samples of subjects.
Sample I (hereafter referred to as “matched sample”) consisted of 48 subjects (24 men and 24 women) carefully matched for TBV. The maximum difference of TBV within a matched pair was 5.16 ml. Age ranged between 19 and 69 years (men: 21–61 years; women: 19–69 years). The mean age of matched men and matched women did not differ significantly (for means and SDs, see Table 1). The matched sample included five left-handers (two men; three women); handedness information was obtained using the ICBM Demographic and Neurocognitive Inventory (http://ric.uthscsa.edu:9000/icbm_dani/).
Table 1.
Age and total brain volume (TBV)
| Matched sample (n = 48) |
Extreme sample (n = 48) |
|||
|---|---|---|---|---|
| Men (n = 24) | Women (n = 24) | Men (n = 24) | Women (n = 24) | |
| Age | 42.96 ± 12.31 | 43.88 ± 14.74 | 39.33 ± 14.79 | 45.75 ± 13.64 |
| TBV | 1406.57 ± 101.69 | 1406.62 ± 101.41 | 1623.74 ± 68.94 | 1221.58 ± 62.99 |
Age (mean ± SD) is shown in years; TBV (mean ± standard deviation) is shown in milliliters. Matched men and matched women do not differ with respect to TBV. Extreme men consist of men with the largest TBVs; extreme women consist of women with the smallest TBVs.
Sample II (hereafter referred to as “extreme sample”) also consisted of 48 subjects (24 men and 24 women) and represented the female subjects with the smallest TBVs as well as the male subjects with the largest TBVs. Of note, there was no overlap to subjects from the matched sample to ensure independence of data in subsequent statistical analyses. Age ranged between 18 and 69 years (men: 18–69 years; women: 19–65 years). The mean age of extreme men and extreme women did not differ significantly. The matched sample included seven left-handers (four men; three women). All subjects gave informed consent according to institutional guidelines of the University of California, Los Angeles (UCLA) Institutional Review Board.
Image acquisition.
All brain images were acquired on the same site (UCLA) and on the same scanner (a Siemens Sonata 1.5-T MRI system) using a three-dimensional T1-weighted sequence (magnetization-prepared rapid-acquisition gradient echo) with the following parameters: repetition time = 1900 ms; echo time = 4.38 ms; flip angle = 15°; 160 contiguous 1 mm sagittal slices; field of view = 256 × 256 mm; matrix size = 256 × 256; voxel size = 1.0 × 1.0 × 1.0 mm.
Preprocessing.
Data were processed and examined using the SPM8 software (Wellcome Department of Imaging Neuroscience Group, London, UK; http://www.fil.ion.ucl.ac.uk/spm) and the VBM8 toolbox (http://dbm.neuro.uni-jena.de/vbm.html). That is, within the same generative model (Ashburner and Friston, 2005), images were corrected for bias-field inhomogeneities, registered using linear (12-parameter affine) and nonlinear transformations, and tissue-classified into GM, white matter (WM), and CSF. The segmentation procedure was further refined by accounting for partial volume effects (Tohka et al., 2004), by applying adaptive maximum a posteriori estimations (Rajapakse et al., 1997), and by applying a hidden Markov random field model (Cuadra et al., 2005), as described by Gaser (2009).
Total brain volume analysis.
Using the tissue-classified partitions, global tissue volumes were determined in milliliters by counting the voxels representing GM, WM, and CSF in their native dimensions. TBV was calculated by adding GM, WM, and CSF volumes and used as determinant to create the two main samples of this study (i.e., the matched sample and the extreme sample), as described above. After establishing the two main samples, male and female subgroups were compared with respect to TBV. In addition, we calculated the brain size-adjusted global tissue volumes (ratios) by dividing the GM, WM, and CSF volumes by the TBV. We then compared these GM, WM, and CSF ratios between matched men and matched women.
Regional gray matter volume analysis.
The GM partitions were modulated to preserve actual GM values locally, while still accounting for individual differences in brain size (via proportional scaling). For this purpose, the normalized GM partitions were multiplied by the nonlinear components (but not the linear components) derived from the normalization matrix. Finally, the modulated GM volumes were smoothed with a Gaussian kernel of 12 mm full width at half maximum (FWHM). Using these smoothed GM segments, we conducted the statistical analyses, as outlined below.
We included the four groups consisting of the 24 matched men, the 24 matched women, the 24 extreme men (i.e., with the largest TBV), and the 24 extreme women (i.e., with the smallest TBV) into a 2 × 2 analysis of covariance (ANCOVA) design, with age as nuisance variable. That is, conducting voxelwise F tests, we estimated (1) the main effects of sex, (2) the main effects of brain size, and (3) sex × brain size interactions, while removing the variance associated with age. More specifically, the main effect of sex was estimated by contrasting male subjects (i.e., matched men and extreme men) against female subjects (i.e., matched women and extreme women). The main effect of brain size was estimated by comparing subjects with larger brain sizes (i.e., matched women and extreme men) against subjects with smaller brain sizes (i.e., matched men and extreme women). To avoid possible edge effects between different tissue types, all voxels with GM values of <0.1 were excluded (absolute threshold masking). Statistical outcomes were corrected for multiple comparisons using false discovery rate (FDR) at p = 0.05. Significant findings were restricted to clusters exceeding the expected numbers of voxels per cluster (spatial extent threshold), calculated according to the theory of Gaussian random fields. Significant main effects were followed up with post hoc t tests to investigate the differences between male and female subgroups. More specifically, we compared (1) extreme women and extreme men; (2) matched women and extreme men; (3) extreme women and matched men; and (4) matched women and matched men. Although post hoc tests were corrected for multiple comparisons using FDR at p = 0.05 with appropriate extent thresholds applied, we also generated a series of maximum intensity projections without applying extent thresholds and not corrected for multiple comparisons at p = 0.001. Of note, only uncorrected outcomes allow for a direct comparability between significance profiles of different comparisons because applying FDR corrections results in different T thresholds due to the adaptive behavior of the FDR procedure (Nichols and Hayasaka, 2003).
Results
Total brain volumes
As expected, there were significant TBV differences between all men (n = 48) and all women (n = 48), with larger volumes in men (p < 0.001). Table 1 shows the means and SDs for male and female subsamples. As expected, there were no significant differences with respect to TBV between the matched men and the matched women (there were also no significant differences with respect to GM, WM, and CSF ratios).
There were significant differences between the extreme men and the extreme women (p < 0.001) with larger TBVs in men. There were also significant differences between the extreme men and the matched women (p < 0.001), as well as between the matched men and the extreme women (p < 0.001), with larger TBVs in men. The mean differences between men and women in the latter two comparisons were similar (i.e., 217 and 185 ml, respectively) and considerably smaller than when comparing male and female extremes (402 ml).
Regional gray matter volumes
As illustrated in Figure 1a, for the comparisons of regional GM volumes between all men and all women, we revealed significant main effects of sex at p = 0.05 (FDR-corrected) and restricting outcomes to clusters exceeding k = 1000 voxels (i.e., the calculated spatial extent threshold according to the theory of Gaussian random fields). There were no significant effects of brain size and no significant interactions between sex and brain size.
Figure 1.
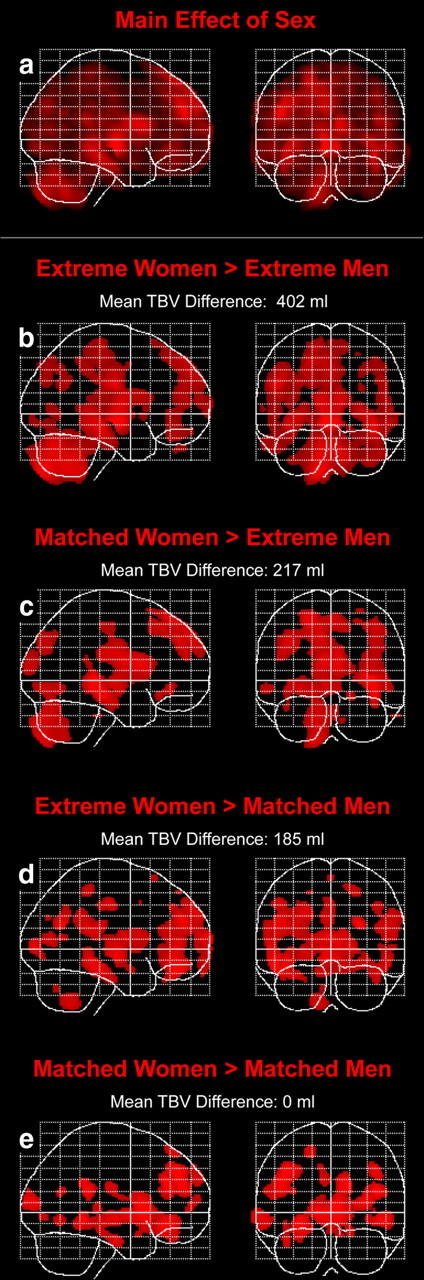
Sex differences in regional GM (main effect and subsamples). Displayed are maximum intensity projections superimposed onto the SPM standard glass brain template (sagittal and coronal view). a illustrates the main effect of sex (bidirectional). Statistical outcomes are corrected for multiple comparisons using FDR at p = 0.05. Shown are clusters exceeding a spatial extent threshold of 1000 voxels, which corresponds to the expected numbers of voxels per cluster. b–e illustrate the outcomes of the subsequent post hoc tests, where women have larger regional GM volumes than men (women > men). The illustrated spatial profiles are significant at p = 0.001 (uncorrected) without applying cluster extent thresholds.
When conducting post hoc tests, there were no regions of larger GM volumes in men than in women at p = 0.001 (uncorrected), regardless of which subgroups were compared with each other. In contrast, we revealed a number of regions where women had larger GM volumes than men at p = 0.001 (uncorrected). These sex effects (women > men) decreased slightly when brain size differences between men and women declined (Fig. 1b–e). Importantly, we also revealed clusters of significantly larger GM volumes in women than in men in all four comparisons when applying FDR corrections at p = 0.05 and restricting outcomes to clusters exceeding k = 1000 voxels.
Figure 2 provides the detailed T statistics associated with the specific comparison within the matched sample at p = 0.05 (FDR-corrected) and k = 1000. As illustrated, we revealed significantly larger GM volumes in women than in men in the following three main clusters: cluster 1 (k = 6505) consisted of the left and right caudate (extending into other regions of the basal ganglia as well as into the left orbitofrontal region). Cluster 2 (k = 2224) comprised regions of the left superior temporal gyrus, and cluster 3 (k = 1982) encompassed regions of the left superior frontal gyrus (for MNI coordinates pertaining to cluster-specific local maxima, refer to Fig. 2).
Figure 2.

Sex differences in regional GM (matched sample). Displayed are section views of the single subject SPM standard brain. The clusters indicate brain regions where the matched women had significantly larger GM volumes than the matched men. The color intensity represents t-statistic values at the voxel level. Statistical outcomes are corrected for multiple comparisons using FDR at p = 0.05. Shown are clusters exceeding a spatial extent threshold of 1000 voxels and the respective cluster-specific local maxima (see crosshairs), including their MNI coordinates. The results are presented in neurological convention (right is right).
Exploratory analyses
Although there was a lack of clusters indicating a significant main effect of brain size (or interactions between brain size and sex), we conducted further exploratory analyses to investigate possible trends when comparing small and large brains within males only (i.e., matched vs extreme men; mean difference: 217 ml) and also separately within females only (i.e., extreme vs matched women; mean difference: 185 ml). For this purpose we abstained from applying corrections for multiple comparisons. However, none of these comparisons revealed any significant clusters at p = 0.001, uncorrected.
Discussion
Brain size effects versus sex effects
The main goal of this study was to determine whether brain size accounts for what appear to be sex differences, or whether the observed anatomical differences between male and female brains exist independently of brain size effects. During the first step of the statistical analysis (F tests), we observed that there was a significant main effect of sex (but no main effect of brain size and no interaction between the two). However, both sex and brain size effects might have contributed to the main effects of sex, because all men and all women, together, differed significantly with respect to TBV. Thus, we conducted post hoc comparisons (t tests) between matched men and matched women, who did not differ with respect to TBV. Any significance clusters would indicate pure sex effects independent of brain size. Indeed, we revealed a number of regions where matched women had significantly larger GM volumes than in matched men, suggesting that anatomical differences between male and female brains exist independently of brain size effects.
In addition, we conducted post hoc analyses (t tests) comparing men and women whose TBVs differed at various degrees. If brain size had a significant impact on regional GM volumes, then observed sex effects should change drastically depending on the degree to which male and female groups differed with respect to TBV. Interestingly, sex effects became less pronounced the more male and female TBVs resembled each other (Fig. 1b–e). However, differences between profiles were rather small. Together with the lack of significant brain size effects (F tests) as well as the lack of significant differences between small and large brains within males and within females (exploratory analyses), our study seems to indicate that brain size effects on observed sex differences are negligible. These findings and conclusions corroborate implications from the one existing study comparing a subset of 18 males and 18 females matched for brain size (Sowell et al., 2007). Sowell and colleagues revealed a larger cortical thickness in females in several brain regions and reported that “the pattern of results in the subset of matched subjects is similar to that observed in the whole group.”
While these outcomes appear to disagree with previous findings indicating that brain volume (rather than sex) is the main variable accounting for differences in GM proportion (Lüders et al., 2002; Leonard et al., 2008), they are not contradicting but complementary if brain size effects account for global tissue volumes (and the size of selected predefined structures), while sex effects account for regional GM (and regional cortical thickness). In strong agreement with this assumption, we detected significant differences between matched men and matched women with respect to regional GM, but not with respect to global tissue ratios.
Spatial location of sex effects
While we did not detect any regions of larger GM volume in men than in women, there were a number of regions indicating larger GM volumes in women than in men. We will comment on significance clusters detected when comparing matched women and matched men in particular. This constitutes the special case of this study, where possible effects of brain size can be excluded with certainty. As detailed below, there is a strong resemblance between current findings and outcomes from previous studies (i.e., where men always exhibited larger brains than women). Of note, brain size matching is not proposed to substitute traditional analyses that include men and women with different brain sizes. Such analyses will continue to provide important clues about differences between male and female brains, especially if appropriate strategies are used to account for individual differences in brain size. However, brain size matching, as applied in the present study, clarifies whether observed sex differences are attributable to brain size or to biological sex per se.
Comparing men and women with identical brain sizes, we detected the largest clusters in the right and left caudate extending into adjacent regions of the basal ganglia, as well as into the left orbitofrontal region (cluster 1). Larger GM volumes in the female caudate agree with findings by Good et al. (2001), who detected an increased GM concentration in females compared with males adjacent to the caudate heads; they also corroborate observations by Giedd et al. (1996) and Filipek et al. (1994), who reported increased relative caudate volumes in females compared with males. In addition, increased GM volumes in the female left orbitofrontal region seems to confirm outcomes from the above mentioned study by Good et al. (2001), who reported increased GM volumes in females in the inferior frontal gyri (however, the exact spatial correspondence with our findings cannot be established, as figures and coordinates were not provided). Furthermore, the findings of larger left orbitofrontal GM volumes in women resemble findings of thicker cortices in this particular region in female brains (Luders et al., 2006a).
The other two main clusters detected in the current study were located in the left superior temporal gyrus (cluster 2) and the left superior frontal gyrus (cluster 3). Interestingly, both of these regions have been previously reported to show 12.8% (superior temporal gyrus) and 23.2% (dorsolateral prefrontal cortex) greater GM percentages (corrected for overall brain size and age) in females than in males (Schlaepfer et al., 1995). Similar findings come from other studies where the brain size-adjusted volumes of the superior frontal cortex as well as its GM concentration were found to be larger in females than in males (Goldstein et al., 2001; Luders et al., 2006a). In addition, the volume of the superior temporal cortex (expressed as a proportion of total cerebral volume) was reported to be 17.8% larger in females than in males (Harasty et al., 1997). In further agreement with current outcomes, the brain size-adjusted volumes of the primary auditory cortex were found to be significantly larger in women than in men (Rademacher et al., 2001). Moreover, GM volumes as well as GM concentration, and cortical thickness measures were observed to be larger in females in the banks of the left superior temporal sulcus (Good et al., 2001), within Wernicke's area (Luders et al., 2005), and across large parts of the superior temporal gyrus (Luders et al., 2006a). Importantly, Sowell and colleagues who analyzed males and females, matched for brain size, also observed the left superior temporal gyrus to be one of the regions, where females had significantly thicker cortices than males (Sowell et al., 2007).
Possible functional implications and further considerations
Regional GM is a composite measure of different microunits, such as neuronal bodies, axons, dendrites, synapses, glia cells, and others. Given that MRI signal strength is somewhat related to cellular characteristics, it is tempting to immediately relate the larger female GM volumes to specific cognitive functions (i.e., in which women show better performance). For example, if a larger regional GM volume reflects more numerous neurons, such tissue enlargements might be advantageous by facilitating an efficient processing of ingoing and outgoing information, which might be beneficial for cognitive performances. In support of this assumption, histological data has shown regionally increased female neuronal densities in the posterior temporal cortex (Witelson et al., 1995) and greater dendritic values in Wernicke's area (Jacobs et al., 1993). This seems to agree with our findings of increased GM concentration in the left posterior superior temporal gyrus. Given that parts of the superior temporal gyrus are involved in language processing, one could speculate that the observed larger GM volumes in females are associated with women's superior language skills (Kimura, 1999). However, further studies characterizing the relationship between cerebral microstructure, observable differences in brain anatomy, and brain function is clearly necessary before we can precisely interpret the regional sex differences. Regardless their functional relevance, we suggest that the observed increased regional GM volumes in female brains constitute sex-dependent redistributions of tissue volume (rather than individual adjustments to brain size). Future research needs to resolve the exact underlying mechanisms (e.g., neurogenesis, synaptogenesis, apoptosis, and/or synaptic pruning), the precise nature of their determinants (e.g., direct genetic versus hormonal effects), as well as their possible evolutionary relevance (e.g., sex-dependent selection for certain skills).
Footnotes
This work was supported by the National Institutes of Health (NIH) through the NIH Roadmap for Medical Research, Grant U54 RR021813 entitled Center for Computational Biology. Additional support was provided by NIH (P41 RR013642 and M01 RR000865), by the National Center for Research Resources (RR12169, RR13642, and RR00865), and by Dr. Gaser's Bundesministerium für Bildung und Forschung grant (01EV0709a). Further support was provided by grants from the Human Brain Project (P20-MHDA52176 and 5P01-EB001955) and the following National Institutes: Biomedical Imaging and Bioengineering, Mental Health, Drug Abuse, Cancer, and Neurologic Disease and Stroke. For generous support, we also thank the Brain Mapping Medical Research Organization, the Robson Family, the Northstar Fund, and the following foundations: Brain Mapping Support, Pierson-Lovelace, Ahmanson, Tamkin, William M. and Linda R. Dietel Philanthropic Fund at the Northern Piedmont Community, Jennifer Jones-Simon, and Capital Group Companies.
References
- Ashburner J, Friston KJ. Unified segmentation. Neuroimage. 2005;26:839–851. doi: 10.1016/j.neuroimage.2005.02.018. [DOI] [PubMed] [Google Scholar]
- Cosgrove KP, Mazure CM, Staley JK. Evolving knowledge of sex differences in brain structure, function, and chemistry. Biol Psychiatry. 2007;62:847–855. doi: 10.1016/j.biopsych.2007.03.001. [DOI] [PMC free article] [PubMed] [Google Scholar]
- Cuadra MB, Cammoun L, Butz T, Cuisenaire O, Thiran JP. Comparison and validation of tissue modelization and statistical classification methods in T1-weighted MR brain images. IEEE Trans Med Imaging. 2005;24:1548–1565. doi: 10.1109/TMI.2005.857652. [DOI] [PubMed] [Google Scholar]
- Filipek PA, Richelme C, Kennedy DN, Caviness VS., Jr The young adult human brain: an MRI-based morphometric analysis. Cereb Cortex. 1994;4:344–360. doi: 10.1093/cercor/4.4.344. [DOI] [PubMed] [Google Scholar]
- Gaser C. Partial volume segmentation with adaptive maximum a posteriori (MAP) approach. Abstract #802; Human Brain Mapping (HBM) Conference; San Francisco. 2009. [Google Scholar]
- Giedd JN, Snell JW, Lange N, Rajapakse JC, Casey BJ, Kozuch PL, Vaituzis AC, Vauss YC, Hamburger SD, Kaysen D, Rapoport JL. Quantitative magnetic resonance imaging of human brain development: ages 4–18. Cereb Cortex. 1996;6:551–560. doi: 10.1093/cercor/6.4.551. [DOI] [PubMed] [Google Scholar]
- Goldstein JM, Seidman LJ, Horton NJ, Makris N, Kennedy DN, Caviness VS, Jr, Faraone SV, Tsuang MT. Normal sexual dimorphism of the adult human brain assessed by in vivo magnetic resonance imaging. Cereb Cortex. 2001;11:490–497. doi: 10.1093/cercor/11.6.490. [DOI] [PubMed] [Google Scholar]
- Good CD, Johnsrude I, Ashburner J, Henson RN, Friston KJ, Frackowiak RS. Cerebral asymmetry and the effects of sex and handedness on brain structure: a voxel-based morphometric analysis of 465 normal adult human brains. Neuroimage. 2001;14:685–700. doi: 10.1006/nimg.2001.0857. [DOI] [PubMed] [Google Scholar]
- Gur RC, Turetsky BI, Matsui M, Yan M, Bilker W, Hughett P, Gur RE. Sex differences in brain gray and white matter in healthy young adults: correlations with cognitive performance. J Neurosci. 1999;19:4065–4072. doi: 10.1523/JNEUROSCI.19-10-04065.1999. [DOI] [PMC free article] [PubMed] [Google Scholar]
- Harasty J, Double KL, Halliday GM, Kril JJ, McRitchie DA. Language-associated cortical regions are proportionally larger in the female brain. Arch Neurol. 1997;54:171–176. doi: 10.1001/archneur.1997.00550140045011. [DOI] [PubMed] [Google Scholar]
- Im K, Lee JM, Lee J, Shin YW, Kim IY, Kwon JS, Kim SI. Gender difference analysis of cortical thickness in healthy young adults with surface-based methods. Neuroimage. 2006;31:31–38. doi: 10.1016/j.neuroimage.2005.11.042. [DOI] [PubMed] [Google Scholar]
- Jacobs B, Schall M, Scheibel AB. A quantitative dendritic analysis of Wernicke's area in humans. II. Gender, hemispheric, and environmental factors. J Comp Neurol. 1993;327:97–111. doi: 10.1002/cne.903270108. [DOI] [PubMed] [Google Scholar]
- Kimura D. Sex and cognition. Cambridge: MIT; 1999. [Google Scholar]
- Leonard CM, Towler S, Welcome S, Halderman LK, Otto R, Eckert MA, Chiarello C. Size matters: cerebral volume influences sex differences in neuroanatomy. Cereb Cortex. 2008;18:2920–2931. doi: 10.1093/cercor/bhn052. [DOI] [PMC free article] [PubMed] [Google Scholar]
- Lüders E, Steinmetz H, Jäncke L. Brain size and grey matter volume in the healthy human brain. Neuroreport. 2002;13:2371–2374. doi: 10.1097/01.wnr.0000049603.85580.da. [DOI] [PubMed] [Google Scholar]
- Luders E, Narr KL, Thompson PM, Rex DE, Jancke L, Steinmetz H, Toga AW. Gender differences in cortical complexity. Nat Neurosci. 2004;7:799–800. doi: 10.1038/nn1277. [DOI] [PubMed] [Google Scholar]
- Luders E, Narr KL, Thompson PM, Woods RP, Rex DE, Jancke L, Steinmetz H, Toga AW. Mapping cortical gray matter in the young adult brain: effects of gender. Neuroimage. 2005;26:493–501. doi: 10.1016/j.neuroimage.2005.02.010. [DOI] [PubMed] [Google Scholar]
- Luders E, Narr KL, Thompson PM, Rex DE, Woods RP, DeLuca H, Jancke L, Toga AW. Gender effects on cortical thickness and the influence of scaling. Hum Brain Mapp. 2006a;27:314–324. doi: 10.1002/hbm.20187. [DOI] [PMC free article] [PubMed] [Google Scholar]
- Luders E, Thompson PM, Narr KL, Toga AW, Jancke L, Gaser C. A curvature-based approach to estimate local gyrification on the cortical surface. Neuroimage. 2006b;29:1224–1230. doi: 10.1016/j.neuroimage.2005.08.049. [DOI] [PubMed] [Google Scholar]
- Mazziotta JC, Woods R, Iacoboni M, Sicotte N, Yaden K, Tran M, Bean C, Kaplan J, Toga AW. The myth of the normal, average human brain—the ICBM experience: (1) subject screening and eligibility. Neuroimage. 2009;44:914–922. doi: 10.1016/j.neuroimage.2008.07.062. [DOI] [PMC free article] [PubMed] [Google Scholar]
- Narr KL, Bilder RM, Toga AW, Woods RP, Rex DE, Szeszko PR, Robinson D, Sevy S, Gunduz-Bruce H, Wang YP, DeLuca H, Thompson PM. Mapping cortical thickness and gray matter concentration in first episode schizophrenia. Cereb Cortex. 2005;15:708–719. doi: 10.1093/cercor/bhh172. [DOI] [PubMed] [Google Scholar]
- Nichols T, Hayasaka S. Controlling the familywise error rate in functional neuroimaging: a comparative review. Stat Methods Med Res. 2003;12:419–446. doi: 10.1191/0962280203sm341ra. [DOI] [PubMed] [Google Scholar]
- Nopoulos P, Flaum M, O'Leary D, Andreasen NC. Sexual dimorphism in the human brain: evaluation of tissue volume, tissue composition and surface anatomy using magnetic resonance imaging. Psychiatry Res. 2000;98:1–13. doi: 10.1016/s0925-4927(99)00044-x. [DOI] [PubMed] [Google Scholar]
- Rademacher J, Morosan P, Schleicher A, Freund HJ, Zilles K. Human primary auditory cortex in women and men. Neuroreport. 2001;12:1561–1565. doi: 10.1097/00001756-200106130-00010. [DOI] [PubMed] [Google Scholar]
- Rajapakse JC, Giedd JN, Rapoport JL. Statistical approach to segmentation of single-channel cerebral MR images. IEEE Trans Med Imaging. 1997;16:176–186. doi: 10.1109/42.563663. [DOI] [PubMed] [Google Scholar]
- Schlaepfer TE, Harris GJ, Tien AY, Peng L, Lee S, Pearlson GD. Structural differences in the cerebral cortex of healthy female and male subjects: a magnetic resonance imaging study. Psychiatry Res. 1995;61:129–135. doi: 10.1016/0925-4927(95)02634-a. [DOI] [PubMed] [Google Scholar]
- Sowell ER, Peterson BS, Kan E, Woods RP, Yoshii J, Bansal R, Xu D, Zhu H, Thompson PM, Toga AW. Sex differences in cortical thickness mapped in 176 healthy individuals between 7 and 87 years of age. Cereb Cortex. 2007;17:1550–1560. doi: 10.1093/cercor/bhl066. [DOI] [PMC free article] [PubMed] [Google Scholar]
- Tohka J, Zijdenbos A, Evans A. Fast and robust parameter estimation for statistical partial volume models in brain MRI. Neuroimage. 2004;23:84–97. doi: 10.1016/j.neuroimage.2004.05.007. [DOI] [PubMed] [Google Scholar]
- Witelson SF, Glezer II, Kigar DL. Women have greater density of neurons in posterior temporal cortex. J Neurosci. 1995;15:3418–3428. doi: 10.1523/JNEUROSCI.15-05-03418.1995. [DOI] [PMC free article] [PubMed] [Google Scholar]