Abstract
Objective
To determine the 3-dimensional (3D) conformation of the injected bolus in the larynx in vocal fold injections, to understand how the bolus interacts spatially with elements of the laryngeal framework, and to relate the above to clinical observations in performing vocal fold injections.
Study Design
Excised cadaveric larynx study.
Setting
Laboratory.
Subjects and Methods
Vocal folds of 12 human excised cadaveric larynges were injected with calcium hydroxylapatite. High-resolution computed tomography scans were obtained of the injected larynges. Densities corresponding to the injected bolus and the laryngeal framework were extracted and processed with MATLAB routines to generate selective 3D reconstructions of the injected bolus within the laryngeal framework. Histology analysis was also performed to correlate with observations from the 3D reconstructions.
Results
Boluses injected into the lateral aspect of the thyro-arytenoid muscle tended to be irregularly shaped, appeared to fill up the paraglottic space, and were associated with significant muscle compression. The vertical thickness of the injected boluses averaged 9.5 mm for lateral boluses and 7.6 mm for medial boluses, which were comparable to the vertical thickness of uninjected vocal folds.
Conclusion
Laterally injected boluses are shaped by spatial constraints imposed by elements of the laryngeal framework. Compression of vocal fold muscle may be a mechanism accounting for stiffness from overinjection. The irregular shapes of some boluses may affect the outcome of subsequent medialization attempts. Injections may enhance the vocal fold contact height as a favorable effect beyond simple medialization.
Keywords: vocal fold injection, injection augmentation, vocal fold medialization, laryngoplasty, 3D analysis, excised larynx
Introduced a century ago by Brünings, vocal fold injection augmentation has remained popular as a means to restore glottic competence for voicing. It is a relatively straightforward and effective surgical intervention that can be performed in the office setting with a high success rate.1 Its current widespread use reflects the development, over the past decade, of new materials for injection and new techniques to deliver them.
Despite the broad application of injection augmentation, little effort has been directed toward assessing the initial fate of the injected bolus, in particular its geometric distribution within the paraglottic space. This inattention contrasts with the relative precision in fashioning type 1 thyroplasty implants, which in principle serve the same anatomical purpose as the injected bolus. The lack of knowledge may partly reflect the technically more forgiving nature of vocal fold injections but also hinders our understanding of why some injections may not achieve the intended functional outcome.
This study examines the spatial distribution of the injected bolus using 3-dimensional (3D) image analysis techniques. From the 3D reconstructions, we attempt to deduce geometric and anatomical principles by which the injected bolus distributes and offer insights not apparent from inspection of conventional 2-dimensional (2D) computed tomography (CT) images. Finally, we relate the findings to clinical observations in performing vocal fold injections.
Methods
An exemption was granted by our Institutional Review Board for this study since the cadaver materials used had no identifiers.
Vocal Fold Injections and CT Scans
Details of vocal fold injections and CT data acquisition were reported previously.2 Calcium hydroxylapatite paste (Radiesse; BioForm Medical, San Mateo, California) was injected into either the lateral or the medial aspect of the vocal folds in 12 nonfixated human cadaveric larynges. Calcium hydroxylapatite was used for its radiographic hyperdensity. The injections were performed with the excised larynges on the bench top under direct visualization, with the needle entering the superior vocal fold surface in a direction perpendicular to the glottic plane. Lateral injections were carried out according to the method of Arnold3 and as described in detail in Rosen and Simpson.4 One injection was made at the junction of the level of the vocal process with the superior arcuate line, and a second injection, if necessary, was made just anterior to the first by several millimeters. The needle was inserted to a depth of approximately 5 mm as indicated by a black mark on the needle. Medial injections were made in the medial aspect of the posterior half of the membranous vocal fold. The depth of injection was adjusted so that the bevel of the needle, approximately 1 mm in length, was just buried. The endpoint of the injections was the midline position of the membranous vocal fold as determined visually by the surgeon. Seven larynges were injected bilaterally (one vocal fold injected medially, the other laterally), and 5 more were injected unilaterally since the contralateral vocal fold was used in a separate study. A total of 19 vocal folds were therefore included in analysis. High-resolution CT images were then acquired of the intact larynges in the coronal plane.2
3D Reconstructions and Image Analysis
Three-dimensional graphical objects representing the laryngeal cartilages, the injected boluses, and mucosal surfaces were generated from the CT coronal images by a selective 3D reconstruction technique described in Mau and Weinheimer.5 Densities corresponding to the object of interest were extracted using hand-drawn masks and built-in filters in Adobe Photoshop CS2 (version 9.0; Adobe, San Jose, California). The extracted images were imported into MATLAB 7.8.0 (The MathWorks, Natick, Massachusetts) and processed with custom routines to generate 3D surface plots.
Assessment of bolus position relative to laryngeal framework elements was performed only for those specimens with sufficient calcification of the laryngeal cartilages to allow good definition of these structures on CT. The 3D reconstructions were visually examined on the computer monitor while they were freely rotated. Individual objects, for example, the thyroid cartilage, could be removed to allow an unobstructed view of the remaining objects to better appreciate their spatial relationships.
The vertical thickness of a bolus at the mid vocal fold was determined graphically. Two points on the bolus were manually picked on the graphics window to correspond with the most superior and inferior points of the bolus object at the mid vocal fold. The distance between the 2 points was then calculated from their coordinates.
Histology and Analysis
Following injection and CT scanning, the vocal folds were resected from the cartilaginous framework and processed for histology. The tissue block was decalcified prior to sectioning. Coronal sections from the midmembranous vocal folds were obtained. The widths of the thyroarytenoid (TA) muscles were measured from digitized images of hemotoxylin and eosin–stained sections. The muscle width was determined at the superior aspect of the free edge and included muscle bundles lateral and medial to the bolus if the muscle was split. The measurements were performed in triplicate and the mean reported.
Results
The subjects and locations of injections are listed in Table 1.
Table 1.
Subjects and Locations of Injections
| Right Vocal Fold | Left Vocal Fold | |
|---|---|---|
| Larynx A | Medial | Lateral |
| Larynx B | NA | Lateral |
| Larynx C | Lateral | Medial |
| Larynx D | Medial | Lateral |
| Larynx E | Lateral | Medial |
| Larynx F | Medial | Lateral |
| Larynx G | Lateral | Medial |
| Larynx H | Lateral | Medial |
| Larynx I | NA | Lateral |
| Larynx J | NA | Lateral |
| Larynx K | NA | Medial |
| Larynx L | Medial | NA |
Internal Validity of 3D Reconstructions
A measure of internal validity for the 3D reconstruction process was obtained by comparing the bolus volume calculated from summing the voxels from CT data with the volume of injectate used as recorded at the time of injection.2 Thirteen of the total 19 hemilarynges were included in bolus size analysis. As shown in Figure 1, there is excellent agreement between the 2 volume measures. The other 6 hemilarynges did not have adequate CT definition of the laryngeal framework to allow meaningful 3D reconstruction but were included for histologic analysis.
Figure 1.
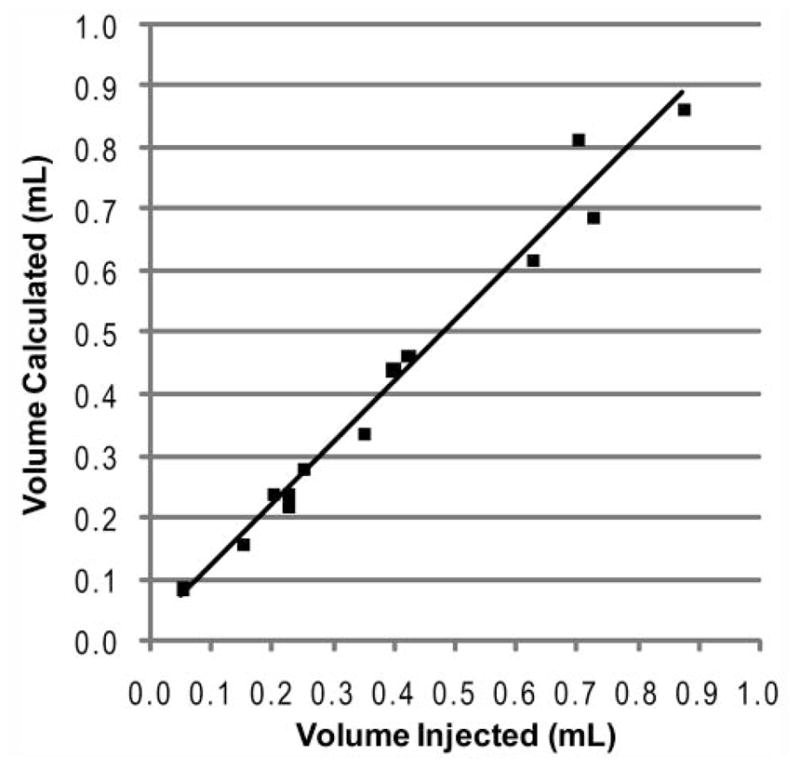
Volume of bolus calculated from computed tomography data vs volume of material injected for the 13 hemilarynges analyzed. The line depicts the least-squares fit to a linear model with an R2 of 0.978 and a slope of 0.988.
General Pattern of Bolus Distribution
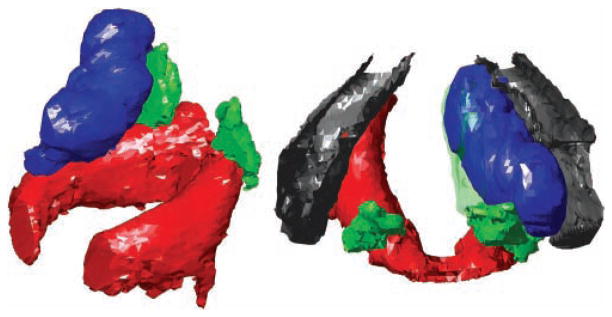
Representative views of the 3D reconstructions are shown in Figures 2 to 4. Three examples are shown to illustrate the range of shapes adopted by boluses injected into the lateral aspect of the TA muscle. These boluses are deposited by injections performed for the indications of vocal fold paralysis, paresis, and atrophy (ie, those injected in a lateral or deep fashion).4 Some boluses appeared relatively smooth (eg, Figure 2). Others adopted more irregular, lumpy configurations (eg, Figures 3 and 4). The more irregular boluses were produced when 2 injections were required to bring the vocal fold to the midline (ie, one injection lateral to the vocal process and a second anterior to the first).
Figure 2.
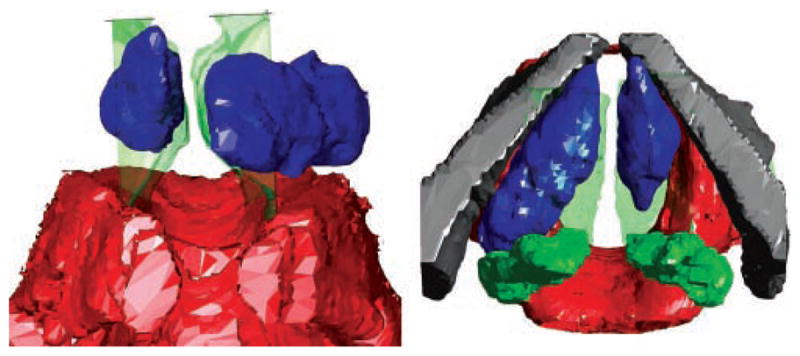
Anterior (left) and superior (right) views of larynx A. The right vocal fold was injected medially, and the left vocal fold was injected laterally. Red, cricoid; green, arytenoids; gray, thyroid; blue, boluses. The mucosal surface is shown as a green transparent surface.
Figure 4.
Left anterior oblique (left) and superior (right) views of larynx C. The right vocal fold was injected laterally. Red, cricoid; green, arytenoids; gray, thyroid; blue, bolus. The mucosal surface is shown as a green transparent surface in the superior view. The oblique view was chosen to highlight the irregular shape of the bolus.
Figure 3.
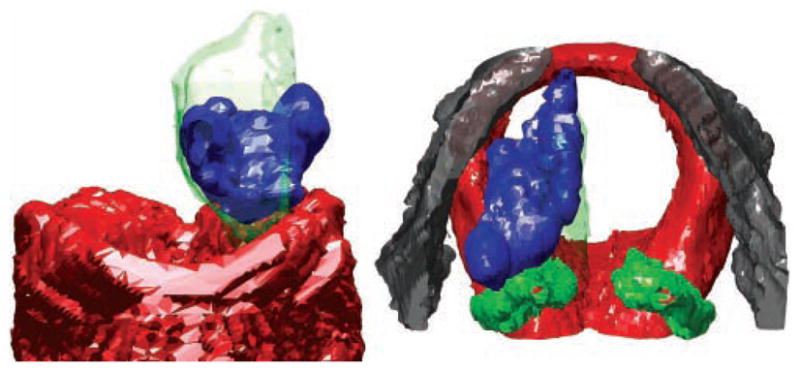
Anterior (left) and superior (right) views of larynx B. The left vocal fold was injected laterally. Red, cricoid; green, arytenoids; gray, thyroid; blue, bolus. The mucosal surface is shown as a green transparent surface.
The 3D reconstructions demonstrated that the lateral boluses tended to fill the paraglottic space. They appeared constrained anterolaterally by the thyroid lamina, posteriorly by the body of the arytenoid, inferolaterally by the superior rim of the cricoid, and inferomedially by the conus elasticus.
Figure 2 also shows a medially injected bolus. Compared with the lateral boluses, medial boluses were more compact and showed less variation from larynx to larynx. They were constrained anteriorly by the thyroid cartilage but otherwise did not contact other parts of the laryngeal framework. They tended to adopt a football shape.
In a previous study, coronal CT images illustrated extrusion of the injected bolus through the cricothyroid space in 20% of the lateral injections.2 This had been thought to occur mostly through the anteroinferior cricothyroid space. Three-dimensional analysis, however, showed also extrusion in the lateral cricothyroid space such that the bolus can be seen between the cricoid and the inferior horn of the thyroid (Figure 5). Consistent with the above observations regarding geometric constraints to bolus distribution, the extrusions tended to occur at gaps between the laryngeal framework elements that constrain the lateral bolus.
Figure 5.
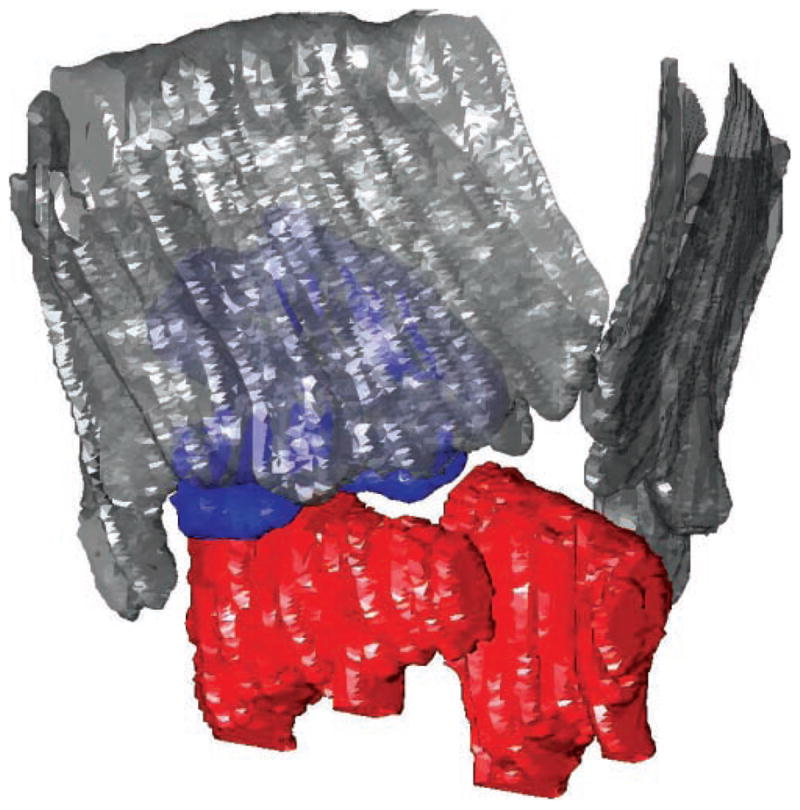
Extrusion of injected lateral bolus through the lateral cricothyroid space. Right anterior oblique view of larynx E is shown. Red, cricoid; gray, thyroid; blue, bolus.
Bolus Vertical Thickness
The vertical depth of each bolus was inconstant along the length of the membranous vocal fold. In lateral boluses, this nonuniformity resulted from their irregular shapes. In medial boluses, the maximum vertical dimension was located roughly at the midpoint of their anterior-posterior axes. Six lateral boluses and 6 medial boluses were reconstructed in 3D and inspected visually. The vertical thickness of the bolus at the mid-membranous vocal fold was measured. The lateral boluses averaged 9.5 ± 0.9 mm in height, and the medial boluses averaged 7.6 ± 1.6 mm. The difference was statistically significant (P = .017 by 1-tailed Student t test). A weak positive correlation was found between the bolus vertical thickness and the vertical thickness of the vocal fold prior to injection, as measured from the superior rim of the cricoid to the level of the ventricle on preinjection CT images2 (Pearson correlation coefficient = 0.56 for lateral boluses and 0.46 for medial boluses). The bolus vertical thickness was strongly correlated with the bolus volume, especially for medial boluses (Pearson correlation coefficient = 0.79 for lateral boluses and 0.96 for medial boluses).
Compression of Vocal Fold Tissue
As the lateral boluses appeared to fill the paraglottic space, we questioned if they compressed vocal fold tissue. Two representative histology sections are shown in Figure 6. These illustrate lateral displacement of the bulk of the TA muscle fibers by a medial bolus and medial displacement of the TA muscle fibers by a lateral bolus. We assessed compression quantitatively by measuring the width of the TA muscle in the histology sections. Compression should entail a reduction in the transverse width of the muscle. Since the preinjection TA muscle width was unknown, we analyzed larynges where one vocal fold was injected medially and other laterally, so that one side served as reference for the other. Since the medial boluses were substantially smaller2 and did not fill the paraglottic space, we reasoned that a compression effect, if present, should be evident from comparison of the widths of the TA muscles between the 2 sides in the same larynx.
Figure 6.
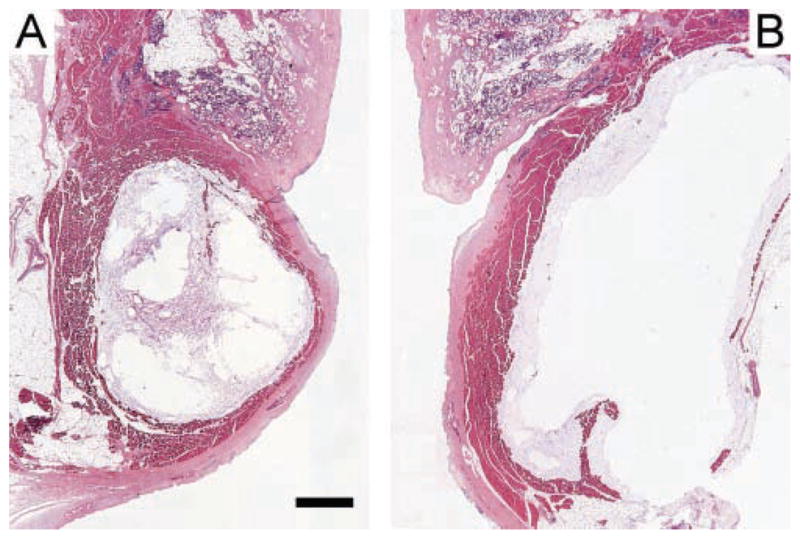
Hemotoxylin and eosin–stained coronal sections of injected vocal folds. (A) Medial bolus displacing most of the thyroarytenoid (TA) muscle fibers laterally. (B) Lateral bolus displacing the TA muscle medially. Both sections derived from the midpoint of the membranous vocal folds in larynx D. The scale bar equals 1 mm.
Table 2 lists the TA muscle widths from the 7 larynges injected bilaterally. In 6 of 7 larynges, the TA muscle was compressed more by the lateral bolus, to an average of 56% of the TA muscle width on the medial bolus side. A compression effect of the lateral bolus on the TA muscle thus appears to be present.
Table 2.
Compression of Thyroarytenoid (TA) Muscle by Injected Boluses
| TA Muscle Width, Lateral Bolus, μm | TA Muscle Width, Medial Bolus, μm | Compression Ratio (Lateral/Medial) | |
|---|---|---|---|
| Larynx A | 586 | 1460 | 0.401 |
| Larynx C | 616 | 1113 | 0.553 |
| Larynx D | 818 | 929 | 0.881 |
| Larynx E | 396 | 381 | 1.038 |
| Larynx F | 458 | 1016 | 0.451 |
| Larynx G | 662 | 1238 | 0.535 |
| Larynx H | 780 | 1529 | 0.510 |
|
| |||
| Average compression ratio | 0.624 | ||
| Average compression ratio excluding larynx E | 0.555 | ||
Discussion
This study is the first to assess in depth the 3D conformation of the deposited bolus from vocal fold injection augmentation. The analysis used 3D image reconstruction techniques to highlight how the injected bolus relates to laryngeal structures, including mucosal surfaces. The geometric distribution of the bolus brings insights to both favorable and unfavorable consequences of injection augmentation that are not apparent from inspection of 2D images alone.
Boluses deposited by injections performed in a lateral or deep fashion can adopt irregular shapes, with nonuniform surfaces. This contrasts with block implant thyroplasty, in which the implants have well-defined contours, but may be similar to the result of Gore-Tex thyroplasty, in which the aggregate shape of the folded strips of Gore-Tex can be irregular.6 All 3 methods have been shown to produce good vocal outcomes, presumably because the intrinsic longitudinal structure of the TA muscle and the fibroelastic nature of the vocal ligament and the conus elasticus mask irregularities of the implants. While the irregular shape of the lateral boluses has no apparent effect on vocal outcome, it may have implications for revision or further surgery. Overcorrection can in principle be remedied by partial removal of the injected bolus,7,8 but complete removal of an irregularly shaped bolus would likely require extensive dissection of the paraglottic space. In addition, in the authors’ experience, silastic implant thyroplasty following injection of a relatively durable material such as calcium hydroxylapatite can be more challenging in some cases. Intraoperative trial medialization at different positions within the thyroplasty window may not produce direct one-toone displacement of the corresponding part of the vocal fold due to an intervening irregularly shaped residual bolus. An implant that deviates from the typical dimensions9 may be required to achieve the best vocal outcome.
The vertical thickness of the vocal fold is a determining factor in the ease of phonation in theoretical models. The phonation threshold pressure, the minimum subglottal pressure required to initiate vocal fold oscillation, is inversely proportional to the vertical thickness of the vocal fold.10 It has been suggested that injection augmentation can increase vocal fold thickness,11,12 but the vertical dimension of injected boluses has not been previously quantified to our knowledge. The bolus vertical depth averaged 7.6 to 9.5 mm in this study (see the Results section), which is slightly greater than the average vocal fold height in the noninjected larynges reported previously.2 This reflects the slight vertical expansion of the paraglottic space and raising of the floor of the ventricle with injection in some specimens. While resorption of carrier fluid within the first few days after injection in vivo will decrease the size of the bolus, it is clear that the bolus not only medializes the vocal fold but also has the potential to augment the vertical thickness of the vocal fold. This effect of injection augmentation may be particularly important in the setting of significant vocal fold atrophy, where the reduction in the cross-sectional area of the TA muscle affects both its width and height.
The vertical thickness of medial boluses was found to be more strongly correlated with injection volume than that of lateral boluses, a quantitative finding consistent with the visual observation that medial boluses were more compact. Medial bolus thickness was also less correlated with vocal fold thickness compared with lateral boluses, supporting the notion that the effect of medial boluses may be less subject to individual anatomical variations.
Findings from this study may explain additional clinical observations. We have noted anecdotally and others have reported that overinjection can result in vibratory stiffness.1 This is generally assumed to be an effect on the vocal fold mucosa. However, demonstration of TA muscle compression by lateral boluses in this study suggests at least another possible mechanism. Analytical modeling of vocal fold vibration based on the body-cover model entails participation of variable depth of the TA muscle in vibration.13 As the amplitude of vibration increases as in loud phonation, a greater depth of the TA muscle becomes involved. Increased stiffness of the TA muscle from bolus compression can be expected to impede vibration by reducing the amount of tissue deep to the cover that can move with the cover. This effect is maximal at the time of the injection. As the resorption of carrier fluid takes place within the first few days and of some injected material over weeks to months, the magnitude of TA muscle compression will presumably decrease, and the apparent vibratory stiffness should resolve. However, it is possible that the TA muscle may undergo some degree of remodeling due to mechanical compression as well as integration of the injected material. Demonstration of an effect on vocal fold vibration due to muscle-injectate interaction will require investigation in vivo.
Another observation relates to repeat injections. In the authors’ experience, patients who undergo a second injection for unilateral vocal fold paralysis after the benefit from the first injection had diminished sometimes derive less-than-expected vocal quality improvement from the second injection. The 3D conformation of the bolus offers a possible partial explanation for this anecdotal experience. While the initial bolus is constrained by the boundaries of the paraglottic space, the second bolus is additionally constrained by whatever material or tissue integration remains from the first injection. This residual effect may be significant when a more durable injectable was used initially. The second bolus therefore may distribute in a less predictable way.
Clinically, injection lateral to the vocal process is sometimes thought to provide additional medialization of the membranous vocal fold by rotating the vocal process medially.11 The 3D analysis calls the basis for this practice into question. The lateral boluses tend to abut the anterior face of the arytenoid body (Figures 2–4). The predominant contact involves an anterior-posterior interface. The direction of contact is unlikely to produce a medial rocking movement of the arytenoid, since the 2 directions are orthogonal. Rather, further medialization of the posterior membranous vocal fold is likely produced by passive movement of the vocal process as the vocal ligament is further medialized by the additional bolus.5
Several aspects of this study deserve clarification. First, although calcium hydroxylapatite was used, the general principles of bolus distribution may be applicable to many other commonly used injectables, such as collagen and hyaluronic acid products, because they are comparably deformable based on their injectability through similar-gauge needles. The 3D bolus conformation may be different for fat, which may not dissect through the paraglottic space as easily, and for Teflon paste, which is highly viscous and may form a more compact initial bolus. Second, the imaging data represent the bolus in its initial state after injection. In a live subject, the bolus may flatten somewhat from glottal closure tasks and will also undergo resorption over time.14 Some of our findings and conclusions therefore have the most implications for injections at the time they are performed and may be less relevant as resorption takes place. Third, even though medial boluses are geometrically better defined than lateral boluses, medial injections have indications specific to lamina propria defects, and only injectables with suitable tissue replacement properties should be used.15
Conclusion
There is value in knowing how injected material distributes in the vocal fold and the larynx. Visualization of the injected bolus in 3 dimensions in the laryngeal framework brings insights to both favorable and unfavorable consequences of injection augmentation that are not apparent from inspection of 2D images alone. Injected boluses not only medialize the free edge but also have sufficient vertical thickness to augment the vertical contact area of the vocal folds. Muscle compression may at least partly account for stiffness from overinjection. Finally, the irregular shapes of some boluses may affect repeat injections or the precision of implant thyroplasty.
Acknowledgments
We thank Dr Lawrence Lustig for the use of his laboratory, BioForm Medical for the donation of Radiesse, and Dr Teresa Chan for critical reading of the article.
Sponsorships: None.
Funding source: Funding for the experimental portion of the study was provided by Hearing Research, Inc. BioForm Medical donated the injectable used in the study. Hearing Research, Inc and BioForm Medical were not involved in the study design or manuscript writing and review. This work was supported by NIDCD grant R01 DC006101S1.
Footnotes
Sponsorships or competing interests that may be relevant to content are disclosed at the end of this article.
Author Contributions
Ted Mau, conception and design, data acquisition and analysis, manuscript writing; Jacquelyn M. Brewer, data analysis; Samuel T. Gatzert, data analysis; Mark S. Courey, conception and design, data acquisition, manuscript revision.
Disclosures
Competing interests: Ted Mau: one-time speaker’s honorarium from BioForm Medical; Mark S. Courey: Lumines Inc speaker, scientific advisor, unrestricted educational grant.
This article was presented at the 2010 AAO-HNSF Annual Meeting & OTO EXPO; September 26–29, 2010; Boston Massachusetts.
Reprints and permission: sagepub.com/journalsPermissions.nav
References
- 1.Sulica L, Rosen CA, Postma GN, et al. Current practice in injection augmentation of the vocal folds: indications, treatment principles, techniques, and complications. Laryngoscope. 2009;120:319–325. doi: 10.1002/lary.20737. [DOI] [PubMed] [Google Scholar]
- 2.Mau T, Courey MS. Influence of gender and injection site on vocal fold augmentation. Otolaryngol Head Neck Surg. 2008;138:221–225. doi: 10.1016/j.otohns.2007.10.028. [DOI] [PubMed] [Google Scholar]
- 3.Arnold GE. Vocal rehabilitation of paralytic dysphonia. X. Functional results of intrachordal injection. Arch Otolaryngol. 1963;78:179–186. doi: 10.1001/archotol.1963.00750020187014. [DOI] [PubMed] [Google Scholar]
- 4.Rosen CA, Simpson CB, editors. Operative Techniques in Laryngology. Heidelberg, Germany: Springer; 2008. Vocal fold augmentation via direct microlaryngoscopy; pp. 197–203. [Google Scholar]
- 5.Mau T, Weinheimer KT. Three-dimensional arytenoid movement induced by vocal fold injections. Laryngoscope. 2010;120:1563–1568. doi: 10.1002/lary.20973. [DOI] [PubMed] [Google Scholar]
- 6.Andrews BT, Van Daele DJ, Karnell MP, et al. Evaluation of open approach and injection laryngoplasty in revision thyroplasty procedures. Otolaryngol Head Neck Surg. 2008;138:226–232. doi: 10.1016/j.otohns.2007.10.016. [DOI] [PubMed] [Google Scholar]
- 7.Anderson TD, Sataloff RT. Complications of collagen injection of the vocal fold: report of several unusual cases and review of the literature. J Voice. 2004;18:392–397. doi: 10.1016/j.jvoice.2002.04.001. [DOI] [PubMed] [Google Scholar]
- 8.Chheda NN, Rosen CA, Belafsky PC, et al. Revision laryngeal surgery for the suboptimal injection of calcium hydroxylapatite. Laryngoscope. 2008;118:2260–2263. doi: 10.1097/MLG.0b013e318184e6ee. [DOI] [PubMed] [Google Scholar]
- 9.Netterville JL, Stone RE, Luken ES, et al. Silastic medialization and arytenoid adduction: the Vanderbilt experience: a review of 116 phonosurgical procedures. Ann Otol Rhinol Laryngol. 1993;102:413–424. doi: 10.1177/000348949310200602. [DOI] [PubMed] [Google Scholar]
- 10.Titze IR. The physics of small-amplitude oscillation of the vocal folds. J Acoust Soc Am. 1988;83:1536–1552. doi: 10.1121/1.395910. [DOI] [PubMed] [Google Scholar]
- 11.Cooper KA, Ford CN. Injection augmentation. In: Sulica L, Blitzer A, editors. Vocal Fold Paralysis. Berlin, Germany: Spring; 2006. pp. 97–103. [Google Scholar]
- 12.Scherer RC. Physiology of phonation: a review of basic mechanics. In: Ford CN, Bless DM, editors. Phonosurgery: Assessment and Surgical Management of Voice Disorders. New York, NY: Raven Press; 1991. pp. 77–94. [Google Scholar]
- 13.Titze IR. Principles of Voice Production. Iowa City, IA: National Center for Voice and Speech; 2000. [Google Scholar]
- 14.Chhetri DK, Jahan-Parwar B, Hart SD, et al. Injection laryngoplasty with calcium hydroxylapatite gel implant in an in vivo canine model. Ann Otol Rhinol Laryngol. 2004;113:259–264. doi: 10.1177/000348940411300402. [DOI] [PubMed] [Google Scholar]
- 15.Rosen CA, Simpson CB, editors. Operative Techniques in Laryngology. Heidelberg, Germany: Springer; 2008. Superficial vocal fold injection; pp. 205–207. [Google Scholar]


