Abstract
This paper reviews the imaging appearance of benign and malignant bone tumors of the maxillofacial region. A benign bone tumor commonly appears as a well circumscribed lesion. The matrix of the tumor may be calcified or sclerotic. Malignancies often display aggressive characteristics such as cortical breakthrough, bone destruction, a permeative pattern and associated soft-tissue masses. Computed tomography scan is an excellent imaging modality for accurate localization of the lesion, characterization of the tumor matrix and detection of associated osseous changes such as bone remodeling, destruction or periosteal reaction. Magnetic resonance imaging is of limited value in the evaluation of maxillofacial bone tumors.
Keywords: Benign, Bone, Imaging, Malignant, Tumor
INTRODUCTION
A spectrum of benign and malignant bone tumors may be seen in the maxillofacial region. Knowledge of the pathologic features of these tumors and how these features are reflected in their imaging appearance is essential for diagnosis. Familiarity with the imaging appearance, common location, age and gender of bone tumors of the maxillofacial region facilitates the diagnosis and helps radiologists to narrow the list of differential diagnoses and allows for definitive diagnosis in some cases. Early diagnosis of bone tumors is crucial in promoting aggressive treatment, often allowing complications to be avoided[1-4].
Computed tomography (CT) is commonly used for imaging the maxillofacial region. A bone window algorithm better delineates the details of a bony lesion. CT scanning is sensitive for detecting calcified tumor matrix, bone changes and cortical destruction. Magnetic resonance (MR) imaging is not frequently used for the diagnosis of bony maxillofacial lesions. Routine T2- and T1-weighted images and a post-contrast study may be used for the diagnosis of soft tissue lesions with bony tumors[2-5].
Bone tumors of the maxillofacial region may arise from osteogenic, chondrogenic, fibrogenic, vascular, hematopoietic and other elements of the bone. Table 1 shows the World Health Organization classification of benign and malignant bone tumors of the maxillofacial region[6]. Table 2 shows the imaging appearance of bone tumors of the maxillofacial region.
Table 1.
World Health Organization classification of benign and malignant bone tumors of the maxillofacial region[1]
| Benign | Malignant | |
| Osteogenic | Osteoma | Osteosarcoma |
| Osteoid osteoma | ||
| Osteoblastoma | ||
| Chondrogenic | Chondroblastoma | Chondrosarcoma |
| Chondromyxoid fibroma | ||
| Chondroma | ||
| Osteochondroma | ||
| Fibrogenic | Fibrous dysplasia | Fibrosarcoma |
| Vascular | Hemangioma | Hemangioendothelioma |
| Hematopoietic | - | Plasmacytoma |
| Lymphoma | ||
| Others | Giant cell tumor | Chordoma |
| Aneurysmal bone cyst | Ewing sarcoma | |
| Meningioma |
Table 2.
Computed tomography and magnetic resonance imaging appearance of bone tumors of the maxillofacial region
| Incidence | Computed tomography | Magnetic resonance imaging | |
| Osteoma | 5th-6th decade | Compact: dense sclerotic | Compact: signal void |
| Cancellous: mixed densities | Cancellous: low to absent signal | ||
| Sharp, well defined lesion attached by a broad base or pedicle to the bone | |||
| Osteoid osteoma | 2nd-3rd decade | Radio lucent nidus (< 1.5 cm) surrounded by dense sclerosis | Non specific signal intensity with patchy enhancement |
| Osteoblastoma | 2nd decade | Expansile lesion with cortical shell | Non specific signal intensity |
| May mixed or sclerotic lesion | |||
| Chondroblastoma | More than 30 yr | Lytic lesion with central calcifications and peripheral thin cortical shell | Signal void regions of calcification |
| Chondromyxoid fibroma | 2nd-3rd decade | Well-demarcated expansile lesion with multiple foci of calcification | Signal void regions of calcification |
| Chondroma | Less than 50 yr | Small polypoid mass with few discrete areas of calcifications | Non specific appearance |
| Osteochondroma | 2nd-4th decade | Mushroom shaped bony outgrowth with calcified cartilagenous cap | Hypointense bony outgrowth with hyperintense cartilaginous cap |
| Fibrous dysplasia | 1st-2nd decade | Ground glass appearance (56%), sclerotic (23%) | Variable signal intensity depends upon amount of fibrous and sclerotic regions |
| Lytic with sclerotic margins (21%) | |||
| Giant cell tumor | 3rd-4th decade | Expansile mass that tends to destroy and remodel the adjacent bone | Low signal on all sequences |
| Aneurysmal bone cyst | 2nd decade | Lytic expansile lesion with multi-locular "soap bubble" (honey comb) and may fluid–fluid levels | Fluid fluid level with septal enhancement |
| Hemangioma | 2nd decade | Sunburst or spoke wheel pattern of radiating trabeculae | Stippled appearance with intense enhancement |
| Meningioma | 4th decade | Osteoblastic or mixed sclerotic lesion | Low signal on all sequences with intense enhancement |
| Osteosarcoma | 3rd decade | Commonly sclerotic lesion with calcified matrix and sunburst periosteal reaction or it may be mixed or lytic lesion | Signal void of calcification and new bone formation with heterogeneous contrast enhancement |
| Chondrosarcoma | 4th-5th decade | Bony destructive lesion with multiple punctate and stippled calcifications | T2WI: hyperintense areas (chondroid) and hypointense areas (calcified). Curvilinear enhancement |
| Ewing sarcoma | 1st-2nd decade | Destructive aggressive mass with mottled lucent areas and sclerosis and onion peal periosteal reaction | Non specific signal intensity with inhomogeneous enhancement |
| Fibrosarcoma | 3rd-6th decade | Destructive bony lesion, frequently associated with extra osseous soft tissue mass | Low to intermediate signal intensity with inhomogeneous enhancement |
| Hemangio-endothelioma | 2nd decade | Multifocal lytic lesion or dense sclerotic lesion | Tubular signal void structures with intense enhancement |
| Chordoma | 4th decade | Hypodense mass with irregular intratumoral calcifications (30%-50%) with bone destruction | Mixed signal intensity with inhomogeneous enhancement |
| Lymphoma | 4th-7th decade | Lytic, sclerotic or mixed lesions that may be associated with soft tissue mass | Non specific magnetic resonance imaging appearance |
| Plasmacytoma | 4th-7th decade | Well defined bony expansile lesion with intense enhancement | Low SI on T1-weighted images, high on T2-weighted images with intense enhancement |
| Metastasis | All ages | Radiolucent lesion with cortical destruction. May sclerotic or mixed lytic and sclerotic | Non specific magnetic resonance imaging appearance |
SI: Signal intensity
The aim of this article is to review the imaging features of bone tumors of the maxillofacial region.
BENIGN TUMOR
Osteoma
Osteoma is the most common osseous tumor in the maxillofacial region. Osteoma is most commonly seen in the 5th to 6th decades of life and the male-to-female ratio is 1.3:1. Osteoma occurs more commonly in the fronto-ethmoidal sinus and is rarely seen in the maxillary and sphenoid sinuses[2]. All osteomas contain three main components: compact bone (ivory), cancellous bone (trabeculae), and fibrous (spongy) tissue. Osteomas are named according to the dominant component. Compact osteomas most often involve the frontal sinus and grow gradually. Cancellous osteomas are located mostly in the maxillary and ethmoid sinuses and grow relatively quickly. Osteomas are slow growing benign tumors. Multiple craniofacial osteomas may be a part of Gardner syndrome. It is usually asymptomatic but may be associated with facial swelling, deformity, mucocele, proptosis, ocular disturbances and pneumocephalus[2,7]. Osteoma appears as a characteristic sharp, well delineated sclerotic lesion attached by a broad base or pedicle to the bone. Osteoma composed exclusively of compact bone is radiodense (Figure 1), while those containing cancellous bone show evidence of internal trabecular structure. CT multiplanar reconstructions allow the precise identification of the site of origin of the lesion, to fully depict course and patency of all sinus paths, and to correctly assess the integrity of thin bony walls such as the lamina papyracea or the cribriform plate. Compact osteomas produce a complete signal void on all MR sequences, so they are often indistinguishable from the surrounding air in the paranasal sinuses and are thus overlooked. Fibrous osteomas have low to absent signal intensity on all MR sequences[2,4,7,8].
Figure 1.
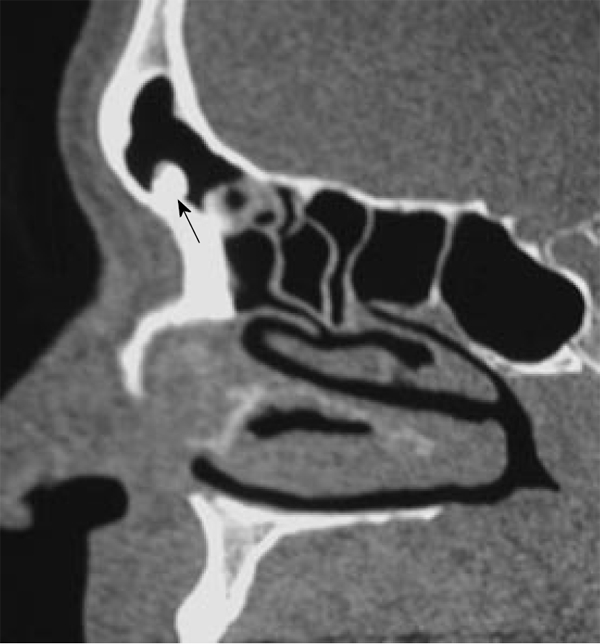
Compact Osteoma. Axial computed tomography scan of the paranasal sinus shows a pathognomonic dense sclerotic mass (arrow) in the frontal sinus.
Osteoid osteoma
Osteoid osteoma is a rare tumor in maxillofacial regions (with a few case reports in the ethmoid region) that affects young males in the 2nd to 3rd decades of life. It is a benign osteoblastic lesion characterized by varying intermixtures of osteoid, newly formed bone, and highly vascular supporting osseous tissue (nidus) surrounded by a distinctive surrounding zone of reactive bone formation. Osteoid osteoma appears on CT scan as a characteristic radio-opaque lesion with a nidus (less than 1.5 cm in diameter) which has a radiolucent center surrounded by dense sclerosis. Occasionally, the nidus may have a radio-opaque calcified center with a surrounding radiolucent area. The osteoid osteoma may even be completely sclerotic. MR appearance of osteoid osteoma depends upon the amount of calcification within the nidus, the size of the fibrovascular zone and reactive sclerosis; so it may not be diagnostic. The mass demonstrates patchy enhancement[9].
Osteoblastoma
Osteoblastoma is typically seen in male patients during the 2nd decade of life. It may be seen in the maxilla, ethmoid, nasal cavity and orbit. It shows a marked amount of osteoid tissue produced by osteoblasts. The osteoclasts are numerous and the background is highly vascular. Histologically, osteoblastoma show some similarity to osteoid osteoma, but they are larger without nidus or zonal architecture and show a stronger, more progressive, occasionally even destructive growth; thus, they are sometimes called aggressive osteoblastoma. The patient presents with pain, facial swelling and asymmetry of the face[4,10]. It is commonly seen as an expansile lytic lesion with cortical shell (Figure 2A), or it may show as mixed lytic and sclerotic or predominately sclerotic bone forming a lesion. Ossification foci with ground glass appearance, cloudy confluent mineralization in the central part of the lesion (75%) may be seen. It exhibits intermediate to low signal intensity on T1-weighted images and high to low signal intensity on T2-weighted images depending upon the amount of ossification. Areas of mineralization appear as zones of low signal intensity on T2-weighted images. It shows variable patterns of contrast enhancement[4,10,11] (Figure 2B and C).
Figure 2.
Osteoblastoma. A: Coronal computed tomography shows a nonspecific expansile lesion (arrows) seen in the the right frontoethmoid air cells with extension into the right orbit. It shows ossific foci; B: Coronal T2-weighted image shows a well-defined mass (arrows) in the right ethmoid air cells with extension into the right orbit. It shows nonspecific intermediate to low signal intensity with signal void regions of calcifications and areas of high signal intensity; C: Axial contrast T1-weighted image shows inhomogeneous patterns of enhancement of the lesion (arrows).
Chondroblastoma
Chondroblastoma is an extremely rare tumor of the maxillofacial region with few case reports. Eighty-three percent of patients with skull chondroblastoma are more than 30 years of age, whereas 92% of patients with chondroblastomas in long bones are less than 30 years of age[12]. It is more commonly seen in the sphenoid and ethmoid and rarely in the maxilla. The tumor is a locally aggressive, well-demarcated expansile lesion. The matrix of the tumor revealed chondroblast and areas of calcification. CT scan confirms the lytic nature of the lesion and shows areas of calcifications in the center and the periphery of the tumor. Areas of low signal intensity on T2-weighted images are secondary to chondroid matrix mineralization. Chondroblastoma of the peripheral skeleton appears to show a different age predilection and characteristically is surrounded by striking peritumoral edema[12,13].
Chondromyxoid fibroma
Chondromyxoid fibroma of the maxillofacial region is typically seen in patients in the 2nd-3rd decade of life with slight female predominance. It is more commonly seen in the maxilla and is unusual in the sphenoid and ethmoid sinuses. The tumor is composed of hypocellular chondroid or myxochondroid tissue with multinucleated giant cells. The CT findings of chondromyxoid fibroma are non specific and almost always suggest a benign lesion. They typically have a lobulated outline with sharp margins, and the majority has a sclerotic rim. The cortex of the bone is usually thinned and expanded. In approximately 50% of cases, a portion of the cortex may be absent. Up to one-third of cases show radiographic evidence of soft tissue extension. The majority of tumors have purely lucent matrix. However, approximately 13% of tumors show some discrete areas of calcification (Figure 3). It exhibits low signal intensity on T2-weighted images due to chondroid and myxoid tissue with an inhomogeneous pattern of enhancement[14,15].
Figure 3.
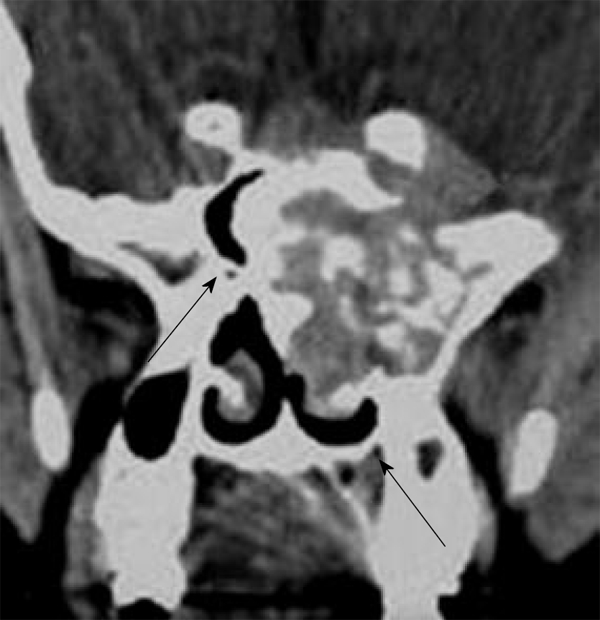
Chondromyxoid fibroma. Coronal computed tomography shows expanded mass in the sphenoid sinus with pathognomonic discrete areas of calcification (arrows).
Chondroma
Chondroma occurs in patients less than 50 years old of either gender. The most frequent sites of occurrence are the nasal cavity (septum) and ethmoid air cells. It is a polypoid firm, smooth surface nodule measuring from 0-5 to 2 cm and rarely greater than 3 cm. Histologically, it is a lobulated tumor composed of chondrocytes, resembling the normal histology of the hyaline cartilage. The differentiation of chondroma from a well-differentiated chondrosarcoma may at times be difficult if not impossible. It may be differentiated from chondrosarcoma by pathology. It shows discrete areas of calcification on CT scan[5,16].
Osteochondroma
Osteochondroma is an extremely rare tumor of the maxillofacial region. The age of incidence ranges between 10 and 40 years, with most patients presenting in the 3rd decade. The male to female ratio ranges from 1:1 to 2:1. It is located in the facial bones, nasal septum, sphenoid sinus, ethmoid cells and zygomatic arch. The reason for the rare occurrence of osteochodroma in the maxillofacial skeleton is the intramembranous development of these bones. It is a benign cartilage-capped osseous growth composed of compact and cancellous bone. Osteochondromas are characterized by the presence of a cartilage cap on top of the tumor; with time, cartilage tissues gradually undergo endochondral ossification and are replaced by bone. It may be multiple in patients with hereditary multiple exostoses[4]. Osteochondroma usually has a pathognomonic pedunculated mushroom shaped bony outgrowth with peripheral cortex and central cancellous bone that arises from the surface of the bone. The cartilaginous cap may or may not be focally calcified. On MR imaging, it shows a peripheral rim of low signal intensity of the cortical bone and central high signal intensity within the cancellous region. A thin hyperintense cartilagenous cap on T2-weighted images may be seen[4,17].
Fibrous dysplasia
Fibrous dysplasia (FD) represents 2.5% of all osseous and 7% of all benign osseous neoplasms. The craniofacial bones are the affected sites in 10%-25% of patients with monostotic FD and in 50% of patients with polyostotic FD[18]. In addition, the craniofacial region may be affected by a form of FD that is not restricted to a single bone, but may be confined to a single anatomical site. This type of the disease has been termed craniofacial FD. In addition, FD may be a component of McCune-Albright syndrome or it may exhibit cherubism phenotype. The monostotic and polyostotic types are known to be related to mutations in the guanine nucleotide-binding protein gene located on chromosome 20q and the craniofacial subtype has not been localized to this chromosome. It is more commonly seen at the 1st to 2nd decade of life at the floor of the anterior cranial fossa[5,19]. It is located in the frontal bone (82%), sphenoid (71%), ethmoid (68%), and maxillary (28%) bones. Histologically, FD consists of varying amounts of spindle cell bundles and trabeculae of immature woven bone. There is replacement of normal spongiosa and filling of the medullary cavity of affected bones by an abnormal fibrous tissue that contains trabeculae of poorly calcified primitive bone formed by osseous metaplasia. It may be associated with aneurysmal bone cyst. Spontaneous malignant transformation of FD is estimated to occur in less than 1% of cases, and osteosarcoma is the most common histological type, followed by fibrosarcoma, chondrosarcoma and malignant fibrohistiocytoma. These malignancies are most commonly found in the maxilla. Most reported cases of malignant degeneration in FD have occurred after radiation therapy.
The imaging appearance of FD depends upon the amount of fibrous and bony element. CT remains the ‘‘gold-standard’’ imaging modality for FD, allowing characterization of the three main imaging patterns of expanded bone. The cortical bone tends to remain intact, with the FD changes most often found in the medullary bone. The CT findings include: pathognomonic ground glass appearance with bone expansion and alternative radiolucent and radiodensity areas (56%), sclerotic pattern with homogenous radiodensity (23%) and lytic appearance with solitary round or oval, well-defined radiolucent with sclerotic margins (21%) (Figure 4). Sclerotic lesions are homogeneously dense, whereas cyst degeneration is the least common finding and is characterized by a spherical or ovoid lucency surrounded by a dense bony shell. On T1-weighted images, the signal intensity is usually low to intermediate depending on the ratio of fibrous tissue to mineralized matrix. On T2-weighted images, lesions with a highly mineralized matrix show low signal intensities, whereas lesions with high fibrous tissue content and cystic spaces return high signal intensities. The lesion may enhance after contrast administration[5,18-21].
Figure 4.
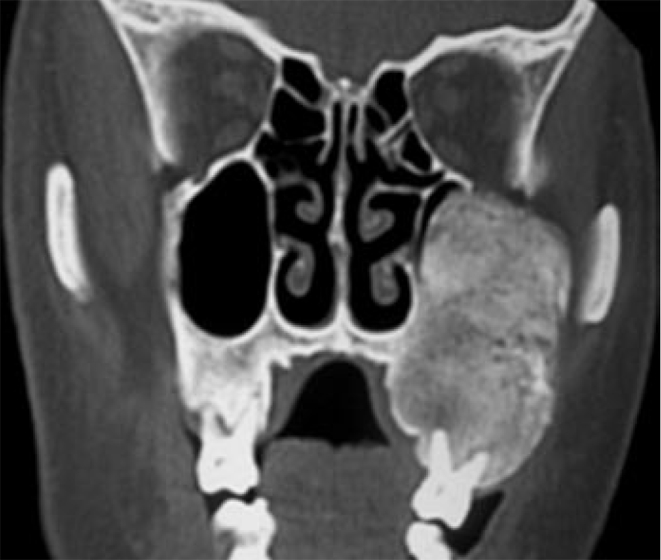
Fibrous dysplasia. Coronal computed tomography scan shows a well-defined expansile bony lesion involving the left maxilla with characteristic ground glass appearance.
Cherubism is a rare autosomal-dominant disorder resulting from different mutations to FD and is therefore a distinct entity at the molecular level. It occurs in children (2-5 years) and is more common in males. It commonly appears as a bilateral and symmetrical multilocular cystic swelling of the mandible with expansion of the maxilla and involvement of the maxillary sinuses. The signal characteristics on MR imaging of cherubism are non-specific[22]. Cherubism has been reported in association with neurofibromatosis type 1 and Noonan-like/multiple giant-cell lesion syndrome[23].
Giant cell tumor
Giant cell tumors occur more commonly during the 3rd and 4th decades of life and are more commonly located in the sphenoid but rarely in the ethmoid bones and the maxilla. It is a benign, locally aggressive tumor characterized by osteoclast-like giant cells. Multicentric tumors with an aggressive course or malignant giant cell tumor with metastasis have been reported. There is a high recurrence rate (40%-60%) after resection[24]. Classically, the tumor destroys the bone and appears as a non-specific rarified area, being a lytic lesion. Although fairly well circumscribed, some cystic changes, ballooning and perforation of the bony cortex may be noted. The area of destruction has a “soap bubble” appearance, with normal trabeculae and little reactive bone at the margin. On MR imaging, it shows fairly low signal intensity on all pulse sequences, and shows moderate to marked contrast enhancement[24,25].
Aneurysmal bone cyst
Aneurysmal bone cyst occurs more commonly in the 2nd decade of life and may be seen in the maxilla, ethmoid, sphenoid bone and periorbital region. These cysts are composed of blood-filled, anastomosing cavernous spaces, separated by cyst-like walls. The precise nature and histogenesis of the aneurysmal bone cyst remains unclear. A primary type has to be differentiated from a secondary form; the latter develops on a preexisting bone lesion such as giant cell tumor, osteoblastoma, or chondroblastoma in 1/3 of patients[3,26]. It appears as an expansile, multi-locular “soap bubble” (honey comb) radio-lucency, causing expansion of the bony cortex. It is surrounded by a marginal thin shell. MR imaging commonly shows cystic spaces with internal septa (Figure 5) and septal contrast enhancement. Fluid-fluid levels of varying intensities might be present and should not be considered diagnostic, as this finding might be present in giant cell tumor, telangiectatic osteosarcoma, and chondroblastoma[26,27].
Figure 5.
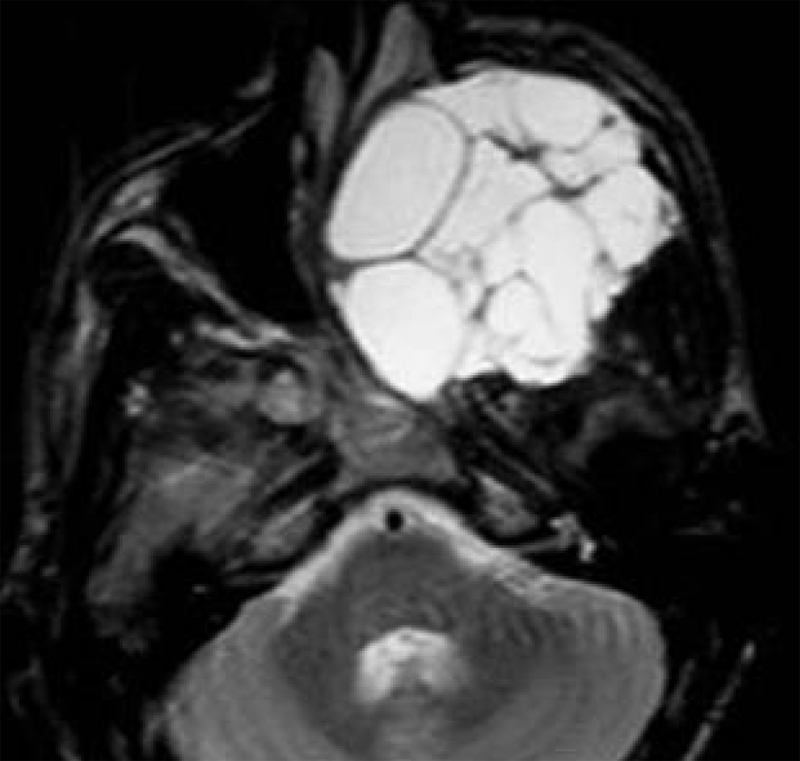
Aneurysmal bone cyst. Axial T2-weighted image shows an expans
Intraosseous (central) hemangioma
Intraosseous hemangioma can occur at any age with the peak incidence being in the 2nd decade of life. An estimated 2:1 female to male ratio has been documented. These tumors occur more commonly in the maxilla and nasal bones and may be found in the orbit. It is a hamartoma with anomalous proliferation of endothelial-lined vascular channels. Hemangiomas are classified into capillary, cavernous and mixed sub-types, depending on the predominant type of vascular channel. It is usually asymptomatic. The characteristic “spoke-wheel”, “wagon-wheel”, “corduroy” or “sunburst” appearance on CT scan arises from thickening of pre-existing trabeculae, secondary to intramembranous bone affected by the vascular channels. T1-weighted images characteristically show hypointensity of the lesion. T2-weighted images reveal heterogeneous hyperintensity within the lesion. A stippled appearance is seen in the tumor matrix. The tumor enhances, intensely or heterogeneously, after the administration of contrast material[28,29].
Intraosseous (central) meningioma
Intra-osseous meningioma forms 1% of all meningiomas that typically occur in the 4th decade of life with female predominance. It is more commonly seen in the orbit and sphenoid ridge and rarely involved in the paranasal sinuses. It is more commonly seen as an osteoblastic or mixed sclerotic lesion. It shows a hyperostotic form that may be associated with inward bulging of the inner table and surface irregularity of the hyperostotic bone. CT is the investigation of choice to detect the tumor, cortical destruction and both intra- and extra-osseous extension. At MR imaging, there is bone thickening that exhibits low signal intensity on all pulse sequences with intense contrast enhancement[30,31].
MALIGNANT TUMOR
Osteosarcoma
Fewer than 10% of osteosarcomas arise in the craniofacial bones with most such tumors developing in the mandible and maxilla. Typically, the tumor affects males in the 3rd decade and one or two decades later in the appendicular skeleton. Osteosarcomas may involve the mandible or maxilla and rarely the ethmoid region. The most common sites of involvement are the body of the mandible and the alveolar ridge or the antral area of the maxilla. The majority of tumors arise within the medullary cavity of the affected bone with rare examples developing on the bony surfaces. It may be secondary to radiation, fibrous dysplasia, Paget disease, trauma, osteomyelitis, ossifying fibroma and giant cell tumor. Osteosarcoma after radiation typically develops after a latency period of 5-10 years after doses in excess of 3000 Gy. These tumors characteristically occur at the edge of the radiation field because the administered radiation is unable to cause cell death but is sufficient to induce malignant transformation. Osteosarcoma can be classified on location into intramedullary, intracortical, periosteal and parosteal (surface) and extraosseous. It can be further categorized according to the prominent type of matrix tissue observed microscopically such as osteoblastic, chondroblastic, fibroblastic, telengectatic and osteoclast-rich types[32,33]. On CT, the tumor displays a spectrum of bone changes from well demarcated borders, notably the low grade osteosarcoma (uncommon), to lytic bone destruction with indefinite margin and variable cortical bone erosion, to the ostoeblastic form, where the bone is sclerotic. The majority of osteosarcomas have matrix mineralization, calcifications of the osteoid or osteoid-Iike substance within the tumor and some tumors show a sunburst effect caused by radiating mineralized tumor spiculae. Cortical breakthrough and interruption of alveolar margin is common in advanced cases. On MR imaging, osteosarcoma is of low to intermediate signal intensity on T1-weighted images and is of high signal intensity on T2-weighted images. Calcifications and new bone formations appear as signal void regions within the lesion that show inhomogeneous patterns of contrast enhancement[1,32-34] (Figure 6).
Figure 6.
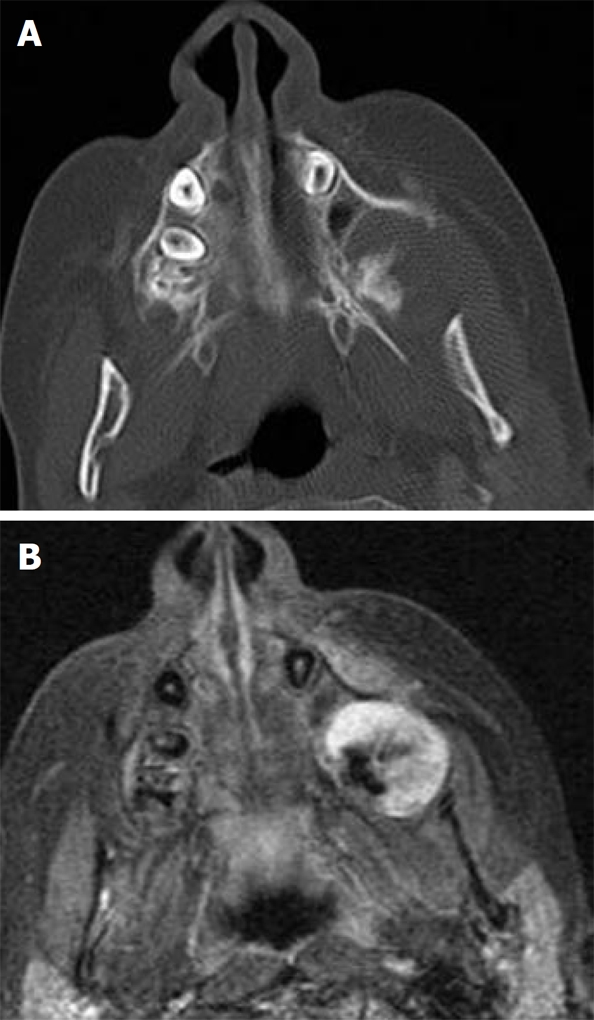
Osteosarcoma. A: Axial computed tomography shows a rather irregular characteristic spiculated mass in the left alveolar margin of the maxilla adjacent to the lateral pterygoid plate; B: Axial contrast T1-weighted image shows inhomogeneous enhancement of the mass with non-enhanced signal void regions of calcification (Courtesy of Castillo M).
Chondrosarcoma
Craniofacial chondrosarcoma accounts for 2% of all chondrosarcomas with a peak incidence during the 4th to 5th decades of life and a male to female ratio of 2.4:1. It is seen in the skull base (common), maxilla and orbit (less common), and cartilage of the nasal septum (rarely). Chrondosarcoma has been reported to develop in association with malignant conditions, such as osteosarcoma, fibrosarcoma, and leukemia, as well as benign conditions, such as Paget disease and fibrous dysplasia[35]. Histologically, chondrosarcoma of the craniofacial region can be divided into subtypes: the conventional subtype with myxoid and/or hyaline components, the aggressive mesenchymal and dedifferentiated subtype and the extremely rare clear cell subtype. The conventional type, which is the most common form, is slow growing, and rarely metastatic. On the other hand, mesenchymal chondrosarcoma is more aggressive and tends to metastasize. They slowly increase in size, and the majority of them are already extensive at the time of diagnosis[36]. On CT scan, chondrosarcoma shows a soft tissue mass with characteristic multiple stippled and amorphous areas of calcifications that may be associated with bone destruction and an inhomogeneous pattern of contrast enhancement (Figure 7). The signal intensity of the chondroid matrix is lower than bone matrix on T1-weighted images. There are hyperintense areas (chondroid tissue) and hypointense areas (calcified regions) on T2-weighted images. The tumor may show characteristic curvilinear septal enhancement of fibrovascular tissue and non-ossified cartilage[1,35-37]. The development of metastases varies among studies and ratios of metastases are between 14% and 90%, with the lungs being the preferred site. Regional cervical lymph node metastases are reported in not more than 5% of all cases.
Figure 7.
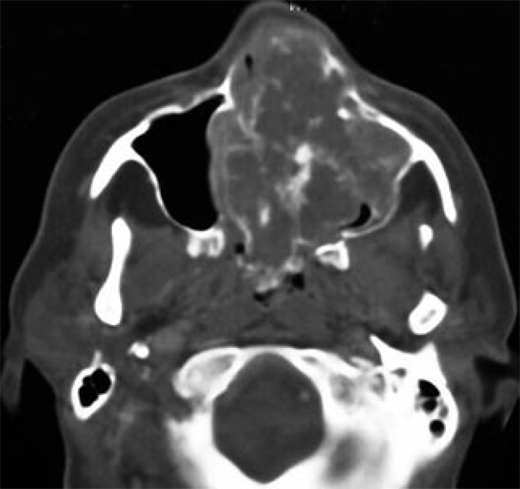
Chondrosarcoma. Axial computed tomography shows bulky mass in the nasal cavity and left maxillary sinus with characteristic stippled and amorphous areas of calcification (arrows).
Ewing sarcoma
Craniofacial Ewing sarcoma accounts for 1%-4% of all Ewing sarcomas with peak incidence between 5 and
20 years old in either sex, although it does have a predication for whites[38]. It may be seen in the orbital wall, sphenoid and maxilla. It is an aggressive, malignant, small round cell tumor of bone. Because of the intense vascularity of the tumor, hemorrhage and necrosis are common. Marked tumor necrosis is considered a poor prognostic factor. The commonest sites of metastases are the lungs and the skeleton that occur in the early course of the disease. Ewing sarcomas appear as a destructive aggressive mass with mottled irregular lucent areas interposed with some sclerosis. The margin is diffuse with unsharp edges and extensive cortical destruction. It may be associated with perpendicular bony spicules and shows the characteristic onion peel appearance of periosteal reaction, and less often with a sunburst type of periosteal reaction. The tumor tends to metastasize early, often to multiple other bony sites and the lungs. On MR imaging, the tumor is heterogeneously hypointense on T1-weighted and heterogeneously hyperintense on T2-weighted scans. On post-contrast T1-weighted images, the lesion shows heterogeneous signal increase with internal hypointense necrotic areas[1,39,40] (Figure 8).
Figure 8.
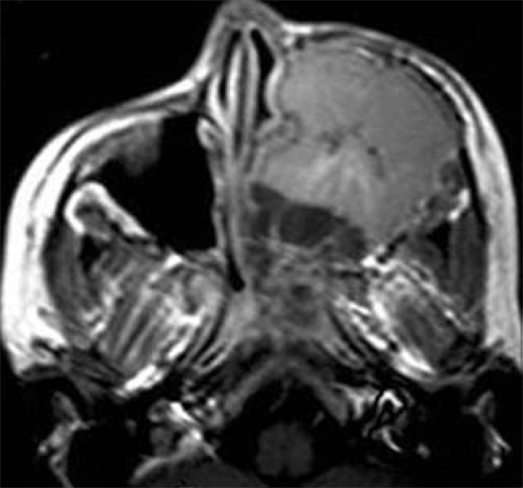
Ewing Sarcoma. Axial contrast T1-weighted image shows a large destructive mass occupying the entire left maxillary sinus. The mass shows inhomogeneous non-specific pattern of contrast enhancement.
Fibrosarcoma
Craniofacial fibrosarcoma is very rare and is seen in the 3rd to 6th decades of life with a slight male predominance. The infantile variant that is seen in patients less than 5 years has a better prognosis. It is rarely seen in the maxilla. It may be central (medullary) or peripheral (periosteal). It is a malignant tumor with variable fibrous intracellular substances devoid of bone or cartilage formation. On CT, fibrosarcoma is a destructive lesion of variable size, frequently associated with extra osseous soft tissue mass. On MR imaging, the tumor shows low or intermediate signal intensity on both T1- and T2-weighted images with an inhomogeneous pattern of contrast enhancement[1,41].
Hemangioendothelioma
Hemangioendothelioma of the maxillofacial region is a low-grade, malignant vascular tumor. Hemangioendotheliomas account for only 0.5% to 1.0% of malignant primary bone tumors. Most of them arise in the third decade and they are prone to occur in the maxillary sinus. Multifocality is present in 9%-14% of cases. The tumor is often large and aggressive. Multifocal lytic lesions (honeycomb appearance), aggressive bony destruction with expansion, dense sclerotic lesion and soft-tissue mass are seen on CT scan (Figure 9). There is a low to intermediate signal intensity on T1-weighted images and slightly high signal intensity on T2-weighted images. Tubular signal-void regions represent blood vessels that may be seen within the lesion. It shows moderate to marked contrast enhancement[42].
Figure 9.
Hemangioendothelioma. Axial computed tomography shows a non-specific sclerotic enhanced lesion related to the posterior part of the nasal septum on the right side (Courtesy of Castillo M).
Chordoma
Chordoma forms 1% of all intracranial tumors that are typically seen in male patients during the 4th decade of life. It is commonly located in the clivus and may extend into the sphenoid and maxillary sinus. It is a benign, locally invasive tumor. It appears as a hypodense mass with irregular intratumoral calcifications (30%-50%) that are associated with variable contrast enhancement and bone destruction. The tumor shows intermediate signal intensity with areas of high signal representing hemorrhage or high protein cystic areas on T1-weighted images. The lesion has relatively high signal intensity associated with areas of low signal intensity that may be seen in the lesion that represents residual fragments or sequestrations of bone on T2-weighted images. After contrast administration, it shows inhomogeneous patterns of enhancement[4,43,44].
Lymphoma
Lymphoma of the maxillofacial region occurs over a broad age range (4th-7th decades) with slight male predominance. The vast majority are large B cell non-Hodgkin lymphomas. On CT scan, lymphoma can produce lytic, sclerotic or mixed lesions that may be associated with soft tissue mass. It appears as isointense to muscles on both T1- and T2-weighted images that are associated with soft tissue mass. The mass shows intense patterns of contrast enhancement. Burkitt’s lymphoma is a special type that may be seen in Africans during the 1st decade of life. It appears as an osteolytic lesion with periosteal reaction and perpendicular spicules of new bone in the maxilla. An extra-osseous soft tissue mass may develop parallel with bone destruction[1,2,45].
Solitary intramedullary plasmacytoma
Plasma cell disorders are characterized by the accumulation of monoclonal plasma cells that produce the same immunoglobulin. Plasmacytomas are plasma cell tumors. They can occur as solitary tumors outside the bone marrow (solitary medullary (bone) plasmacytomas, solitary extramedullary plasmacytomas, but can also be associated with multiple myeloma. Solitary medullary plasmacytoma occurs more commonly in male patients between the 4th and 7th decades of life. It may be seen in the sphenoid sinus and the maxilla. It is a fairly well defined expansile lesion with contrast enhancement. It exhibits low signal intensity on T1-weighted images and high or mixed signal intensity on T2-weighted images with marked contrast enhancement that may simulate meningioma[2,46].
Metastasis
Metastasis is uncommon in the maxillofacial region. The maxillary sinus is most frequently involved (33%) followed by the sphenoid (22%), ethmoid (14%) and frontal (9%) sinuses. In 22% of cases, multiple sinuses are involved. The most common tumor sites to disseminate to this region are the kidney (40%), lung (9%), breast (8%), thyroid (8%) and prostate (7%). The remaining 28% of cases include multiple miscellaneous sites. In 10-15% of cases, the metastases are limited to the nasal cavity. Although the eventual outcome is usually poor, prognosis depends, in part, on whether the sinonasal metastasis is isolated or part of widespread disseminated disease. Metastasis may appear as a localized, well-defined radiolucent lesion in a slow growing lesion, or it may be associated with cortical destruction in a highly aggressive lesion, osteoblastic in breast cancer or mixed lytic or sclerosis in patients with prostate cancer. The tumor exhibits low signal intensity on T1-weighted images and high signal intensity on T2-weighted images that may be associated with an enhancing soft tissue mass[1,47,48].
CONCLUSION
We conclude that imaging plays an important role in the diagnosis of bone tumors of the maxillofacial region. CT scan is an excellent imaging modality for accurate localization of the lesion, characterization of the tumor matrix and detection of associated osseous changes such as bone remodeling, destruction or periosteal reaction. CT scan is sufficient for the diagnosis of most bone tumors of the maxillofacial region. However, MR imaging is of limited value as bone tumors display a non-specific imaging appearance.
ACKNOWLEDGMENTS
We thank Mauricio Castillo, MD, Professor of Radiology at University of North Carolina, Chapel Hill, NC, United States of America for his help with some of the figures in this article.
Footnotes
Peer reviewer: Shu-Hang Ng, MD, Professor, Department of Diagnostic Radiology, Chang Gung Medical Center at Linkou, 5 Fuhsing St. Kueisan Hsiang, Taoyuan Hsien 333, Taiwan, China
S- Editor Cheng JX L- Editor Webster JR E- Editor Zheng XM
References
- 1.Weber AL, Bui C, Kaneda T. Malignant tumors of the mandible and maxilla. Neuroimaging Clin N Am. 2003;13:509–524. doi: 10.1016/s1052-5149(03)00042-x. [DOI] [PubMed] [Google Scholar]
- 2.Theodorou DJ, Theodorou SJ, Sartoris DJ. Primary non-odontogenic tumors of the jawbones: an overview of essential radiographic findings. Clin Imaging. 2003;27:59–70. doi: 10.1016/s0899-7071(02)00518-1. [DOI] [PubMed] [Google Scholar]
- 3.Boeddinghaus R, Whyte A. Current concepts in maxillofacial imaging. Eur J Radiol. 2008;66:396–418. doi: 10.1016/j.ejrad.2007.11.019. [DOI] [PubMed] [Google Scholar]
- 4.Borges A. Skull base tumours Part II. Central skull base tumours and intrinsic tumours of the bony skull base. Eur J Radiol. 2008;66:348–362. doi: 10.1016/j.ejrad.2008.01.018. [DOI] [PubMed] [Google Scholar]
- 5.Wenig BM, Mafee MF, Ghosh L. Fibro-osseous, osseous, and cartilaginous lesions of the orbit and paraorbital region. Correlative clinicopathologic and radiographic features, including the diagnostic role of CT and MR imaging. Radiol Clin North Am. 1998;36:1241–159, xii. doi: 10.1016/s0033-8389(05)70243-8. [DOI] [PubMed] [Google Scholar]
- 6.Dorfman HD, Czerniak B, Kotz R, Vanel D, Park YK, Unni KK. WHO classification of tumours of bone: Introduction. In: Fletcher CDM, Unni KK, Mertens F, editors. World health organization classification of tumours: Pathology and genetics of tumours of soft tissue and bone. Lyon: IARC Press; 2002. pp. 227–232. [Google Scholar]
- 7.Earwaker J. Paranasal sinus osteomas: a review of 46 cases. Skeletal Radiol. 1993;22:417–423. doi: 10.1007/BF00538443. [DOI] [PubMed] [Google Scholar]
- 8.Dalambiras S, Boutsioukis C, Tilaveridis I. Peripheral osteoma of the maxilla: report of an unusual case. Oral Surg Oral Med Oral Pathol Oral Radiol Endod. 2005;100:e19–e24. doi: 10.1016/j.tripleo.2005.03.011. [DOI] [PubMed] [Google Scholar]
- 9.Lachanas VA, Koutsopoulos AV, Hajiioannou JK, Bizaki AJ, Helidonis ES, Bizakis JG. Osteoid osteoma of the ethmoid bone associated with dacryocystitis. Head Face Med. 2006;2:23. doi: 10.1186/1746-160X-2-23. [DOI] [PMC free article] [PubMed] [Google Scholar]
- 10.Lee EJ, Park CS, Song SY, Park NH, Kim MS. Osteoblastoma arising from the ethmoidal sinus. AJR Am J Roentgenol. 2004;182:1343–1344. doi: 10.2214/ajr.182.5.1821343. [DOI] [PubMed] [Google Scholar]
- 11.Park YK, Kim EJ, Kim SW. Osteoblastoma of the ethmoid sinus. Skeletal Radiol. 2007;36:463–467. doi: 10.1007/s00256-006-0269-z. [DOI] [PubMed] [Google Scholar]
- 12.Madhup R, Srivastava M, Srivastava AN, Bhatt MLB, Kirti S. Chondroblastoma of maxilla. Oral Oncol Extra. 2005;41:159–161. [Google Scholar]
- 13.Al Mestady RM, Alorainy IA, El Watidy SM, Arafah MM. Intracranial extraosseous chondroblastoma simulating meningioma. AJNR Am J Neuroradiol. 2007;28:1880–1881. doi: 10.3174/ajnr.A0729. [DOI] [PMC free article] [PubMed] [Google Scholar]
- 14.Hashimoto M, Izumi J, Sakuma I, Iwama T, Watarai J. Chondromyxoid fibroma of the ethmoid sinus. Neuroradiology. 1998;40:577–579. doi: 10.1007/s002340050647. [DOI] [PubMed] [Google Scholar]
- 15.Kadom N, Rushing EJ, Yaun A, Santi M. Chondromyxoid fibroma of the frontal bone in a teenager. Pediatr Radiol. 2009;39:53–56. doi: 10.1007/s00247-008-0999-2. [DOI] [PubMed] [Google Scholar]
- 16.Kurozumi N, Kamiishi H. Nasal chondroma: a case report. Br J Plast Surg. 1984;37:247–249. doi: 10.1016/0007-1226(84)90017-1. [DOI] [PubMed] [Google Scholar]
- 17.Wu W, Hu X, Lei D. Giant osteochondroma derived from pterygoid process of sphenoid. Int J Oral Maxillofac Surg. 2007;36:959–962. doi: 10.1016/j.ijom.2007.04.006. [DOI] [PubMed] [Google Scholar]
- 18.Celenk P, Zengin Z, Muglali M, Celenk C. Computed tomography of cranio-facial fibrous dysplasia. Eur J Radiol Extra. 2009;69:e85–e87. [Google Scholar]
- 19.Mohammadi-Araghi H, Haery C. Fibro-osseous lesions of craniofacial bones. The role of imaging. Radiol Clin North Am. 1993;31:121–134. [PubMed] [Google Scholar]
- 20.MacDonald-Jankowski DS. Fibro-osseous lesions of the face and jaws. Clin Radiol. 2004;59:11–25. doi: 10.1016/j.crad.2003.07.003. [DOI] [PubMed] [Google Scholar]
- 21.Chong VF, Khoo JB, Fan YF. Fibrous dysplasia involving the base of the skull. AJR Am J Roentgenol. 2002;178:717–720. doi: 10.2214/ajr.178.3.1780717. [DOI] [PubMed] [Google Scholar]
- 22.Beaman FD, Bancroft LW, Peterson JJ, Kransdorf MJ, Murphey MD, Menke DM. Imaging characteristics of cherubism. AJR Am J Roentgenol. 2004;182:1051–1054. doi: 10.2214/ajr.182.4.1821051. [DOI] [PubMed] [Google Scholar]
- 23.Martínez-Tello FJ, Manjón-Luengo P, Martin-Pérez M, Montes-Moreno S. Cherubism associated with neurofibromatosis type 1, and multiple osteolytic lesions of both femurs: a previously undescribed association of findings. Skeletal Radiol. 2005;34:793–798. doi: 10.1007/s00256-005-0938-3. [DOI] [PubMed] [Google Scholar]
- 24.Lee HJ, Lum C. Giant-cell tumor of the skull base. Neuroradiology. 1999;41:305–307. doi: 10.1007/s002340050753. [DOI] [PubMed] [Google Scholar]
- 25.Tang JY, Wang CK, Su YC, Yang SF, Huang MY, Huang CJ. MRI appearance of giant cell tumor of the lateral skull base: a case report. Clin Imaging. 2003;27:27. doi: 10.1016/s0899-7071(02)00520-x. [DOI] [PubMed] [Google Scholar]
- 26.Fyrmpas G, Constantinidis J, Televantou D, Konstantinidis I, Daniilidis J. Primary aneurysmal bone cyst of the maxillary sinus in a child: case report and review of the literature. Eur Arch Otorhinolaryngol. 2006;263:695–698. [Google Scholar]
- 27.Bathla G, Chowdhury V, Dixit R, Kottiyath VC, Jain R. Aneurysmal bone cyst of ethmoid sinus: Uncommon manifestation of a rare case. Eur J Radiol Extra. 2009;70:e49–e51. [Google Scholar]
- 28.Vargel I, Cil BE, Kiratli P, Akinci D, Erk Y. Hereditary intraosseous vascular malformation of the craniofacial region: imaging findings. Br J Radiol. 2004;77:197–203. doi: 10.1259/bjr/88438282. [DOI] [PubMed] [Google Scholar]
- 29.Koulouris G, Rao P. Multiple congenital cranial hemangiomas. Skeletal Radiol. 2005;34:485–489. doi: 10.1007/s00256-004-0891-6. [DOI] [PubMed] [Google Scholar]
- 30.Daffner RH, Yakulis R, Maroon JC. Intraosseous meningioma. Skeletal Radiol. 1998;27:108–111. doi: 10.1007/s002560050347. [DOI] [PubMed] [Google Scholar]
- 31.Tokgoz N, Oner YA, Kaymaz M, Ucar M, Yilmaz G, Tali TE. Primary intraosseous meningioma: CT and MRI appearance. AJNR Am J Neuroradiol. 2005;26:2053–2056. [PMC free article] [PubMed] [Google Scholar]
- 32.Lee YY, Van Tassel P, Nauert C, Raymond AK, Edeiken J. Craniofacial osteosarcomas: plain film, CT, and MR findings in 46 cases. AJR Am J Roentgenol. 1988;150:1397–1402. doi: 10.2214/ajr.150.6.1397. [DOI] [PubMed] [Google Scholar]
- 33.Park YK, Ryu KN, Park HR, Kim DW. Low-grade osteosarcoma of the maxillary sinus. Skeletal Radiol. 2003;32:161–164. doi: 10.1007/s00256-002-0577-x. [DOI] [PubMed] [Google Scholar]
- 34.Vlychou M, Ostlere SJ, Kerr R, Athanasou NA. Low-grade osteosarcoma of the ethmoid sinus. Skeletal Radiol. 2007;36:459–462. doi: 10.1007/s00256-006-0231-0. [DOI] [PubMed] [Google Scholar]
- 35.Chen CC, Hsu L, Hecht JL, Janecka I. Bimaxillary chondrosarcoma: clinical, radiologic, and histologic correlation. AJNR Am J Neuroradiol. 2002;23:667–670. [PMC free article] [PubMed] [Google Scholar]
- 36.Nemec SF, Donat MA, Hoeftberger R, Matula C, Czerny C. Chondrosarcoma of the petrous apex: A diagnostic and therapeutic challenge. Eur J Radiol Extra. 2005;54:87–91. [Google Scholar]
- 37.Dass AN, Peh WC, Shek TW, Ho WK. Case 139: nasal septum low-grade chondrosarcoma. Radiology. 2008;249:714–717. doi: 10.1148/radiol.2492040409. [DOI] [PubMed] [Google Scholar]
- 38.Worch J, Matthay KK, Neuhaus J, Goldsby R, DuBois SG. Ethnic and racial differences in patients with Ewing sarcoma. Cancer. 2010;116:983–988. doi: 10.1002/cncr.24865. [DOI] [PMC free article] [PubMed] [Google Scholar]
- 39.Özer C, Arpacı T, Yıldız A, Apaydın FD, Duce MN, Düzovalı Ö. Primary Ewing's sarcoma of the paranasal sinus with intracranial and intraorbital extension. Eur J Radiol Extra. 2005;55:47–50. [Google Scholar]
- 40.Howarth KL, Khodaei I, Karkanevatos A, Clarke RW. A sinonasal primary Ewing's sarcoma. Int J Pediatr Otorhinolaryngol. 2004;68:221–224. doi: 10.1016/j.ijporl.2003.09.011. [DOI] [PubMed] [Google Scholar]
- 41.O'Connell TE, Castillo M, Mukherji SK. Fibrosarcoma arising in the maxillary sinus: CT and MR features. J Comput Assist Tomogr. 1996;20:736–738. doi: 10.1097/00004728-199609000-00009. [DOI] [PubMed] [Google Scholar]
- 42.Rosen A, Glaser AY, Respler D. Hemangioendothelioma of the orbit in a 3-month-old infant. Inter J Pediatr Otorhinolaryngol Extra. 2006;1:188–191. [Google Scholar]
- 43.Shugar JM, Som PM, Krespi YP, Arnold LM, Som ML. Primary chordoma of the maxillary sinus. Laryngoscope. 1980;90:1825–1830. [PubMed] [Google Scholar]
- 44.Erdem E, Angtuaco EC, Van Hemert R, Park JS, Al-Mefty O. Comprehensive review of intracranial chordoma. Radiographics. 2003;23:995–1009. doi: 10.1148/rg.234025176. [DOI] [PubMed] [Google Scholar]
- 45.Weber AL, Rahemtullah A, Ferry JA. Hodgkin and non-Hodgkin lymphoma of the head and neck: clinical, pathologic, and imaging evaluation. Neuroimaging Clin N Am. 2003;13:371–392. doi: 10.1016/s1052-5149(03)00039-x. [DOI] [PubMed] [Google Scholar]
- 46.Wein RO, Popat SR, Doerr TD, Dutcher PO. Plasma cell tumors of the skull base: four case reports and literature review. Skull Base. 2002;12:77–86. doi: 10.1055/s-2002-31570-1. [DOI] [PMC free article] [PubMed] [Google Scholar]
- 47.Green S, Som PM, Lavagnini PG. Bilateral orbital metastases from prostate carcinoma: case presentation and CT findings. AJNR Am J Neuroradiol. 1995;16:417–419. [PMC free article] [PubMed] [Google Scholar]
- 48.Ogawa T, Hara K, Kawarai Y, Nishizaki K, Nomiya S, Takeda Y, Akagi H, Kariya S. A case of infantile neuroblastoma with intramucosal metastasis in a paranasal sinus. Int J Pediatr Otorhinolaryngol. 2000;55:61–64. doi: 10.1016/s0165-5876(00)00379-7. [DOI] [PubMed] [Google Scholar]


