

Abstract
p190RhoGAP (p190) is a negative regulator of RhoGTPases and a putative tumor suppressor, whose mechanism of tumor suppression is poorly defined. Ectopic expression of p190 induces various morphological phenotypes, including multinucleation, dendrite-like formation, and chromatin condensation, suggesting an involvement in apoptosis. We examined the possibility that p190 can function as a tumor suppressor by regulating induction of apoptosis. We show that the predominant phenotype of p190 overexpression in a variety of cell lines is apoptosis, which is mediated through p190’s regulation of Rho and caspases. The secondary phenotypes, multinucleation and dendrite-like formation, are determined by transformation status, not cell lineage, and appear to be intermediate phenotypes in the p190-induced apoptotic pathway. Finally, we show that p190 levels can regulate the apoptotic response of breast cancer cell lines to docetaxel through its regulation of Rho. Together, these findings suggest that one mechanism by which p190 can mediate its tumor-suppressive function is through regulation of Rho-activated cell death pathways and that this function can be exploited to optimize the action of cytoskeletal-based chemotherapeutics, such as the taxanes.
Keywords: p190RhoGAP, apoptosis, multinucleation, dendrite, docetaxel
Introduction
RhoGTPases are a distinct group of the Ras GTPase superfamily found in all eukaryotic cells. GTPases act as molecular switches, cycling between active GTP-bound and inactive GDP-bound states, which are controlled by guanine nucleotide exchange factors (GEFs), GTPase-activating proteins (GAPs), and guanine nucleotide dissociation inhibitors (GDIs). RhoGTPases directly and indirectly regulate a myriad of downstream effectors, including Rho kinase (ROCK) and mDia, which in turn regulate actomyosin and microtubule cytoskeletal dynamics.1 Numerous biological processes are modulated by Rho’s effects on cytoskeletal dynamics including proliferation, migration, differentiation, and survival.2 Of particular importance to the work described in this report are the roles that Rho plays in cytokinesis (proliferation)3 and neurite retraction/extension (differentiation).4
Due to their multiple functions in cells, aberrant expression or function of any of the RhoGTPases can result in malignant transformation. Overexpression of several members of the Rho family of GTPases, their upstream regulators, or downstream effectors has been observed in a variety of malignancies, including pancreatic, breast, brain, and prostate cancer.5 It has also been shown that Rho- and Rac1-transformed murine fibroblasts develop distant metastases in the lung, spleen, lymph nodes, and other tissues when injected into immunocompromised mice, suggesting a role for these GTPases in malignant progression.6
RhoGAPs are a large family of proteins that stimulate the intrinsic GTPase activity of the Rho proteins, leading to Rho inactivation. To date, 67 GAP domain–containing proteins have been identified,1 among which is p190RhoGAP (p190). p190 is a multidomain protein with an N-terminal GTP binding domain (GBD), a middle domain containing critical phosphorylation and protein-protein interaction motifs, and a C-terminal region that includes the GAP domain.7 Through inactivation of Rho, p190 plays a critical role in regulating actin cytoskeleton dynamics8 in response to growth factors,9 integrin engagement,10 and v-Src transformation.11 In these processes, Src phosphorylates p190 at tyrosine 1105 (Y1105) and promotes p190 binding to p120RasGAP, enhancing p190’s RhoGAP activity and Rho inactivation.12 As a result of its negative regulation of Rho, p190 has also been shown to negatively control tumor growth,13 transformation,14 metastasis, invasion,15 and angiogenesis,16 suggesting that it may function as a tumor suppressor in vivo.7
Previous studies designed to understand the role of p190 employed an overexpression approach. In epithelial cells (MDA-MB-468), overexpression of p190 resulted in multinucleation,17 suggestive of an involvement in mitosis. While in fibroblasts or neuronal cells, overexpression produced a dendritic-like phenotype,18 implicating a role in differentiation. This study demonstrates for the first time that p190 is also a regulator of apoptosis, that the multinucleation and dendritic phenotypes can be intermediates to apoptosis, and that p190 functions through Rho and its downstream effectors (including caspases) to mediate this process. Furthermore, we found that elevated levels of p190 can sensitize breast cancer cells to docetaxel-induced apoptosis, consistent with its function as a tumor suppressor.
Results
p190RhoGAP overexpression leads to apoptosis
To test for the ability of p190 to regulate apoptosis and to assess the frequency of apoptosis relative to multinucleation and dendrite-like formation, HA-tagged p190 was transiently transfected into MDA-MB-468 cells, a transformed cell of epithelial origin, and allowed to express for 24, 48, or 72 hours. Cells were then immunostained for HA to identify those overexpressing p190 and tested for apoptosis via TUNEL immunofluorescence. Concurrently, we quantitated the occurrence of the 2 other p190-reported phenotypes: multinucleation (2 or more nuclei), postulated to occur in epithelial cells, and dendrite-like formation (protrusions the length of the cell body), postulated to occur in fibroblasts. As seen in Figure 1A and Supplementary Figure S1, upon p190 overexpression in MDA-MB-468 cells, all 3 phenotypes (multinucleation, dendrite-like formation, and apoptosis) were observed. Of interest was the finding that the primary phenotype was apoptosis at all times examined, occurring in 30% of the cells that overexpressed p190 (Fig. 1B) at 72 hours post transfection, with a secondary phenotype of multinucleation (9%), and only 3% of cells displaying dendritic processes, a phenomenon that had been reported previously only in nontransformed fibroblasts or neuronal cell lines.18,19 To investigate whether p190 overexpression could invoke the same pattern of morphological changes in a nontransformed epithelial cell line, the same experiment was performed in MCF10A cells. Again, all 3 phenotypes were observed (Suppl. Fig. S2), and apoptosis was the most common phenotype at all time points, with 30% apoptosis at 72 hours post transfection. However, in contrast to the transformed epithelial cell line, p190 overexpression elicited a secondary phenotype of dendrite-like formation (8%), with only a few cells displaying multinucleation (3%) (Fig. 1C).
Figure 1.
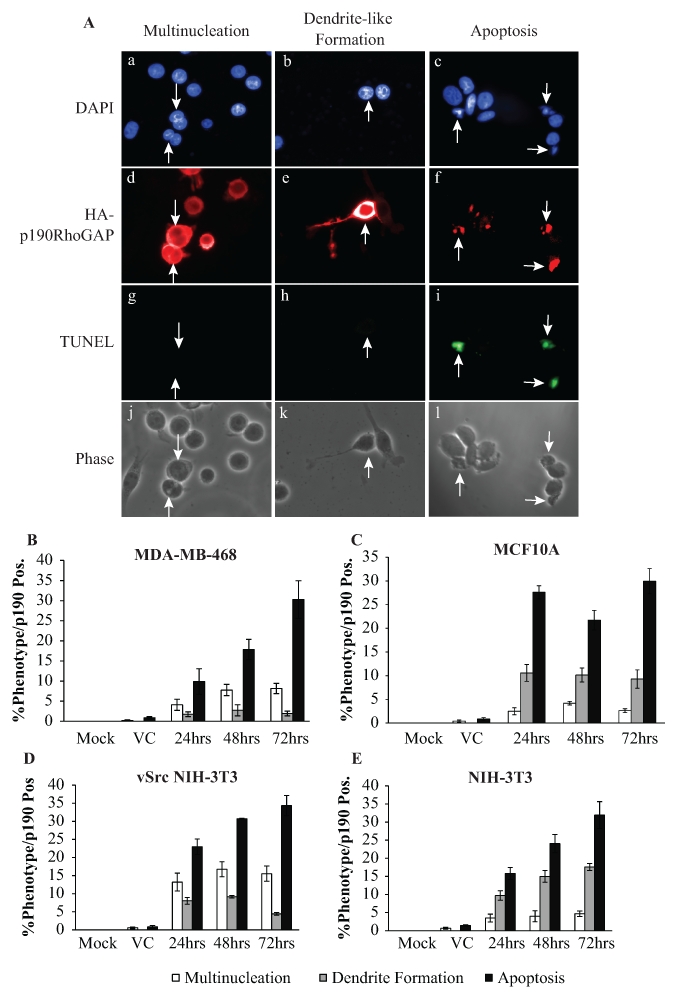
p190RhoGAP overexpression leads to apoptosis. (A) Immunofluorescent images of MDA-MB-468 cells transiently overexpressing HA-p190 represent the 3 observed phenotypes: multinucleation, dendrite-like formation, and apoptosis. Panels a-c: DAPI-stained DNA; panels d-f: triple HA-tagged p190; panels g-i: TUNEL; and panels j-l: phase. Arrows identify p190-overexpressing cells that are multinucleated (panels a, d, g, and j), dendritic-like (panels b, e, h, and k), or apoptotic (panels c, f, i, and l). (B-E) Quantitation of the respective phenotypes observed in mock-treated, vector control (VC), or p190-transfected MDA-MB-468 (B), MCF10A (C), vSrcNIH3T3 (D), and NIH3T3 (E) cells. Results are expressed as the mean percentage of total cells (mock or VC) or cells positive for HA-p190 that exhibited the observed phenotypes ± standard error of the mean (SEM) (n > 3).
To determine whether this same pattern would hold true for a pair of transformed and nontransformed fibroblasts, the preceding protocol was repeated in vSrc-transformed NIH-3T3 cells (Suppl. Fig. S3) and NIH-3T3 cells (Suppl. Fig. S4). In both cell lines, apoptosis was the most abundant phenotype at all times observed, with 34% in vSrc NIH-3T3s (Fig. 1D) and 32% in NIH-3T3 (Fig. 1E) at 72 hours post transfection. In the transformed cell line (vSrc NIH-3T3), multinucleation was the second most common phenotype (16%), with only a small percentage of cells displaying dendrite-like extensions (4%). Conversely, the nontransformed cell line (NIH-3T3) exhibited more dendrite-like protrusions (18%) than multinucleated cells (5%). Based on these results, it appeared that cell type did not determine phenotype but rather transformation status.
To further examine the relationship between the transformation status of the cell and the secondary phenotype induced by p190 overexpression, an 8–cell line survey was performed using 2 nontransformed epithelial cells (MCF10A and RWPE-1), 2 transformed epithelial cells (MDA-MB-468 and HeLa), 2 nontransformed fibroblasts (NIH-3T3 and C3H 10T1/2), and 2 transformed fibroblasts (vSrc-transformed NIH-3T3 and vSrc-transformed Rat-1). All cell lines were transiently transfected with HA-tagged p190RhoGAP for 24, 48, or 72 hours; stained for expression of HA-p190 and TUNEL; and scored for the frequency of multinucleation, dendrite-like formation, and apoptosis by immunofluorescence. As seen in Figure 2, apoptosis was the primary phenotype in all cell lines. However, the secondary phenotype was determined by transformation status, with transformed cells exhibiting a greater frequency of multinucleation than dendrite-like formation, and nontransformed cells, the reverse. These results indicated that overexpression of p190 results in apoptosis, regardless of cell type or transformation status, while the secondary phenotype (multinucleation or dendrite-like formation) depends upon the transformation status of the cell.
Figure 2.
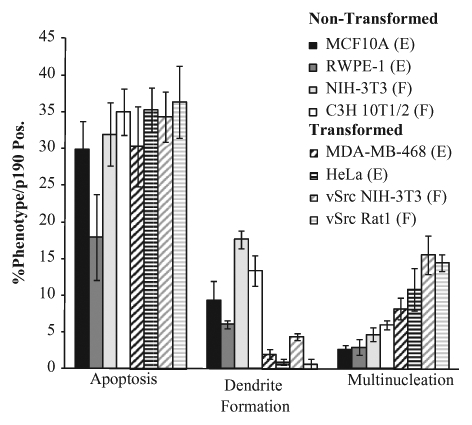
The secondary phenotype of p190 overexpression is transformation dependent, not cell type dependent. Quantitation of the respective phenotypes observed in the indicated cell lines overexpressing p190 for 72 hours. Cells were transfected and analyzed as in Figure 1. Results are expressed as the mean percentage of cells positive for HA-p190 that exhibited the observed phenotypes ± SEM (n > 3). E = epithelial cell; F = fibroblast.
p190-induced multinucleation and dendrite-like formation can result in apoptosis
These findings raised the question of whether the 2 secondary morphologies, multinucleation and dendrite-like formation, could result in apoptosis or if they represented distinct phenotypes. To address this question, we used real-time microscopy to follow p190-induced phenotypic changes over time. GFP-tagged p190 was transiently transfected into MDA-MB-468 (Fig. 3A and Suppl. Video S5) cells to assess multinucleation and into NIH-3T3 (Fig. 3B and Suppl. Video S6) and MCF10A cells to assess dendrite-like formation. Twenty-four hours post transfection, p190-positive cells were found, and DIC images were captured every 10 minutes for the next 24 hours. Apoptosis was defined as cellular condensation and membrane blebbing. Figure 3A shows p190-expressing multinucleated cells (solid arrows) underwent apoptosis within 3 hours (panels d and e), followed by the p190-positive mononucleated cells (dashed arrows) (panel f) and the non–p190-overexpressing cells, which did not undergo apoptosis until near the end of the time course. (Eventually, all cells, regardless of their p190 status, died from CO2 deprivation due to the extended time required for video microscopy.) Quantifying the time to apoptotic induction for the 3 groups of cells from multiple experiments, a significant difference in the number of minutes to apoptotic induction was observed between the various groups, with the p190-overexpressing multinucleated cells displaying the shortest time to apoptosis (Fig. 3C). Of note, our original report describing p190-induced multinucleation17 indicated a time-dependent increase in multinucleation (up to 6 days) upon p190 overexpression but did not assess apoptosis. In Supplementary Figure S7, we now show that MDA-MB-468 cells overexpressing p190 also exhibit concomitant increases in apoptosis over a 6-day culture period, consistent with the hypothesis that as cells become multinucleated as a result of p190 overexpression, increasing numbers undergo apoptosis.
Figure 3.
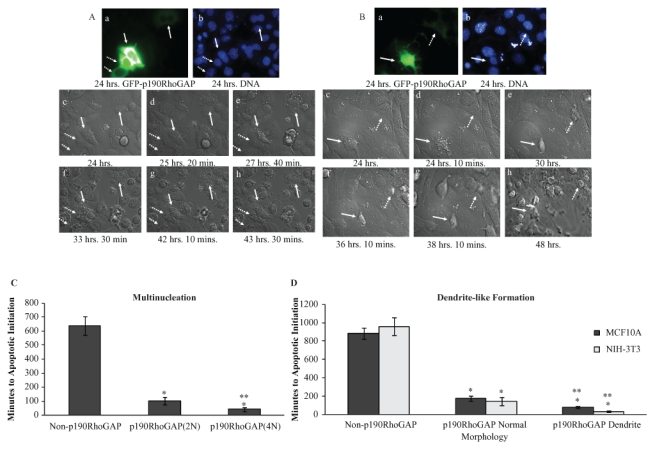
p190-induced multinucleation and dendrite-like formation can result in apoptosis. (A) Still images from real-time microscopy of MDA-MB-468 multinucleated cells undergoing apoptosis. Panel a: GFP-tagged p190 24 hours post transfection. Solid arrows indicate p190 multinucleated cells; dashed arrows indicate p190 mononucleated cells. Panel b: Hoechst 33342–stained images of DNA taken 24 hours post transfection. Panels c-h: DIC images taken at designated times. (B) Still images from real-time microscopy of a NIH-3T3 dendritic cell undergoing apoptosis. Panel a: GFP-tagged p190 24 hours post transfection. The solid arrow indicates a p190 dendritic cell, and the dashed arrow indicates a p190 cell with normal morphology. Panel b: Hoechst 33342–stained images of DNA taken 24 hours post transfection. Panels c-h: DIC images taken at designated times. (C) Multinucleated, p190-overexpressing MDA-MB-468 cells initiate apoptosis more rapidly than p190 mononucleated cells or nonoverexpressors. The first image, 24 hours post transfection, was defined as time zero, and a cell was measured as positive for apoptotic initiation at the first sign of cellular condensation. Cells were grouped as non–p190-overexpressing (normal, n = 25), p190-overexpressing mononucleated (2N, n = 14), or p190-overexpressing multinucleated (4N or greater, n = 7), and results are expressed as the mean time in minutes ± SEM. *P < 0.005 as compared to non–p190 overexpressing. **P < 0.05 as compared to p190-overexpressing mononucleated (2N). (D) Dendritic, p190-overexpressing NIH-3T3 or MCF10A cells initiate apoptosis more rapidly than p190 normal morphology or non–p190-overexpressing cells. Cells (NIH-3T3, MCF10A) were grouped as non–p190-overexpressing (normal, n = 23, 28), p190-overexpressing mononucleated normal morphology (n = 12, 7), or p190-overexpressing dendritic (n = 8, 4), and results are expressed as the mean time in minutes ± SEM. Statistical significance was determined within individual cell lines. *P < 0.005 as compared to non–p190 overexpressing. **P < 0.05 as compared to p190-overexpressing normal morphology. Images17 were also taken of vSrc NIH-3T3 and vSrc Rat1 cells; however, all cells began apoptosis within 2 hours of the time course, whether or not they had been transfected with p190RhoGAP, most likely due to the proapoptotic nature of vSrc.53
Similar results were seen with the dendritic-like phenotype in NIH-3T3 and MCF10A cells (Fig. 3B and 3D). The dendritic NIH-3T3 cell seen in Figure 3B (solid arrow) began the apoptotic process within 10 minutes of the experiment (panel d), while the p190-overexpressing “normal” morphology cell (arrowhead) began apoptosis after 6 hours. Non–p190-overexpressing cells did not initiate apoptosis until 14 hours. Quantification revealed (Fig. 3D) a similar pattern as that seen for multinucleation (Fig. 3D). Together, these data indicate that multinucleation and dendrite-like formation can result in apoptosis and suggest that they may be priming or sensitizing phenotypes in the p190-induced apoptotic pathway. However, these findings do not preclude the possibility that p190 may induce apoptosis independently of multinucleation or dendrite-like formation.
p190-induced apoptosis is caspase dependent
To determine whether p190-induced death was mediated by caspases, 4 cell lines (MDA-MB-468, MCF10A, vSrc NIH-3T3, and NIH-3T3) were transiently transfected with HA-p190 and examined at 24, 48, and 72 hours for caspase-3 cleavage by Western blot analysis. As seen in Figure 4A to 4D, caspase-3 cleavage was detected at all time points following p190 overexpression, indicating apoptosis. To determine whether caspase cleavage was required for apoptosis, cells were treated with the pan caspase inhibitor, Z-VAD, 1 hour post transfection. Forty-seven hours later, cells were immunostained for HA to identify those overexpressing p190 and tested for apoptosis via TUNEL immunofluorescence. Figure 4E shows that apoptosis was significantly inhibited, as determined by TUNEL, in all cell lines treated with Z-VAD (Fig. 4E), indicating that p190-induced apoptosis is caspase dependent.
Figure 4.
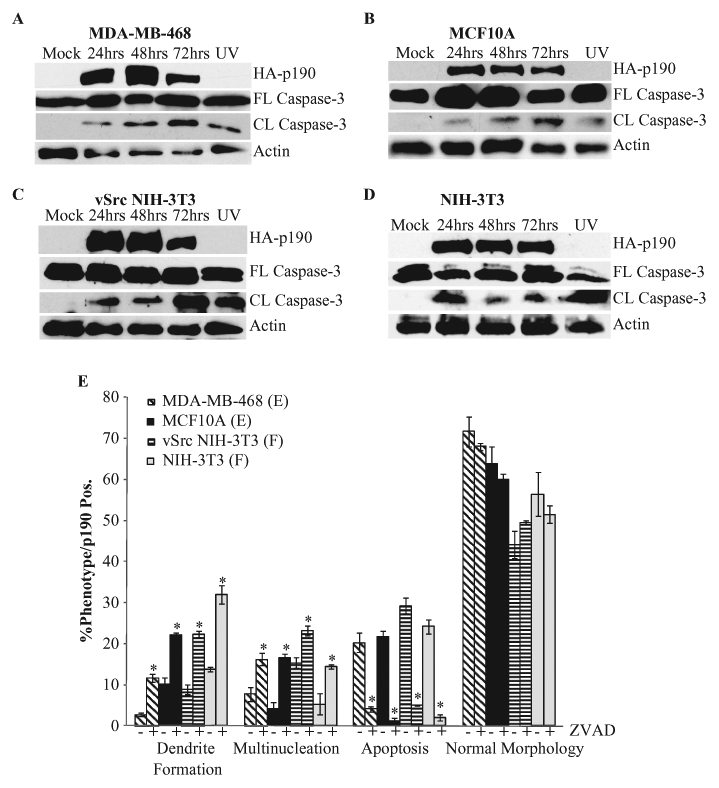
p190-induced apoptosis is caspase dependent. (A) MDA-MB-468 cells were transfected with HA-p190 or mock treated, and extracts were subjected to Western blotting as described in Materials and Methods. UV-treated cells were used as a positive control for caspase cleavage. Mock and UV-treated cells were collected at the 48-hour time point. (B-D) MCF10A (B), vSrc NIH-3T3 (C), and NIH-3T3 (D) cells were treated as in A. (E) Cells were transiently transfected with HA-tagged p190. One hour post transfection, cells were treated with 50 µM Z-VAD-FMK (BD Pharmingen) and scored for the respective phenotype 47 hours later. Results are expressed as mean percentage of p190-overexpressing cells that exhibited the indicated phenotype ± SEM (n > 3). Statistical significance was determined within individual cell lines. *P < 0.005 comparing Z-VAD treated to Z-VAD nontreated partner.
Based upon real-time images (Fig. 3), we speculated that multinucleation and dendrite-like formation may be priming intermediate phenotypes, leading to p190-induced apoptosis. If that were the case, then inhibiting apoptosis would result in an accumulation of the intermediate phenotypes, without a significant change in the percentage of p190-overexpressing cells exhibiting normal morphology. When all cell lines were transiently transfected with p190, and treated with Z-VAD, a decrease in apoptosis was seen, along with an increase in multinucleation and dendrite-like formation; however, no change in p190-positive normal morphology cells was seen. Together, these results further support the conclusion that multinucleation and dendrite-like formation may be intermediate phenotypes to p190-induced apoptosis.
p190-induced phenotypes are Rho dependent
Because p190 is a negative regulator of Rho, we hypothesized that the 3 phenotypes were Rho dependent. To examine this, 2 approaches were taken. First, deletion and point mutants of p190 were generated (Fig. 5A), and each mutant’s ability to induce multinucleation, dendrite-like formation, or apoptosis was determined by immunofluorescence. Prior to this analysis, mutants were shown to be expressed at nearly equivalent levels (Fig. 5B) and to exhibit appropriate GTPase activities.12,20,21 Figure 5C shows that transient transfection of these mutants into the 4 indicated cell lines resulted in a significant decrease in the amount of apoptosis seen with those mutants that were unable to downregulate Rho (ΔGAP, Middle Domain, and R1283A–GAP inactive) as compared to the full-length (FL) and ΔGBD protein. In contrast, the isolated GAP domain showed a significant increase in the amount of apoptosis in all cell types, suggesting that p190-induced apoptosis is elicited through p190’s regulation of Rho. Similar patterns were seen with both multinucleation and dendrite-like formation (Suppl. Figs. S8 and S9), indicating that these phenotypes also required the RhoGAP domain of p190.
Figure 5.
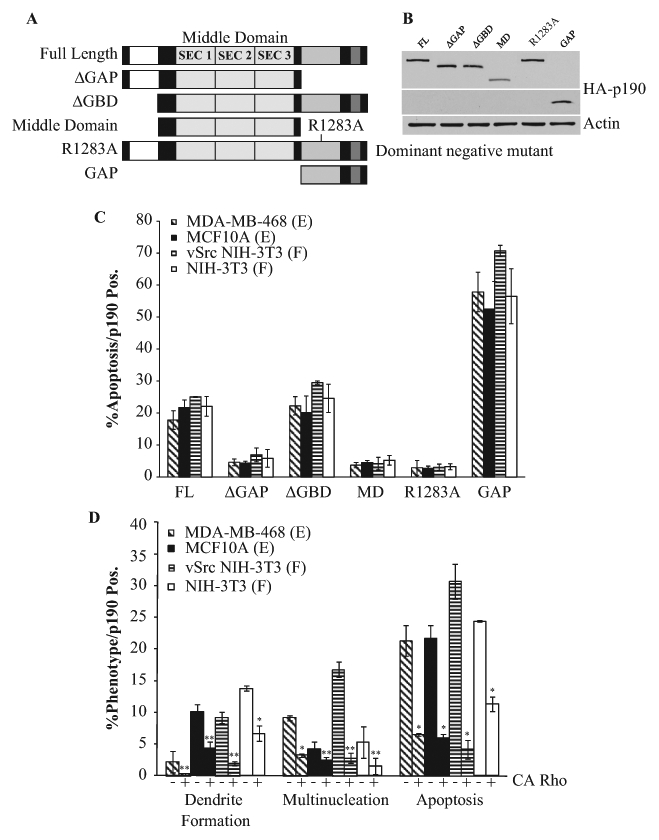
p190-induced phenotypes are Rho dependent. (A) Diagram of the p190RhoGAP mutants: Full-length (FL), ΔGAP, ΔGBD, Middle Domain (MD), dominant negative GAP inactive R1283A, and GAP-only domain (GAP). (B) Western blot analysis of HA-p190RhoGAP mutants: MDA-MB-468 cells were transfected with plasmids encoding the indicated mutants of p190, and 48 hours later, cell lysates were immunoblotted with anti-HA antibody. (C) Effect of p190 mutations on induction of apoptosis. Indicated cells were transfected and analyzed 48 hours later as in Figure 1. Results are expressed as the mean percentage of p190-overexpressing cells that were TUNEL positive ± SEM (n > 3). (D) Rescue of p190-induced phenotypes by CARho. Indicated cells were cotransfected with equivalent molar amounts of p190 and CARho (Q63L) or with p190RhoGAP alone and cultured for 48 hours. Where indicated, only cells expressing FLp190 alone or both FLp190 and CARho were assessed for apoptosis, multinucleation, or dendrite-like formation. Results are expressed as the mean percentage of HA-p190– or HA-p190/CARho–expressing cells that exhibited the indicated phenotype ± SEM (n > 3). Statistical significance is determined within individual cell lines. *P < 0.005 or **P < 0.05, comparing presence of CARho to its absence in p190-overexpressing cells.
The second approach to test the Rho dependency of the p190-induced phenotypes was to determine the ability of CARho to rescue the effects of p190 overexpression. Figure 5D shows that when equivalent molar amounts of CARho (Q63L) were cotransiently transfected with p190 into the 4 cell lines, a rescue of all 3 phenotypes was seen.
p190 confers docetaxel sensitivity through Rho
Rho activity can be modulated by drugs that regulate both microtubule (MT) polymerization and depolymerization.22 Docetaxel, an agent that inhibits depolymerization of MT, is frequently employed therapeutically for a variety of cancers,23 suggesting that both Rho and p190 might play a role in docetaxel-mediated apoptosis.
To address this question, a panel of breast cancer cell lines was examined to determine the relative levels of endogenous p190 in each, as compared to the nontransformed MCF10A cell line (Fig. 6A). Figure 6B shows that when these cell lines were treated with increasing doses of docetaxel for 24 hours and tested for apoptosis by TUNEL immunofluorescence, a direct relationship was seen between the level of endogenous p190 and sensitivity of the cell line to docetaxel-induced apoptosis. (A p190 dose dependency of apoptosis induction and caspase-3 cleavage was also found in tet-on-p190–expressing MDA-MB-468 cells independent of docetaxel [Suppl. Figs. S10 and S11], and silencing of p190 was shown to reduce docetaxel-induced caspase-3 cleavage [Suppl. Fig. S12], suggesting that p190 plays an integral role in docetaxel-induced apoptosis.) To further investigate whether p190 and Rho levels or activities altered sensitivity to docetaxel-induced apoptosis, MDA-MB-468 cells were transiently transfected with CARho (Q63L), DNRho (T19N), FLp190, or DNp190 (R1283A) for 24 hours. Cells were then treated with either 10 nM or 100 nM of docetaxel for an additional 24 hours, and apoptosis was determined by TUNEL immunofluorescence. Figure 6C shows that CARho and DNp190, which increase the activation status of Rho, decreased docetaxel-induced apoptosis, while DNRho and FLp190, which decrease Rho activity, increased docetaxel-induced apoptosis. Interestingly, in MDA-MB-231 cells, a breast cancer cell line with low levels of endogenous p190, and a relatively moderate apoptotic response to docetaxel, the overexpression of p190 resulted in a significantly more profound effect at both dosages (Fig. 6D). p190 overexpression resulted in an almost 3-fold docetaxel-induced apoptotic increase at both the 10 nM and 100 nM dose. Taken together, these results indicate that p190 confers enhanced sensitivity to docetaxel through its ability to downregulate Rho.
Figure 6.
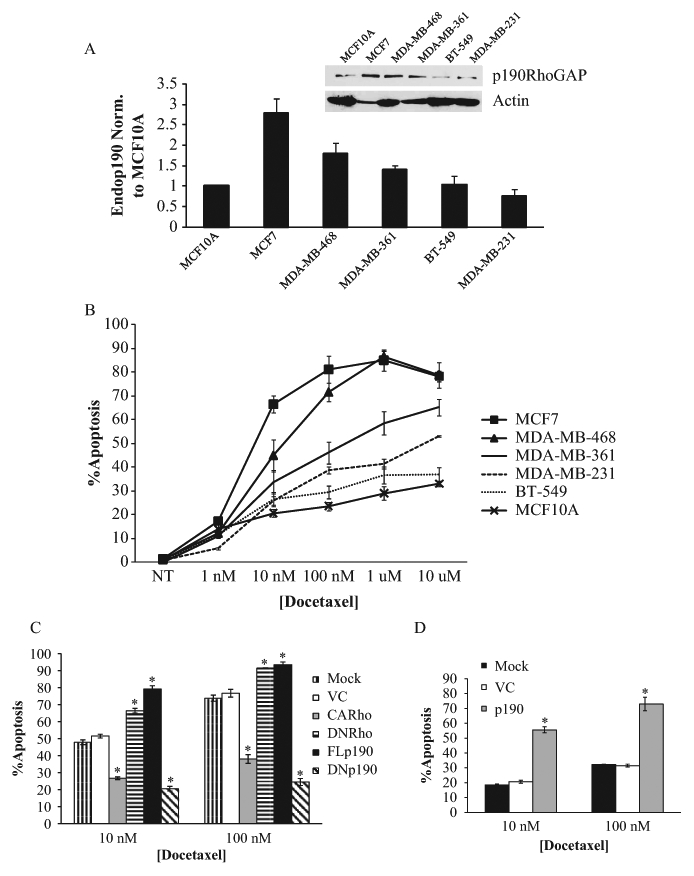
p190 confers docetaxel sensitivity through Rho in breast cancer cell lines. (A) Quantitation of levels of endogenous p190 in the indicated cell lines. p190 levels were quantified as described in Materials and Methods. Values were related to Actin and then normalized to p190 levels in MCF10A cells, which were set to 1. Results are expressed as the mean fold over MCF10A levels ± SEM (n > 3). Inset: Representative immunoblot of endogenous p190 in the indicated breast cancer cell lines. (B) Quantitation of docetaxel-induced apoptosis in breast cancer cells. Indicated cells were treated with increasing amounts of docetaxel for 24 hours, and apoptosis was determined by TUNEL immunofluorescence. Results are expressed as the mean percentage of apoptotic cells ± SEM (n > 3). (C) Quantitation of apoptotic MDA-MB-468 cells transiently overexpressing mutants of Rho or p190 and treated with docetaxel. MDA-MB-468 cells were mock treated or transfected with VC-, CARho-, DNRho-, FLp190-, or DNp190-encoding plasmids. Twenty-four hours later, cells were treated with 10 nM or 100 nM docetaxel for another 24 hours. Apoptosis was determined by TUNEL immunofluorescence. Results are expressed as the mean percentage of total cells (VC) or cells overexpressing p190 or Rho that were apoptotic ± SEM (n > 3). *P < 0.005 as compared to VC. (D) Quantitation of apoptosis in MDA-MB-231 cells transiently overexpressing p190RhoGAP and treated with docetaxel. MDA-MB-231 cells were mock treated or transfected with VC or p190 plasmids. Twenty-four hours later, cells were treated with 10 nM or 100 nM docetaxel for another 24 hours. Apoptosis was determined by TUNEL immunofluorescence. Results are expressed as the mean percentage of total cells (mock or VC) or cells positive for HA-p190 that were apoptotic ± SEM (n > 3). *P < 0.005 as compared to mock treated.
Discussion
Multiple lines of evidence indicate p190RhoGAP can function as a tumor suppressor. It has been mapped to chromosome 19q13.3, a region deleted or rearranged in pancreatic, glioma, ovarian, and thyroid tumors.24 p190 suppresses Ras-induced transformation in NIH-3T3 cells,14 and overexpression inhibits PDGF-induced gliomas in a mouse model.13 A Rho/p190 chimera reduces human pancreatic cancer invasion and metastasis in mice,15 while p190 negatively regulates angiogenesis.16 Like other tumor suppressor proteins, p190 has been implicated in apoptotic initiation. Epithelial prostate cells of mice undergo programmed cell death following castration. This correlates with an increase in p190 mRNA and protein levels upon apoptotic initiation.25 While these studies are supportive of the tumor-suppressive activity of p190, the mechanism(s) by which it carries out this function is poorly understood.
The current study was conducted to determine whether p190 functions as a tumor suppressor by inducing apoptosis and to elucidate the relationship between apoptosis and the secondary p190-induced phenotypes, multinucleation and dendrite-like formation. We monstrated that p190 induces apoptosis and further showed that overexpression most frequently results in apoptosis regardless of cell lineage or transformation status. Surprisingly, the secondary phenotype was found to be dependent upon transformation status rather than cell type. Specifically, the secondary phenotype of p190 overexpression in transformed cells was multinucleation, an outcome that suggests a defect in mitosis or cytokinesis, as previously shown by our laboratory.17 Transformed cells are known to harbor flaws in cell cycle checkpoints, allowing transit through cell cycle in the presence of strong arrest signals (such as aberrant RhoGTP levels due to p190 overexpression). We postulate that transformed cells overexpressing p190 are able to bypass one or more checkpoints before undergoing apoptosis or failing to complete cytokinesis. In support of this hypothesis are the findings that multiple cell cycle checkpoint proteins have proapoptotic function, many of which have been implicated in Rho-induced apoptosis, including p53,26 CDK1,27 and the cyclins D,28 B,29 and E.30 Thus, fidelity of cell cycle checkpoints may be one factor that determines the route to apoptosis in cells of different malignant status that harbor dysregulated Rho signaling.
The secondary phenotype prevalent in nontransformed cells was dendrite-like formation. Studies in neuronal cells expressing CARho revealed that Rho induces neurite retraction through ROCK activation. Conversely, Rho inactivation results in neurite outgrowth.31 The effect of Rho’s activation status on neurite outgrowth supports observations reported here regarding p190-induced dendrite-like formation in nontransformed cells. While we do not have a complete understanding of the mechanism of p190-induced dendrite (neurite) formation, quantitation of overexpressed p190 suggests that cells with a dendritic phenotype have 4 times more p190 than p190-overexpressing cells with a normal phenotype (data not shown). Nontransformed cells are assumed to have intact cell cycle checkpoints; accordingly, perturbations within the cell are sensed, and cell cycle progression is arrested. While arrested, p190 could still be transcribed and translated, leading to an accumulation of the protein. The p190 dendritic cells are often mononucleated with normal-sized nuclei, suggesting they have not entered the S phase of the cell cycle. This finding is consistent with a G1/S block and activation of the p53/p21 cell cycle checkpoint.32 Several reports have implicated p53 in Rho inactivation–induced apoptosis,33 suggesting that p190-induced apoptosis in nontransformed cells may be elicited through the p53 pathway.
Real-time microscopy revealed that both secondary phenotypes result in apoptosis and do so more readily than p190-overexpressing cells with a normal morphology. Inhibition of apoptosis by the pan caspase inhibitor, ZVAD, increased both multinucleated and dendritic-like cells, consistent with the hypothesis that the 2 secondary phenotypes may be priming intermediates that lead to apoptosis. CARho rescued p190-induced apoptosis, along with multinucleation and dendrite-like formation, suggesting that all 3 phenotypes are Rho dependent, a conclusion supported by a structure/function analysis with mutants of p190. The Rho dependency of all 3 p190-induced phenotypes raises the question of whether the same signaling pathways downstream of Rho can generate the different phenotypes. We would posit that the pathways utilized by transformed versus nontransformed cells are distinct due to the fact that different secondary phenotypes are preferentially evoked. Prolonged inactivation of Rho can result in apoptosis34; however, reports are conflicting regarding which apoptotic signaling pathways are activated. For example, Akt has been implicated35 along with the NK-κB,36 JNK,37 p38,38 ERK,35 and p53 pathways.33 However, it is not clear whether these pathways are specific to transformed or nontransformed cells. Further work is needed to clarify the mechanisms of Rho-induced apoptosis in cells with different transformation status with the goal of minimizing bystander effects of potential p190/Rho-based therapeutics.
Finally, we showed that p190 sensitized cells to docetaxel-induced apoptosis in a Rho-dependent manner. Rho is a master regulator of both actomyosin and microtubule dynamics.1 Dysregulation of these cytoskeletal elements can give rise to the phenotypes described in this report. Two main effector proteins mediate Rho’s modulation of cytoskeletal processes: mDia and ROCK.39 Rho activates mDia to facilitate actin nucleation and polymerization in addition to microtubule alignment and stabilization.40 Rho’s activation of ROCK results in actin filament41 and microtubule stability42 through its regulation of myosin II.43 The activation of both mDia and ROCK is required for actin stress fiber formation, a phenotypic characteristic of Rho activation,44 which is abolished with the overexpression of p190.9,45 The fact that Rho is an important cytoskeletal regulator prompted us to test whether p190 affected the efficacy of docetaxel, a chemotherapeutic agent used to treat breast, lung, prostate, gastric, and head and neck cancers.23 Taxanes bind along the entire length of microtubules and prevent their depolymerization. This action results in failure of the mitotic spindle to effect chromosomal segregation, leading to mitotic catastrophe and ultimately cell death.46
The literature suggests a close link between Rho, ROCK, and microtubule disrupting agents. In cells treated with MT depolymerizing agents, Rho and ROCK activity increased,22 whereas a MT stabilizer decreased Rho and ROCK activity.47 Conversely, CARho and ROCK induced MT depolymerization,47 while the ROCK inhibitor Y-27632 resulted in MT stability.42 Additionally, a myosin II inhibitor stabilized microtubules,42 prompting investigators to look at the role of myosin II in MT regulation. They found that cells treated with MT destabilizing drugs exhibited an increase in rMLC phosphorylation,43 while Taxol treatment abolished rMLC phosphorylation,48 suggesting that MT organization is regulated through a Rho/ROCK/myosin II pathway. Our work shows that the sensitivity of MDA-MB-468 and MDA-MB-231 breast cancer cells to docetaxel-induced apoptosis is modulated through Rho and p190, possibly through the ROCK and rMLC pathway.
For over 30 years, the cancer biology field has focused on kinases as therapeutic targets, while transcription factors, G protein–coupled receptors, and small G proteins have received considerably less attention, despite the fact that they play important roles in the genesis and progression of tumors. Rho, for example, is upregulated at the RNA or protein level in many solid tumors6; yet, only one clinically available drug is targeted to the pathway at this time. The drug Fasudil,49 a ROCK inhibitor, is currently used in the treatment of cardiovascular diseases. Recently, however, several groups have shown that fasudil may have a promising future as a cancer therapeutic. Fasudil treatment can inhibit liver, lung, and breast tumor progression50; reduce glioma invasion and growth51; and decrease ovarian tumor burden in mice,52 all of which support the concept of targeting Rho and its regulators as cancer therapeutics. We have shown that both p190 and Rho are important modulators of at least one chemotherapeutic agent, docetaxel. Cells with elevated levels of p190 were more sensitive to docetaxel, suggesting that analysis of p190 levels may predict response rates and decrease off-target effects of drugs that target Rho and the Rho pathways that regulate microtubule and actin dynamics.
Materials and Methods
Cell lines
MDA-MB-231, MDA-MB-468, BT-549, MCF7, HeLa, C3H10T1/2, NIH-3T3, vSrc NIH-3T3, and vSrc Rat1 cells were maintained in Dulbecco’s Modified Eagle Medium (DMEM) (Gibco, Carlsbad, CA) containing 10% fetal calf serum (FBS) (Gibco) and 1% penicillin/streptomycin (Gibco). MDA-MB-361 cells were maintained in Leibovitz’s L-15 Medium (Gibco) containing 20% FBS (Gibco) and 1% penicillin/streptomycin (Gibco). MCF10A cells were maintained in DMEM/F12 (Gibco) with 5% horse serum (Gibco) and 1% penicillin/streptomycin (Gibco), supplemented with 100 µg/mL EGF (Sigma-Aldrich, St. Louis, MO), 1 mg/mL hydrocortisone (Sigma-Aldrich), 1 mg/mL cholera toxin (Calbiochem, Gibbstown, NJ), and 10 mg/mL insulin (Sigma-Aldrich). RWPE-1 cells were maintained in Keratinocyte Serum Free Medium (Gibco), with 0.2 ng/mL EGF and 25 µg/mL bovine pituitary extract (Gibco). Cell lines were obtained from American Tissue Culture Collection (Manassas, VA) except for v-Src NIH3T3 and v-Src Rat-1 cells, a gift from Dr. J.T. Parsons.
Transient transfection
MDA-MB-468, HeLa, NIH-3T3, vSrc NIH-3T3, and vSrc Rat1 cells were transfected with a pKH3 plasmid–encoding vector control, full-length HA-tagged wild-type, mutant p190, and/or a pTriEX plasmid–encoding CARho (Q63L) or DNRho (T19N) using Polyfect Transfection Reagent (Qiagen Inc., Valencia, CA), while C3H10T1/2 cells were transfected with Superfect Transfection Reagent (Qiagen Inc.), MCF10A and MCF7 with Fugene Transfection Reagent (Roche, Indianapolis, IN), and RWPE-1 and MDA-MB-231 with Lipofectamine Plus Transfection Reagent (Invitrogen, Eugene, OR). Mock-transfected cells were treated with transfection reagents alone.
Immunofluorescence
For phenotype studies, cells were seeded on coverslips (Fisher, Pittsburgh, PA) and transfected as described above on the following day. Slides were prepared for immunofluorescence as described in Su et al.,17 blocked with goat serum, and incubated with αHA.11 monoclonal antibody (mAb) (Covance, Berkeley, CA) and Alexafluor 594–conjugated goat anti-mouse IgG (Molecular Probes, Eugene, OR). To test for apoptosis, cells were subjected to TUNEL, in situ Cell Death Kit, Fluorescein (Roche) analysis. All cells were stained for DNA with DAPI (Sigma-Aldrich) and visualized on a Leica-Leitz DM RBE microscope (Wetzlar, Germany).
Western blotting
Cells were transfected as described above with HA-p190RhoGAP plasmid, and 50 µg of protein per treatment group was separated on an SDS-PAGE gel as described in Chang et al.9 Proteins were then transferred to a Nitrocellulose membrane (Whatman, Dassel, Germany) and blotted with the respective primary antibodies: α-p190 (8C10) mAb (derived and characterized in our laboratory9), αHA-p190 (αHA.11 [18B12]) mAb (Covance), α-caspase-3 (8G10) mAb (Cell Signaling Technology, Boston, MA), and α-β-actin mAb (Sigma-Aldrich). Blots were then incubated with HRP-conjugated anti-mouse or anti-rabbit secondary antibody (Amersham Biosciences, Piscataway, NJ). Antigen-antibody complexes were visualized by ECL (Amersham Biosciences), radiographed, and quantified by densitometric analysis using AlphaEase FC (Alpha Innotech, San Leandro, CA).
Time-lapse microscopy
MDA-MB-468, MCF10A, NIH-3T3, vSrc NIH-3T3, or vSrc Rat1 cells were plated and transfected in 0.17-mm Delta T dishes (Fisher) and 24 hours later incubated with Hoechst 33342 (Molecular Probes) to visualize the DNA. Cells were maintained for the next 24 hours in Leibovitz’s L-15 medium (Gibco). DIC images were captured every 10 minutes with a Nikon Eclipse TE200 microscope (Tokyo, Japan) equipped with a heated stage and a Hamamatsu CCD camera (Hamamatsu, Japan) controlled by Improvision’s Openlab software (Coventry, England).
Supplementary Material
Acknowledgments
The authors thank the SJP laboratory for the p190RhoGAP deletion and mutant constructs. They are grateful to J. DaSilva, J. Pritchard, and S. Sanchez for critical reading of the article and to the SJP laboratory and Women’s Oncology Group for helpful discussions.
Footnotes
Supplementary material for this article is available on the Genes & Cancer website at http://ganc.sagepub.com/supplemental.
The author(s) declared no potential conflicts of interest with respect to the authorship and/or publication of this article.
This work was supported by the National Cancer Institute [grant numbers CA39438, CA009109].
References
- 1. Hall A. The cytoskeleton and cancer. Cancer Metastasis Rev. 2009;28(1-2):5-14 [DOI] [PubMed] [Google Scholar]
- 2. Heasman SJ, Ridley AJ. Mammalian Rho GTPases: new insights into their functions from in vivo studies. Nat Rev Mol Cell Biol. 2008;9(9):690-701 [DOI] [PubMed] [Google Scholar]
- 3. Kishi K, Sasaki T, Kuroda S, Itoh T, Takai Y. Regulation of cytoplasmic division of Xenopus embryo by rho p21 and its inhibitory GDP/GTP exchange protein (rho GDI). J Cell Biol. 1993;120(5):1187-95 [DOI] [PMC free article] [PubMed] [Google Scholar]
- 4. Jalink K, van Corven EJ, Hengeveld T, Morii N, Narumiya S, Moolenaar WH. Inhibition of lysophosphatidate- and thrombin-induced neurite retraction and neuronal cell rounding by ADP ribosylation of the small GTP-binding protein Rho. J Cell Biol. 1994;126(3):801-10 [DOI] [PMC free article] [PubMed] [Google Scholar]
- 5. Aznar S, Fernandez-Valeron P, Espina C, Lacal JC. Rho GTPases: potential candidates for anticancer therapy. Cancer Lett. 2004;206(2):181-91 [DOI] [PubMed] [Google Scholar]
- 6. Gomez del Pulgar T, Benitah SA, Valeron PF, Espina C, Lacal JC. Rho GTPase expression in tumourigenesis: evidence for a significant link. Bioessays. 2005;27(6):602-13 [DOI] [PubMed] [Google Scholar]
- 7. Ludwig K, Sanchez Manchinelly SA, Su L, Mikawa M, Parsons SJ. p190RhoGAP-A. UCSD-Nature Molecule Pages. Epub 2009 Dec 8 [Google Scholar]
- 8. Ridley AJ, Self AJ, Kasmi F, et al. rho family GTPase activating proteins p190, bcr and rhoGAP show distinct specificities in vitro and in vivo. EMBO J. 1993;12(13):5151-60 [DOI] [PMC free article] [PubMed] [Google Scholar]
- 9. Chang JH, Gill S, Settleman J, Parsons SJ. c-Src regulates the simultaneous rearrangement of actin cytoskeleton, p190RhoGAP, and p120RasGAP following epidermal growth factor stimulation. J Cell Biol. 1995;130(2):355-68 [DOI] [PMC free article] [PubMed] [Google Scholar]
- 10. Arthur WT, Burridge K. RhoA inactivation by p190RhoGAP regulates cell spreading and migration by promoting membrane protrusion and polarity. Mol Biol Cell. 2001;12(9):2711-20 [DOI] [PMC free article] [PubMed] [Google Scholar]
- 11. Fincham VJ, Chudleigh A, Frame MC. Regulation of p190 Rho-GAP by v-Src is linked to cytoskeletal disruption during transformation. J Cell Sci. 1999;112(Pt 6):947-56 [DOI] [PubMed] [Google Scholar]
- 12. Haskell MD, Nickles AL, Agati JM, Su L, Dukes BD, Parsons SJ. Phosphorylation of p190 on Tyr1105 by c-Src is necessary but not sufficient for EGF-induced actin disassembly in C3H10T1/2 fibroblasts. J Cell Sci. 2001;114(Pt 9):1699-708 [DOI] [PubMed] [Google Scholar]
- 13. Wolf RM, Draghi N, Liang X, et al. p190RhoGAP can act to inhibit PDGF-induced gliomas in mice: a putative tumor suppressor encoded on human chromosome 19q13.3. Genes Dev. 2003;17(4):476-87 [DOI] [PMC free article] [PubMed] [Google Scholar]
- 14. Wang DZ, Nur EKMS, Tikoo A, Montague W, Maruta H. The GTPase and Rho GAP domains of p190, a tumor suppressor protein that binds the M(r) 120,000 Ras GAP, independently function as anti-Ras tumor suppressors. Cancer Res. 1997;57(12):2478-84 [PubMed] [Google Scholar]
- 15. Kusama T, Mukai M, Endo H, et al. Inactivation of Rho GTPases by p190 RhoGAP reduces human pancreatic cancer cell invasion and metastasis. Cancer Sci. 2006;97(9):848-53 [DOI] [PMC free article] [PubMed] [Google Scholar]
- 16. Mammoto A, Connor KM, Mammoto T, et al. A mechanosensitive transcriptional mechanism that controls angiogenesis. Nature. 2009;457(7233):1103-8 [DOI] [PMC free article] [PubMed] [Google Scholar]
- 17. Su L, Agati JM, Parsons SJ. p190RhoGAP is cell cycle regulated and affects cytokinesis. J Cell Biol. 2003;163(3):571-82 [DOI] [PMC free article] [PubMed] [Google Scholar]
- 18. Tatsis N, Lannigan DA, Macara IG. The function of the p190 Rho GTPase-activating protein is controlled by its N-terminal GTP binding domain. J Biol Chem. 1998;273(51):34631-8 [DOI] [PubMed] [Google Scholar]
- 19. Troller U, Raghunath A, Larsson C. A possible role for p190RhoGAP in PKCepsilon-induced morphological effects. Cell Signal. 2004;16(2):245-52 [DOI] [PubMed] [Google Scholar]
- 20. Mikawa M, Su L, Parsons SJ. Opposing roles of p190RhoGAP and Ect2 RhoGEF in regulating cytokinesis. Cell Cycle. 2008;7(13):2003-12 [DOI] [PMC free article] [PubMed] [Google Scholar]
- 21. Su L, Pertz O, Mikawa M, Hahn K, Parsons SJ. p190RhoGAP negatively regulates Rho activity at the cleavage furrow of mitotic cells. Exp Cell Res. 2009;315(8):1347-59 [DOI] [PMC free article] [PubMed] [Google Scholar]
- 22. Niggli V. Microtubule-disruption-induced and chemotactic-peptide-induced migration of human neutrophils: implications for differential sets of signalling pathways. J Cell Sci. 2003;116(Pt 5):813-22 [DOI] [PubMed] [Google Scholar]
- 23. Baker J, Ajani J, Scotte F, et al. Docetaxel-related side effects and their management. Eur J Oncol Nurs. 2009;13(1):49-59 [DOI] [PubMed] [Google Scholar]
- 24. Tikoo A, Czekay S, Viars C, et al. p190-A, a human tumor suppressor gene, maps to the chromosomal region 19q13.3 that is reportedly deleted in some gliomas. Gene. 2000;257(1):23-31 [DOI] [PubMed] [Google Scholar]
- 25. Morrissey C, Bennett S, Nitsche E, Guenette RS, Wong P, Tenniswood M. Expression of p190A during apoptosis in the regressing rat ventral prostate. Endocrinology. 1999;140(7):3328-33 [DOI] [PubMed] [Google Scholar]
- 26. Muller M, Schleithoff ES, Stremmel W, Melino G, Krammer PH, Schilling T. One, two, three: p53, p63, p73 and chemosensitivity. Drug Resist Updat. 2006;9(6):288-306 [DOI] [PubMed] [Google Scholar]
- 27. Maddika S, Ande SR, Panigrahi S, et al. Cell survival, cell death and cell cycle pathways are interconnected: implications for cancer therapy. Drug Resist Updat. 2007;10(1-2):13-29 [DOI] [PubMed] [Google Scholar]
- 28. Sofer-Levi Y, Resnitzky D. Apoptosis induced by ectopic expression of cyclin D1 but not cyclin E. Oncogene. 1996;13(11):2431-7 [PubMed] [Google Scholar]
- 29. Porter LA, Singh G, Lee JM. Abundance of cyclin B1 regulates gamma-radiation-induced apoptosis. Blood. 2000;95(8):2645-50 [PubMed] [Google Scholar]
- 30. Mazumder S, Gong B, Chen Q, Drazba JA, Buchsbaum JC, Almasan A. Proteolytic cleavage of cyclin E leads to inactivation of associated kinase activity and amplification of apoptosis in hematopoietic cells. Mol Cell Biol. 2002;22(7):2398-409 [DOI] [PMC free article] [PubMed] [Google Scholar]
- 31. Koh CG. Rho GTPases and their regulators in neuronal functions and development. Neurosignals. 2006;15(5):228-37 [DOI] [PubMed] [Google Scholar]
- 32. Agarwal ML, Agarwal A, Taylor WR, Stark GR. p53 controls boththe G2/M and the G1 cell cycle checkpoints and mediates reversible growth arrest in human fibroblasts. Proc Natl Acad Sci U S A. 1995;92(18):8493-7 [DOI] [PMC free article] [PubMed] [Google Scholar]
- 33. Costello PS, Cleverley SC, Galandrini R, Henning SW, Cantrell DA. The GTPase rho controls a p53-dependent survival checkpoint during thymopoiesis. J Exp Med. 2000;192(1):77-85 [DOI] [PMC free article] [PubMed] [Google Scholar]
- 34. Hippenstiel S, Schmeck B, N’Guessan PD, et al. Rho protein inactivation induced apoptosis of cultured human endothelial cells. Am J Physiol Lung Cell Mol Physiol. 2002;283(4):L830-8 [DOI] [PubMed] [Google Scholar]
- 35. Khwaja A, Sharpe CC, Noor M, Hendry BM. The role of geranylgeranylated proteins in human mesangial cell proliferation. Kidney Int. 2006;70(7):1296-304 [DOI] [PubMed] [Google Scholar]
- 36. Hippenstiel S, Schmeck B, Seybold J, Krull M, Eichel-Streiber C, Suttorp N. Reduction of tumor necrosis factor-alpha (TNF-alpha) related nuclear factor-kappaB (NF-kappaB) translocation but not inhibitor kappa-B (Ikappa-B)-degradation by Rho protein inhibition in human endothelial cells. Biochem Pharmacol. 2002;64(5-6):971-7 [DOI] [PubMed] [Google Scholar]
- 37. Park YJ, Ahn HJ, Chang HK, et al. The RhoGDI-alpha/JNK signaling pathway plays a significant role in mycophenolic acid-induced apoptosis in an insulin-secreting cell line. Cell Signal. 2009;21(2):356-64 [DOI] [PubMed] [Google Scholar]
- 38. Schulz F, Just I, Genth H. Prevention of Clostridium sordellii lethal toxin-induced apoptotic cell death by tauroursodeoxycholic acid. Biochemistry. 2009;48(38):9002-10 [DOI] [PubMed] [Google Scholar]
- 39. Piekny A, Werner M, Glotzer M. Cytokinesis: welcome to the Rho zone. Trends Cell Biol. 2005;15(12):651-8 [DOI] [PubMed] [Google Scholar]
- 40. Narumiya S, Yasuda S. Rho GTPases in animal cell mitosis. Curr Opin Cell Biol. 2006;18(2):199-205 [DOI] [PubMed] [Google Scholar]
- 41. Ichetovkin I, Han J, Pang KM, Knecht DA, Condeelis JS. Actin filaments are severed by both native and recombinant dictyostelium cofilin but to different extents. Cell Motil Cytoskeleton. 2000;45(4):293-306 [DOI] [PubMed] [Google Scholar]
- 42. Takesono A, Heasman SJ, Wojciak-Stothard B, Garg R, Ridley AJ. Microtubules regulate migratory polarity through Rho/ROCK signaling in T cells. PLoS One. 2010;5(1):e8774. [DOI] [PMC free article] [PubMed] [Google Scholar]
- 43. Verin AD, Birukova A, Wang P, et al. Microtubule disassembly increases endothelial cell barrier dysfunction: role of MLC phosphorylation. Am J Physiol Lung Cell Mol Physiol. 2001;281(3):L565-74 [DOI] [PubMed] [Google Scholar]
- 44. Watanabe N, Kato T, Fujita A, Ishizaki T, Narumiya S. Cooperation between mDia1 and ROCK in Rho-induced actin reorganization. Nat Cell Biol. 1999;1(3):136-43 [DOI] [PubMed] [Google Scholar]
- 45. Begum R, Nur EKMS, Zaman MA. The role of Rho GTPases in the regulation of the rearrangement of actin cytoskeleton and cell movement. Exp Mol Med. 2004;36(4):358-66 [DOI] [PubMed] [Google Scholar]
- 46. Earhart RH. Docetaxel (Taxotere): preclinical and general clinical information. Semin Oncol. 1999;26(5 Suppl 17):8-13 [PubMed] [Google Scholar]
- 47. Birukova AA, Birukov KG, Smurova K, et al. Novel role of microtubules in thrombin-induced endothelial barrier dysfunction. FASEB J. 2004;18(15):1879-90 [DOI] [PubMed] [Google Scholar]
- 48. Yin H, Gui Y, Zheng XL. 2-methoxyestradiol inhibits atorvastatin-induced rounding of human vascular smooth muscle cells. J Cell Physiol. 2010;222(3):556-64 [DOI] [PubMed] [Google Scholar]
- 49. Olson MF. Applications for ROCK kinase inhibition. Curr Opin Cell Biol. 2008;20(2):242-8 [DOI] [PMC free article] [PubMed] [Google Scholar]
- 50. Ying H, Biroc SL, Li WW, et al. The Rho kinase inhibitor fasudil inhibits tumor progression in human and rat tumor models. Mol Cancer Ther. 2006;5(9):2158-64 [DOI] [PubMed] [Google Scholar]
- 51. Deng L, Li G, Li R, Liu Q, He Q, Zhang J. Rho-kinase inhibitor, fasudil, suppresses glioblastoma cell line progression in vitro and in vivo. Cancer Biol Ther. 2010;9(11):875-84 [DOI] [PubMed] [Google Scholar]
- 52. Ogata S, Morishige K, Sawada K, et al. Fasudil inhibits lysophosphatidic acid-induced invasiveness of human ovarian cancer cells. Int J Gynecol Cancer. 2009;19(9):1473-80 [DOI] [PubMed] [Google Scholar]
- 53. Frame MC. Newest findings on the oldest oncogene: how activated src does it. J Cell Sci. 2004;117(Pt 7):989-98 [DOI] [PubMed] [Google Scholar]
Associated Data
This section collects any data citations, data availability statements, or supplementary materials included in this article.