Abstract
Many anurans use primarily the temporal patterning of sound pulses for differentiating between spectrally similar conspecific and heterospecific call types. ‘Interval-counting’ midbrain neurons appear to be particularly important for discriminating among calls that differ in pulse repetition rate (PRR). These cells respond selectively over a particular range of PRRs and only after several pulses have occurred with the appropriate timing; single, brief sound pulses do not elicit spikes. Although most interval-counting cells examined thus far are tuned to PRRs of approximately 30 to 100 pulses/s, some are selective for slower PRRs. In addition to differences in best rate, we show that the sharpness of interval tuning varies considerably across interval-counting neurons. To further investigate the processes that determine interval tuning, we made whole-cell recordings from cells of this type. Neurons that showed temporally summating EPSPs, with little or no inhibition or activity-dependent enhancement of excitation, exhibited low-pass or band-pass tuning to slow PRRs. Neurons that were band-pass or high-pass to intermediate or fast PRRs, however, showed inhibition and rate-dependent enhancement of excitation (Edwards et al., 2007). Surprisingly, across cells, interval tuning values calculated from membrane depolarization and spike rate measures were not significantly correlated. Neurons that showed sharp membrane depolarization-based tuning generally showed sharp spike-rate-based tuning. However, cells that showed broader membrane potential-based tuning varied considerably in their spike rate-based tuning; narrow spike-rate tuning resulted from ‘thresholding’ processes, whereby only the largest depolarizations triggered spikes. Neurons that lacked inhibition showed the greatest disparities between these two measures of interval tuning.
Keywords: Whole-cell, intracellular, auditory, midbrain, temporal processing, amplitude modulation
In anurans, the temporal patterning of sound pulses is the primary information used for differentiating between spectrally similar calls. One class of midbrain neurons, referred to as ‘interval-counting’ cells, appears to be particularly important for discriminating among calls that differ in pulse repetition rate (PRR). These cells only respond after several pulses are presented with appropriate interpulse intervals. Here we show that the range of selectivity and sharpness of interval tuning vary considerably across neurons. Whole-cell recordings revealed that neurons showing temporally summating EPSPs with little or no inhibition or activity-dependent enhancement of excitation exhibited low-pass or band-pass tuning to slow PRRs. Neurons that showed inhibition and rate-dependent enhancement of excitation, however, were band-pass or high-pass to intermediate or fast PRRs. Surprisingly, across cells, interval tuning based on membrane depolarization and spike rate measures were not significantly correlated. Neurons that lacked inhibition showed the greatest disparities between these two measures of interval tuning. Cells that showed broad membrane potential-based tuning, for example, varied considerably in their spike rate-based tuning; narrow spike rate-based tuning resulted from ‘thresholding’ processes, whereby only the largest depolarizations triggered spikes. The potential constraints associated with generating interval tuning in this manner are discussed.
Introduction
The timing of successive sound elements is an important temporal feature of the acoustic communication signals of many animals, including human speech (Ehret 1996). In many anuran species, these and other temporal properties of calls play a pivotal role in reproductive isolation, mate choice, and coordination of reproductive behavior (Gerhardt and Huber 2002; Wells and Schwartz 2007). In particular, the intervals between the onsets of successive pulses and pulse duration constitute the primary temporal acoustic features that enable most frog and toad species to differentiate between conspecific call types and reject heterospecific calls (Gerhardt 1982, 1988). The neural bases of these discriminative abilities are, therefore, of considerable interest.
In the peripheral auditory system, the timing of pulses is represented in the timing of afferent spikes, but selectivity for particular pulse repetition rates is absent (Rose and Capranica 1985). This temporal code is ‘read’ in the central auditory system, however, such that individual neurons in the torus semicircularis (anuran homologue of the inferior colliculus, IC) respond selectively over a narrow range of pulse repetition or amplitude modulation (AM) rates (Rose and Capranica 1983, 1985; Rose and Gooler 2007). Neurons of one class respond best over a particular range of pulse repetition rates (PRRs), but not to short-duration pulses that are repeated at much slower rates (Alder and Rose 1998, 2000). Perhaps the most interesting property of these neurons is that they respond only after a threshold number of pulses have been presented at the optimal rate. Further, it is the number of consecutive correct intervals (time between successive pulse onsets) that is important for eliciting spikes, not the number of pulses that occur within a particular integration time window (Edwards et al., 2002); that is, responses of these neurons reflect an interval-counting process.
Buonomano (2000) developed a model of how interval selectivity could arise from integration of excitation and inhibition that undergo short-term enhancement or depression, respectively, for a series of short inter-spike intervals. Our initial whole-cell (intracellular) recordings from interval-counting IC neurons, in vivo, have provided some support for a mechanism of this general nature (Edwards et al. 2007). In many cases, pulses presented at slow rates (long interpulse intervals) elicit inhibition and weak excitation. During a series of short interpulse intervals, however, excitation is enhanced and overcomes the concurrent inhibition; the PRR at which enhancement was first observed served as a predictor of best PRR (Edwards et al., 2007). In the present study we further examined how variation in inhibition and activity-dependent excitation contributes to differences in interval selectivity. We predicted that interval-counting neurons that show little if any inhibition or rate-dependent enhancement of excitation should be selective for very slow PRRs. We compare the interval tuning of these cells and those that show the more typical pattern of inhibition and rate-dependent excitation.
Secondly, we investigated how ‘thresholding’ properties might contribute to the interval selectivity of interval-counting neurons. Intracellular recordings from IC neurons in bats (Gittelman et al. 2009) and visual cortical cells in cats (Preibe and Ferster 2005) have revealed that the proximity of spike threshold to peak stimulus-driven depolarizations strongly influences the spike-rate-based selectivity for temporal features. We predicted, therefore, that such ‘thresholding’ properties would influence the sharpness of interval tuning in the anuran IC. We compare the interval tuning of membrane depolarization with that derived from spike rate measures and provide evidence that supports this hypothesis.
Materials and Methods
Recording procedures
Pacific tree frogs (Hyla regilla) and northern leopard frogs (Rana pipiens pipiens) were prepared for recording following the methods of Alder and Rose (2000); the justification for using these 2 species is associated with the temporal features (PRR) of mating and aggressive calls (see Edwards et al., 2007). Frogs were immersed in 3% urethane and a local anesthetic (Lidocaine HCL) was applied topically to the dorsal surface of the skull where a small opening was made to expose the optic tectum. Individuals were allowed to recover overnight from surgery and were subsequently immobilized with either d-tubocurarine chloride (6 μg/g), Mivacron (1 μg/g) or Atracurium (20 μg/g ) for recording. Whole-cell patch intracellular recordings from neurons in the torus semicircularis (also referred to as the ICanuran) were made, in vivo, according to methods described in detail by Rose and Fortune (1996) and Edwards et al. (2007). All procedures were approved by the University of Utah Institutional Animal Care and Use Committee.
Patch pipettes were constructed from borosilicate capillary glass (A-M systems #5960; 1 mm outer diameter, 0.58 mm inner diameter) using a Flaming-Brown type puller (Sutter Instruments, model P-97). These pipettes had outside tip diameters of approximately 1-2 μm and had resistances between 15 and 25 MΩ. Electrode tips were back-filled with a solution (pH = 7.4) consisting of (values in mM) 100 potassium gluconate, 2 KCl, 1 MgCl2, 5 EGTA, 10 HEPES, 20 KOH, and biocytin at a concentration to bring the final osmolarity to approximately 285 mOsmol. Biocytin was replaced by mannitol in the solution used to fill pipette shanks.
The pipette was advanced into the brain using an ‘inch-worm’ microdrive (Burleigh Co.) while applying positive pressure. After reaching the recording location, the pipette was advanced in 1.5 μm increments while maintaining positive pressure and passing - 0.1 nA square-wave pulses (500 ms) to monitor resistance. Cell contact was indicated by a small increase (10%) in the voltage change. Negative pressure was then applied to the pipette to increase the seal resistance to Giga Ohm levels. Subsequent to seal formation, negative current (~ −0.5 nA) was applied to rupture the patch and attain an intracellular recording. Seal resistances were typically greater than 2 GΩ with access resistances of 58 MΩ or less. Resting potentials ranged from −48 mV to −97 mV (median = −70 mV).
Stimulus generation and delivery
Search stimulus carrier frequencies were systematically varied from 300 Hz to 2200 Hz with modulation frequencies (sinusoidal amplitude modulation, SAM) ranging from 20 Hz to 100 Hz. In cases where this stimulus regimen was ineffective, slower modulation rates and/or lower frequencies were tested. Intracellular recordings were made in an audiometric chamber that was maintained at 18°C. The average PRR of advertisement calls at this temperature is approximately 15 pulses/s for R. pipiens and 90 pulses/s for H. regilla. Acoustic stimuli were generated using Tucker Davis Technologies (TDT) System II hardware and custom software (Alder and Rose 2000). Stimuli were presented free field in an audiometric room (Alder and Rose 2000). The speaker was situated 0.5 meters from the animal and contralateral to the recording site. Neurons were tested with AM and ‘variable duty cycle’ stimuli; in the latter regimen, pulse shape, duration and number were generally held constant and only PRR was varied. Three or more repetitions of a particular stimulus PRR were delivered before proceeding to the next PRR e.g., AAA, BBB, CCC…
Neurophysiological data acquisition and analyses
Recordings were digitized at 10 kHz (power 1401, Cambridge Electronic Design, Cambridge, UK) and stored as data files using Spike-2 software, also from the same supplier. Analyses were performed using acquired and custom Spike-2 programs. Peak membrane depolarizations were measured from averaged traces derived from a minimum of 3 repetitions of each stimulus condition, with stimulus amplitude held at approximately 10 dB above threshold (Alder and Rose 2000). In some cases, acquired recordings were median filtered (software feature of Spike-2) to remove spikes before averaging; averages taken from filtered and raw traces were compared to determine whether moderate spike activity influenced measurements of membrane depolarization. Neurons were classified as low-pass, high-pass or band-pass based on whether spike rate levels decreased to at least 50% of maximal at PRRs above, below, or above and below the best PRR. To compare interval tuning based on spike rate vs. membrane depolarization measures, the difference between the best PRR and the rate above (low-pass cells) or below (band-pass and high-pass neurons) that value at which the response was half maximal was calculated from the equation, Diffoctaves = log(2) PRRmax/PRR50%.
Histological and anatomical procedures
Following a recording session, each frog was deeply anesthetized by immersion in 5% urethane and perfused through the heart with a physiological saline/heparin solution followed by a 1:1 mixture of 5% glutaraldehyde and 0.2 M phosphate buffer (pH 7.4). The brain was then removed, fixed overnight in the glutaraldehyde solution, and sliced into 100 μm sections on a Vibratome. The sections were incubated overnight in a 10 ml solution of 0.3% Triton X-100 in phosphate-buffered saline (PBS) and the A & B reagents of the Vectastain Elite kit (Vector Labs). The sections were then washed 3×10 min in 0.01 M PBS and processed using the Vector Peroxidase Substrate kit (SK-4700); the slices were allowed to incubate in a solution of 10 ml 0.01 M PBS and 6 drops each of chromogen and hydrogen peroxide until they began to turn a light gray. The reaction was stopped by washing in 0.01 M PBS (3×10 min). Sections were then placed on slides, dried overnight, counterstained with Neutral Red (0.5%), dehydrated, cleared in xylene and cover-slipped. The locations of labeled neurons were then determined using an Olympus BH-2 microscope.
Results
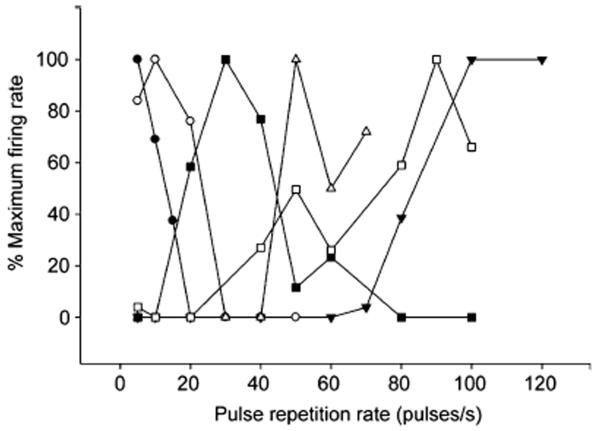
Interval tuning was assessed from responses to stimuli in which pulse repetition rate (PRR) was varied while holding pulse number, duration and shape constant. Neurons showed a high degree of variation in interval tuning (Fig. 1) and this range of variation was seen for R. pipiens and H. regilla i.e., the range of variation did not differ between these species (Mann-Whitney U=36, p=0.49). Neurons at one end of the spectrum responded best to very slow PRRs e.g., ≤ 10 pulses/s and showed either low-pass or weak band-pass selectivity. Cells at the other end of the spectrum showed varying degrees of high-pass selectivity, responding best to the highest PRRs tested. Between these extremes, interval-counting neurons generally showed band-pass selectivity, with sharpness of tuning varying across cells. The range of PRRs shown in figure 1 encompasses the range of PRRs seen in the natural calls of these animals (approximately 15 to 100 pulses/s). Some ‘high-pass’ neurons might have satisfied the criterion for band-pass selectivity if responses to higher PRRs had been tested; this inference is based on responses to AM stimuli not shown in this paper.
Fig. 1.
Normalized spike rate vs. pulse repetition rate for six interval-counting neurons. These representative cases illustrate the range of response profiles observed across the population of interval-counting units recorded; the variation depicted in the figure was observed across as well as within the two species (Hyla regilla and Rana. pipiens) examined. Pulse number, duration and shape were held constant and only pulse rate was varied
Whole-cell recordings: Subthreshold correlates of PRR selectivity
To investigate the mechanistic bases of this diversity in PRR tuning, we made whole-cell recordings, in vivo, from interval-counting neurons in the IC. PRR tuning information was obtained for 20 cells (11 in R. pipiens, 9 in H. regilla).
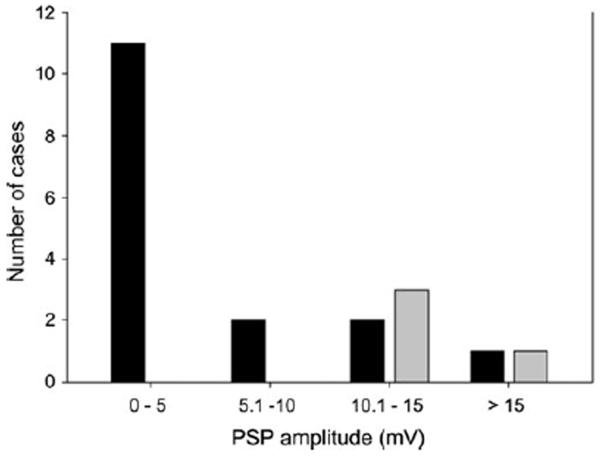
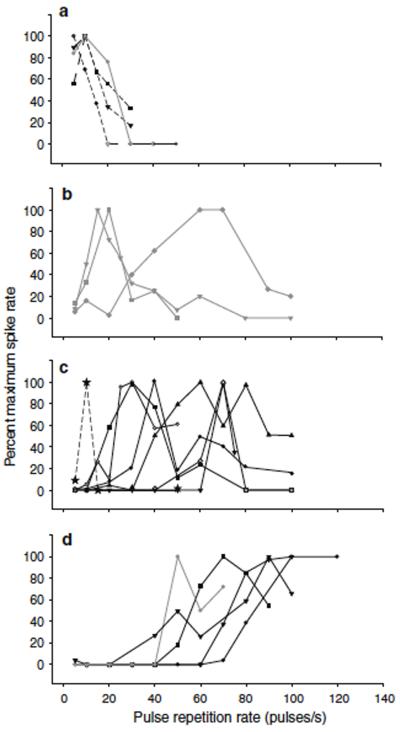
For the purpose of presentation, we partitioned this data set into 3 groups based on the magnitude of depolarization to single pulses (Fig. 2) and whether or not inhibition was evident. Cells of the first group (n=11) showed inhibition and small (less than 5 mV) depolarizations (predominant peak, Fig, 2) to individual naturalistic sound pulses. Neurons in the second group also showed inhibition, but depolarizations to individual pulses exceeded 5 mV. Cells in the last group appeared to have little, if any, inhibition and showed large (> 10 mV, gray bars Fig, 2) depolarizations to single pulses. The PRR tuning of neurons in these 3 groups is shown in figure 3. With the exception of one case that showed 2 response peaks, neurons of the first group (inhibition and small depolarizations to individual pulses) were band-pass (n=6) or high-pass (n=4) for PRR (Fig. 3c and d, solid black lines). Cells that showed inhibition, but had single-pulse depolarizations greater than 5 mV, were band-pass (n=3), low-pass (n=1) or high-pass (n=1) (gray traces, Fig. 3). Neurons in the third group exhibited low-pass (n=3) or, in one case, band-pass (tuned to 10 pulses/s) PRR selectivity (dashed lines, Fig. 3a and c, respectively). We next present representative intracellular recordings from neurons along this physiological spectrum. We begin with recordings from 2 cells that appeared to lack inhibition.
Fig. 2.
Distribution of cells with regard to their responses (peak depolarization) to single pulses. Pulses had natural pulse shape (fast rise, slow fall) and were broadcast at approximately 10 dB above threshold. Gray bars correspond to neurons that did not show inhibition
Fig. 3.
Normalized firing rate vs. pulse repetition rate for 19 of the 20 interval-counting neurons examined in this study. Neurons were either low-pass (a) band-pass (b & c), or high-pass (d) for the range of PRRs tested. One cell was not included because its’ response (2 peaks) did not fit well into one of the 3 selectivity categories. Data shown as dashed lines are from neurons that showed temporal summation and lacked inhibition. Other data are from neurons that showed inhibition and depolarizations to pulses presented at slow rates that were greater (gray) or less than (black) 5 mV e.g., cells of the types shown in figures 5 and 6, respectively
Neurons without inhibition and selective for slow PRRs
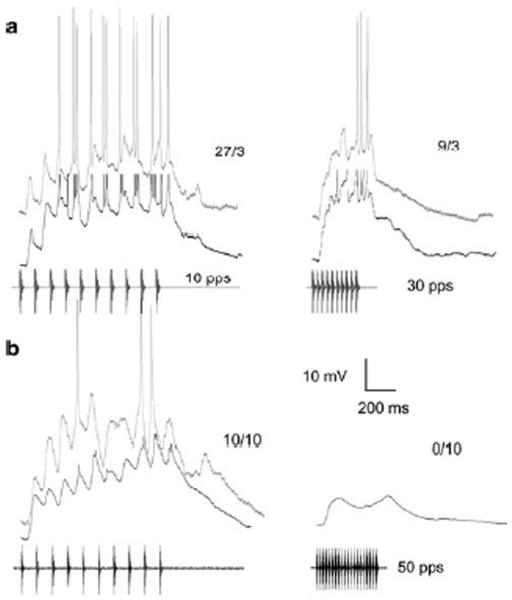
Neurons of this type showed temporally summating depolarizations that resulted in spiking at slow PRRs (Fig. 4a,b). These neurons did not show any apparent stimulus-related inhibitory potentials e.g., hyperpolarizations or negative deflections that were time-locked to stimulus pulses (Fig. 4). For these cells, spiking was reduced at faster PRRs because the stimulus (pulse train) durations, and consequently the time that depolarizations were suprathreshold, were shorter relative to those at 10 pulses/s (Fig. 4a,b); in the case of figure 4b, depolarizations were also smaller in amplitude. The apparent lack of stimulus-related inhibition in these cases, although it cannot be ruled out completely, stands in marked contrast to the integrative properties of the remaining neurons (shown as gray and black solid lines in figure 3) described below. Considering that low-pass selectivity for PRR is uncommon among interval-counting cells (4/20), it is highly unlikely that such tuning would be observed in 3 of the 4 neurons of this type (temporal summation without apparent inhibition) by chance alone (p=.038).
Fig. 4.
Responses of two representative neurons that showed temporally summating depolarizations without apparent inhibition or rate-dependent enhancement of excitation. In this and subsequent figures, responses from individual cells are arranged in a row and denoted by a particular label e.g., a, b, c. Responses of each cell to optimal PRR (10 pps) are shown in the left column. Responses to 30 pulses/s (a) and 50 pulses/s (b) are shown in the right column; the latter stimulus consisted of 20 pulses. The number of spikes elicited over the number of stimulus (pulse train) presentations is shown above each trace. Black traces = averaged responses; gray traces = responses to single presentation of each stimulus. a: Resting potential, −48 mV; carrier frequency = 150 Hz, the BEF of the neuron; stimulus amplitude = 75 dB SPL; recorded from H. regilla; PRR tuning function, filled squares figure 3a.. b: Resting potential = −76 mV; carrier frequency = 300 Hz (BEF); 57 dB SPL; recorded from R. pipiens; PRR tuning function, dashed line, figure 3c
Neurons with inhibition and selective for intermediate or fast PRRs
All high-pass interval-counting neurons (n=5) and 9 of the 10 that were band-pass showed clear evidence of inhibition in response to particular PRRs. The representative recordings provided in figures 5 and 6 show the range of response profiles that were observed for these neurons. It should be emphasized that the recordings shown in figures 5 and 6 represent points along a continuum, rather than discrete categories.
Fig. 5.
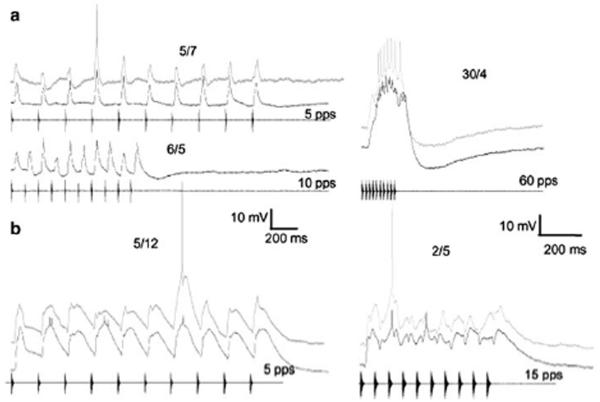
Responses of representative neurons, both recorded from R. pipiens, that exhibited prominent depolarizations i.e., > 5 mV, to pulses presented at slow rates. a: Averaged responses (black traces) to 5 and 10 pulses/s (left) and 60 pulses/s (best rate) (right); (gray trace), response to a single presentation of the 60 pulses/s stimulus. Resting potential = −50 mV; carrier = 700 Hz (BEF); 57 dB SPL; PRR tuning function, gray diamonds figure 3b. b: Averaged responses to 5 (left) and 15 (right) pulses/s. Resting potential = −75 mV; carrier = 900 Hz, (BEF); 66 dB SPL; PRR tuning function, gray circles figure 3a. The number of spikes elicited over the number of stimulus presentations is shown above each trace
Fig. 6.
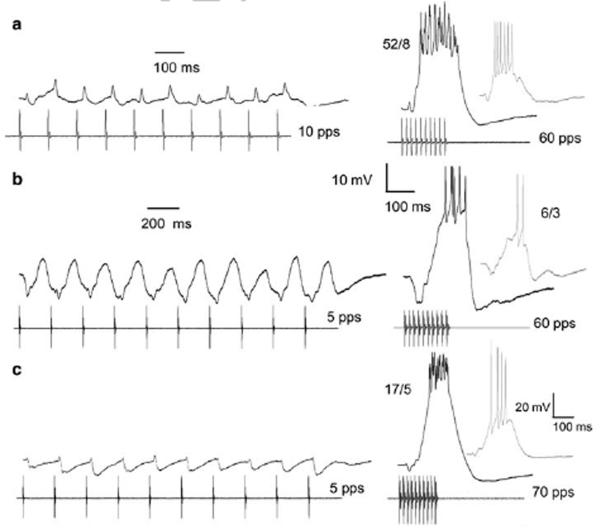
Representative neurons that showed evidence of inhibition and did not respond (spike) to slow PRRs (left column: 10 pulses/s (a); 5 pulses/s (b,c)); depolarizations at these PRRs were < 5 mV. Neurons of this type exhibited enhanced excitation and responded optimally to fast PRRs (right column: 60 pulses/s (a,b); 70 pulses/s (c)). a: Resting potential = −73 mV; carrier frequency = 220 Hz (BEF); 55 dB SPL; PRR tuning function, filled normal triangles figure 3c. b: resting potential = −67 mV; carrier frequency = 260 Hz, (BEF); 57 dB SPL. c: Resting potential = −68 mV; carrier frequency = 300 Hz (BEF); 66 dB SPL; PRR tuning function, inverted triangles figure 3c. Time scale bar in b also applies to c. Neurons recorded in R. pipiens (a,c) and H. regilla (b)
Neurons at one end of this range in PSP (postsynaptic potential) profiles showed prominent (>5 mV) depolarizations to individual pulses (Fig.5a,b). These 2 cells responded best at PRRs of 60 pulses/s (a) and 15 pulses/s (b), and spikes were occasionally elicited at slow PRRs (5-10 pulses/s) in both cases. For the neuron shown in figure 5a, hyperpolarizations were observed for PRRs of 10 pulses/s and greater, but not at 5 pulses/s; the amplitude of hyperpolarizations increased with successive pulses, suggesting a rate-dependent enhancement of inhibition. Cells with these physiological properties were either low-pass (n=1), band-pass (n=3) or high-pass (n=1) for PRR (gray traces, Fig. 3).
Neurons that showed hyperpolarizations and relatively small depolarizations (< 5 mV, Fig. 2) to individual pulses showed either band-pass tuning to mid or fast PRRs or were high-pass (solid black lines, Fig. 3c,d, respectively). The examples presented in figure 6 represent the range of response profiles that were observed. The cell shown in figure 6a exhibited small depolarizations (2-5 mV) and hyperpolarizations in response to pulses repeated at 10 pulses/s, and responded maximally to a PRR of 60 pulses/s; the neuron shown in figure 6b was similar, but showed more prominent hyperpolarizations at slow PRRs. For neurons at the other end of this range in response profiles, pulses repeated at slow rates e.g., 5 pulses/s, elicited primarily hyperpolarizations (Fig. 6c). Responses at faster PRRs appeared to result from rate-dependent enhancement of excitation (Edwards et al., 2007). The prominent after-hyperpolarization at fast PRRs appeared to be due to inhibition, rather than intrinsic membrane properties; these PSPs could be reversed by hyperpolarizing cells and did not occur following depolarization from current injection (data not shown).
Spike rate vs. PSP measures of interval selectivity
It should be noted that many of the PRR tuning functions of neurons with prominent depolarizations to individual pulses (shown as gray or dashed lines in Fig. 3) are as sharp as those that show small depolarizations (shown in black in Fig 3). We therefore asked to what extent the interval selectivity based on spike rate measures could be understood from the shapes of PSP-based tuning functions and their relations to spike threshold; ‘thresholding’ processes could generate sharp tuning to PRR, even when the tuning of the underlying depolarizations (PSP tuning) is comparatively broad. For example, spikes might be elicited over a narrow range of PRRs if the neuron’s threshold for spike initiation was slightly less than the peak stimulus-elicited depolarizations. Alternatively, the PSP tuning for PRR could be nearly as sharp as that for spike rate measures. We, therefore, investigated the extent to which interval tuning based on spike rate paralleled that for membrane potential.
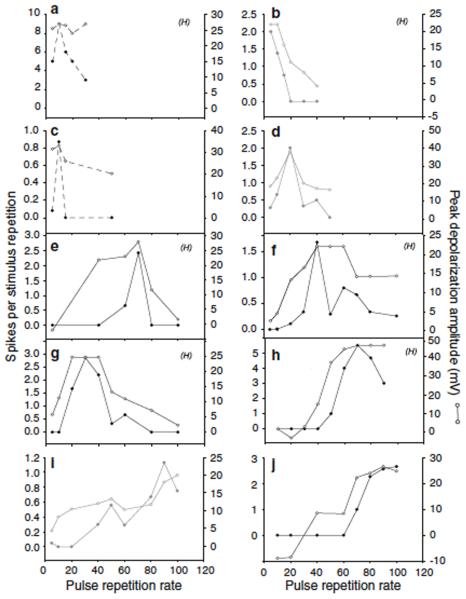
Figure 7 shows PSP amplitudes and spike rates across a range of PRRs for representative low-pass (a,b), band-pass (c-g) and high-pass (h-j) neurons. The correspondence between tuning curves generated from PSP vs. spike rate measures varied considerably across cell types. Neurons that had temporally summating depolarizations at slow PRRs and little or no inhibition e.g., figure 4, showed low-pass or band-pass spike-rate-based selectivity to slow PRRs (dashed lines, Fig 7a,c); PSP amplitude, however, varied comparatively little with PRR, particularly below the best rate. The sharp band-pass selectivity of the case shown in figure 7c (also presented in Fig. 4b) occurred primarily because the depolarizations at 10 pulses/s were minimally sufficient for eliciting spikes i.e., thresholding. This selectivity was largely maintained when stimulus amplitude was increased e.g., for 15 Hz AM, increasing amplitude approximately 19 dB (48 to 77 dB SPL) resulted in only a small increase (33 vs. 30 mV) in PSP amplitude; spikes were not elicited at either amplitude.
Fig. 7.
Spikes per stimulus presentation (left axis, closed symbols) and depolarization amplitude (mV) (right axis, open symbols) vs. pulse repetition rate for 10 neurons. Line types are coded as described earlier: data shown as dashed lines are from neurons that showed temporal summation and lacked inhibition. Other data are from neurons that showed inhibition and either prominent (gray) or small (black) depolarizations to pulses presented at slow rates e.g., cells of the types shown in figures 5 and 6, respectively. Neurons recorded from H. regilla are denoted by an (H), those from R. pipiens are unmarked.
For all other neurons, PRR tuning functions derived from PSP amplitude measures qualitatively mirrored those based on spike rate, but were broader; that is, the classification of each cell as low-, band- or high-pass was the same for spike rate and PSP amplitude measures. Neurons of the type shown in figure 6 (inhibition with weak excitation at slow PRRs) generally showed the greatest PSP amplitude-based selectivity for PRR. In most cases, the low PRR side of these tuning functions was as steep as the corresponding aspect of the spike rate curves (panels with solid black tuning curves, Fig.7g,h,j). This property accounts for the remarkable feature that neurons of this type generally do not spike over a considerable range of slow PRRs.
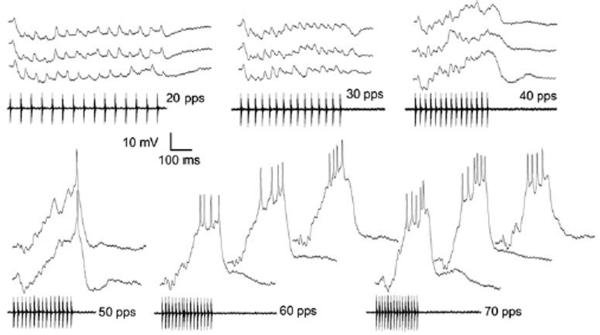
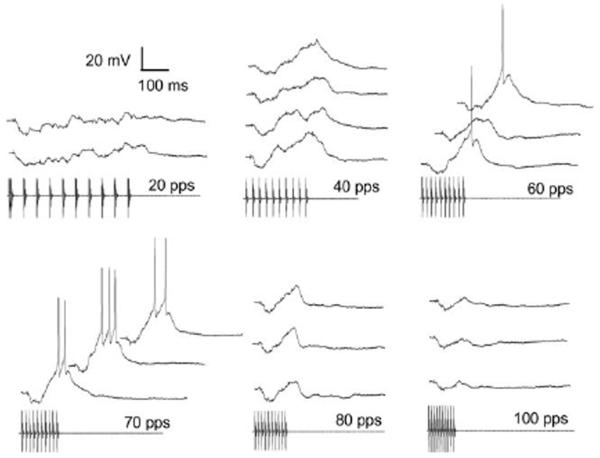
Figure 8 shows responses of the neuron depicted in figure 7h to presentations of stimuli that varied in PRR from 20 to 70 pulses/s. This cell had a resting potential of approximately −76 mV and spike threshold of approximately −39 mV. Stimuli that consisted of pulses repeated at 20 pulses/s and 30 pulses/s were predominantly inhibitory; with the exception of a small onset depolarization, the membrane potential remained below the resting level during the stimulus (Fig. 8). At 40 pulses/s, however, maximum depolarizations occurred near the end of the pulse train and membrane potentials of −56.8 mV and −59.3 mV were reached on 2 of 4 stimulus presentations (Fig 8). For even these largest EPSPs, peak depolarizations were approximately 18-20 mV less than the threshold for spike initiation (≈ −39 mV). When the PRR was increased to 50 pulses/s, each stimulus repetition elicited depolarizations that were sufficient (37-38 mV) for triggering a single spike. For PRRs of 60 and 70 pulses/s, peak depolarizations (45 mV) exceeded spike threshold by as much as 8 mV i.e., the membrane potential reached −31 mV, and triggered 4-6 spikes per stimulus presentation (Fig. 8). Thus, even though the latter stimuli were well above threshold i.e., stimuli consisted of 15 pulses (9-10 pulses were required to elicit spiking) and were approximately 12 dB above its amplitude threshold, responses to PRRs ≤ 40 pulses/s were subthreshold. The potential significance of this robust PRR (interval) tuning is discussed later.
Fig. 8.
Individual responses of the neuron shown in figure 7h to the stimuli ranging in pulse repetition rate from 20 to 70 pulses/s (pps). Resting potential = −76 mV. Stimulus amplitude = 47 dB SPL; BEF = 700 Hz
In contrast, the differential between spike threshold and PSP amplitude appeared to contribute more appreciably to the observed spike-rate-based interval selectivity of the 2 neurons shown in figure 7e and f; below the best PRR, few or no spikes were elicited even though PSP amplitude was substantial. This point is illustrated in figure 9, which shows responses of the neuron of figure 7E to PRRs from 20-100 pulses/s. This neuron had a resting potential of approximately −62 mV and spike initiation threshold of approximately −33.5 mV. As in the previous case, this cell responded best at 70 pulses/s, and no spikes were elicited for PRRs ≤ 40 pulses/s. However, at 40 pulses/s, 2 of the 4 responses of this neuron showed peak depolarizations that were only 4.9 mV and 7.5 mV below threshold for spike initiation i.e., reached membrane potentials of −41 mV and −38.4 mV (Fig. 9). This neuron’s sharp tuning for PRR was, therefore, critically dependent on threshold for spike initiation being poised such that only PRRs near the best rate elicited PSPs sufficient for triggering spikes. Interestingly, PSP-based interval tuning was sharpest at PRRs above 70 pulses/s (best rate). At 80 pulses/s, the early hyperpolarization was comparable to that seen in responses to 70 pulses/s (8-10 mV), but the depolarization was substantially less (Fig. 9).
Fig. 9.
Individual responses of the neuron shown in figure 7e to pulse repetition rates ranging from 20 to 100 pulses/s (pps). Resting potential = −62.5 mV. Stimulus amplitude = 75 dB SPL; BEF =300 Hz. Pulse duration was 20 ms for the 20 pulses/s (pps) stimulus, 10 ms for all other stimuli
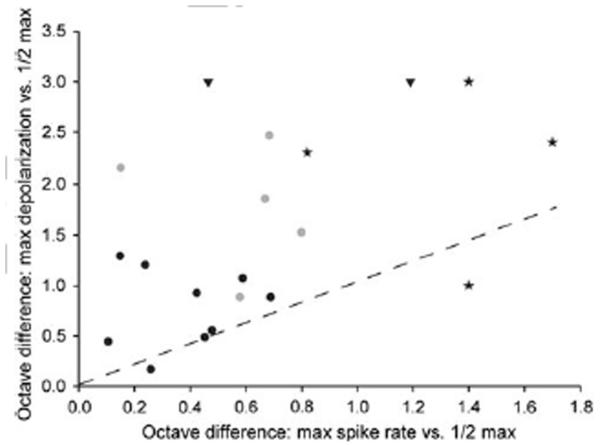
To compare the PRR selectivity functions derived from spike rate vs. membrane depolarization measurements across interval-counting neurons, we measured the PRR range (in fractions of an octave) over which the spike rate and PSP amplitude decreased to ½ of the maximal value (Fig. 10). In general, interval selectivity based on membrane potential was most similar to that based on spike rate for neurons that showed primarily inhibition at slow PRRs (black circles, Fig. 10), and weakest for those that showed primarily temporal summation of depolarizations at these PRRs (black triangles, Fig. 10). Cells that showed intermediate response properties (gray circles, Fig. 10), as represented in figure 5, tended to show PSP-based PRR tuning that was broader than that observed for the neurons that showed primarily inhibition at slow PRRs. Although membrane potential-based interval tuning for the former cells (gray symbols) was relatively broad, interval tuning for spike rate was much more similar across these types. Accordingly, across cells represented by gray and black circles in figure 10, interval tuning of membrane depolarization vs. spike rate were not significantly correlated (r =0.30, n=15, p=.274). Spike thresholding effects accounted for this ‘sharpening’ of interval tuning for spike rate. Across all neurons that showed band-pass or high-pass tuning for PRR, spike rate responses decreased to 50% of maximum at a median value of 0.46 octaves (range = 0.11-0.80) below the best PRR, compared to 0.92 octaves (range = 0.16 − 2.46) for membrane depolarization.
Fig. 10.
The octave difference between the PRR that elicited maximum depolarization and the lower rate that produced half maximum depolarization (y axis) vs. the octave difference between the PRRs that elicited the maximum spike rate and half maximum spike rate (x axis). Symbols reflect whether neurons were of the types shown in figures 4 (black triangles), 5 (gray circles) or 6 (black circles); data for low-pass cells are shown as star symbols, and reflect the steepness of the low-pass curves e.g., figure 7a,b. For neurons such as those in figure 4, depolarizations never dropped below half the maximum and are therefore given a value of >3 octaves on the y axis.
For low-pass interval-counting neurons (Fig. 3a), we calculated the octave difference between the PRR of maximum response (spike rate or membrane depolarization) and the faster PRR at which the response decreased to ½ maximal (stars, Fig. 10). As for the band-pass and high-pass neurons, spike rate-based selectivity was generally greater than that for membrane depolarization.
Discussion
Tuning for AM rate or PRR has been found for midbrain auditory neurons across a wide taxonomic range (Langner 1992), but the underlying mechanisms remain unclear. Our results provide the first comparison of how PRR, and therefore interval duration, is represented by spike-rate vs. membrane potential responses across a population of interval-counting auditory neurons. We have shown that interval selectivity is mechanistically diverse. For example, low-pass and band-pass selectivity to slow PRRs was generally associated with temporally summating depolarizations and a relative lack of inhibition. PSP tuning to PRR was much broader than spike-rate based tuning for these neurons. In contrast, neurons that were high-pass or band-pass to intermediate PRRs generally showed prominent inhibition with only slightly broader PSP-based tuning. In a few cases, however, tuning based on spike rate was much sharper than the underlying PSP tuning e.g., Fig. 7 e,f.
The distributions of best PRRs did not differ between these species. This result supports the notion that interval-counting neurons are not functionally specialized to detect a particular call type; the advertisement calls of R. pipiens and H. regilla have PRRs of approximately 15 pulses/s and 90 pulses/s, respectively, whereas their aggressive calls have the opposite PRR relation (fast for R. pipiens, slow for H. regilla).
Comparisons with other systems
These and previous findings for auditory neurons in the IC of anurans (Edwards et al. 2007) parallel recent whole-cell recordings from electrosensory cells in the posterior exterolateral nucleus of ‘pulse-type’ mormyrid electric fish (Carlson 2009) and auditory neurons in the inferior colliculus of mice (Geis and Borst 2009) and bats (Gittelman et al. 2009). Electrosensory neurons also show high-pass or band-pass interval selectivity i.e., respond selectively for short or intermediate intervals, and the mechanisms for achieving this selectivity appear to be similar for both systems (Carlson 2009; Pluta and Kawasaki 2010). For example enhancement of excitation, also seen in midbrain neurons of ‘wave-type’ electric fish (Fortune and Rose 2000), appears to overcome inhibition at short interpulse intervals, particularly in auditory and electrosensory cells that show strong high-pass selectivity. Further, like band-pass and high-pass interval-counting auditory neurons, many of the electrosensory counterparts showed PSP-based interval selectivity that was nearly as sharp as that derived from spike-rate measurements. Similarly, Gittelman et al. (2009) have shown that the spike rate-based FM selectivity of some IC neurons in bats is much greater than that of the underlying depolarization. Thus, in all of these systems, thresholding properties enhanced spike-rate based selectivity over the underlying PSP tuning. In cases where threshold for spike initiation was slightly less than the peak depolarizations reached at the optimal PRR, spike-rate tuning was markedly enhanced over the PSP-based tuning. An analogous process has also been reported for enhancing the orientation selectivity (Carandini and Ferster 2000) and direction selectivity (Priebe and Ferster 2005) of visual cortical neurons, suggesting that threshold-based enhancement is a general property of information processing in sensory systems.
Recent whole-cell recordings from the inferior colliculus of mice (Geis and Borst 2009) suggest that interplay between inhibition and excitation underlies band-suppression selectivity for sinusoidal AM, much like that observed in the anuran IC. Band-suppression (also called band-reject) neurons are a subclass of interval-counting neurons (Edwards and Rose 2003; Leary et al. 2008) that also show long-pass duration selectivity. It remains to be seen whether AM band-suppression neurons in mammals, as in anurans, show interval-counting properties.
Functional implications of mechanistic diversity: Temporal summation vs. interplay between inhibition and rate-dependent excitation
Previous work in anurans has demonstrated that IC auditory neurons show level-tolerant interval selectivity (reviewed in Rose and Gooler, 2007). This general invariance of interval tuning over different sound pressure levels is surprising given our finding that PSP responses were often more broadly interval tuned than spike rate responses. In such cases e.g., figure 7c, thresholding presumably generates a sharply tuned output. Hence, if PSP amplitude increased with sound pressure level, spikes would be elicited at PRRs that were ineffective at lower sound levels and broadening of the spike-rate-based interval tuning would occur. However, as presented earlier, this was not the case; increasing sound level minimally altered peak depolarization. Further work is needed to test the generality of these results. For many of the neurons recorded in this study that showed inhibition, PSP responses were almost as sharply interval tuned as the spike rate responses. Further, peak depolarizations were, in many cases, well above threshold for spike initiation. As a result, these neurons responded selectively and strongly for a particular range of PRR.
These observations provide insights into the functional consequences and constraints potentially associated with the different types of interval tuning mechanisms reported in the current study. Interval tuning that results from temporal summation of EPSPs, for example, can be quite sharp if depolarizations at the best PRR slightly exceed spike-initiation threshold and do not increase appreciably above that value with increasing sound pressure level. However, neurons of this type may have a restricted dynamic range over which they can code increasing sound level with increasing spike rate, while maintaining interval selectivity.
Female anurans experience calls of increasing amplitude as they approach a calling male, and are capable of discriminating among calls that differ in temporal properties even when call amplitudes are quite high (Gerhardt 2001; Gerhardt and Huber 2002; Wells and Schwartz 2007). Similarly, males are able to detect changes in the amplitude of a neighbor’s calls and identify those changes with the particular call type (i.e., aggressive versus mating calls) that differ primarily in temporal structure (Brenowitz and Rose 1994; Rose and Brenowitz 1997). Because of dynamic range constraints, many temporal summation-type neurons, with differing thresholds, would be required for these behaviors. In this coding scheme, additional cells would be recruited into the active population as stimulus amplitude increased. In contrast, neurons in which depolarization responses were nearly as sharply interval tuned as the spike-rate responses could function over a larger dynamic range and code increasing call amplitude in their increasing spike rate. In this latter case, concurrent excitatory and inhibitory conductances might increase in parallel as stimulus amplitude is raised. Because the differential between membrane potential and synaptic reversal potential is greater for excitation vs. inhibition, greater depolarization and, therefore, increased spike rate should occur as sound amplitude is increased. The sharp PRR tuning of the membrane potential responses would ensure, however, that cells of this type generate spikes to only a narrow range of PRRs.
Finally, our results raise the question of the functional relations of temporal summation-type neurons to other interval-selective cells. It is unclear whether temporal summation-type neurons, which are rarely encountered in H. regilla and R. pipiens, represent recent mechanistic solutions for processing slow PRRs or vestiges of an ancestral interval counting mechanism. Cells of this type are not unique for processing low temporal frequencies; ‘long-interval’ neurons (Edwards et al. 2009) respond selectively for slow PRRs and are commonly found in both species. In contrast, interval-counting neurons that show interplay of rate-dependent excitation and inhibition (Edwards et al. 2007) are highly selective for intermediate or fast PRRs. Cells of this latter type may have been required for processing the fast PRRs that characterize the calls of many derived anuran species, thereby overcoming the limitations associated with temporal summation-type neurons. Intracellular studies investigating the mechanisms underlying interval selectivity are currently limited to two species (H. regilla and R. pipiens; Edwards et al. 2007, 2008) representing two highly derived lineages within the anuran clade (Duellman and Trueb 1986). Further comparative studies of temporal processing are needed, therefore, to address the question of whether temporal summation-type neurons represent a pleisiomorphic condition.
Relations to previous work
These new data extend our previous findings indicating that the best PRR for interval-counting neurons is predicted by the PRR at which rate-dependent enhancement of excitation is first seen and EPSP duration (Edwards et al., 2007). Inhibition strength was positively correlated with interval-number threshold, but not best PRR. We now show, however, that the rarely encountered interval-counting neurons that are selective for slow PRRs appear to have little or no inhibition, whereas inhibition is prominent in interval-counting neurons that have best PRRs in the mid to fast range. These results suggest that inhibition functions, in part, to attenuate responses at slow PRRs.
Overall, our findings are generally consistent with a recent model (Buonomano 2000) in which interval selectivity results from interplay between excitation, inhibition and short-term synaptic plasticity. It remains to be determined whether rate-dependent depression of inhibition, a component of Buonomano’s model, plays a role in the interval tuning of IC neurons. Many interval-counting neurons show band-pass or low-pass interval selectivity, raising the question of what underlies decreases in depolarizations and spike rate at PRRs above the best rate. Our earlier work (Edwards et al. 2007) provided some evidence that intervals shorter than the best rate are less effective because afferents to the IC neurons fail to sustain responses at fast PRRs; that is, the fast PRR side of the tuning function appears to be determined by an input property vs. a result of processing within the IC. For low-pass cells, synaptic depression of excitation may limit responses to fast PRRs. Alternatively inhibition, which appears to play little role at slow PRRs, may facilitate and limit depolarization at fast PRRs. Further work is needed to address these issues.
Finally, it is becoming increasingly clear that excitation and inhibition can be integrated in diverse ways (Buonomano 2000; Grothe 1994; Large and Crawford 2002) to generate selectivity for a wide range of temporal parameters of sounds, including interval length (Edwards et al. 2007, 2008), duration (Aubie et al. 2009, Casseday et al. 1994; Leary et al. 2008), sinusoidal frequency modulation (Casseday et al. 1997) and direction of frequency modulation (Zhang et al. 2003). These and future studies should provide considerable insights into how temporal patterns of activity, representing temporal information in acoustic signals, are decoded in the brain.
Footnotes
Current address: Department of Biology, Box 1848, University of Mississippi, Oxford, Mississippi, 38677
REFERENCES
- Alder TB, Rose GJ. Long-term temporal integration in the anuran auditory system. Nat Neurosci. 1998;1:519–522. doi: 10.1038/2237. [DOI] [PubMed] [Google Scholar]
- Alder TB, Rose GJ. Integration and recovery processes contribute to the temporal selectivity of neurons in the northern leopard frog, Rana pipiens. J Comp Physiol A. 2000;186:923–937. doi: 10.1007/s003590000144. [DOI] [PubMed] [Google Scholar]
- Aubie B, Becker S, Faure PA. Computational models of millisecond level duration tuning in neural circuits. J Neurosci. 2009;29:9255–9270. doi: 10.1523/JNEUROSCI.1085-09.2009. [DOI] [PMC free article] [PubMed] [Google Scholar]
- Buonomano DV. Decoding temporal information: a model based on short-term synaptic plasticity. J Neurosci. 2000;20:1129–1141. doi: 10.1523/JNEUROSCI.20-03-01129.2000. [DOI] [PMC free article] [PubMed] [Google Scholar]
- Carandini M, Ferster D. Membrane potential and firing rate in cat primary visual cortex. J. Neuroscience. 2000;20:479–484. doi: 10.1523/JNEUROSCI.20-01-00470.2000. [DOI] [PMC free article] [PubMed] [Google Scholar]
- Carlson BA. Temporal-pattern recognition by single neurons in a sensory pathway devoted to social communication behavior. J. Neuroscience. 2009;29:9417–9428. doi: 10.1523/JNEUROSCI.1980-09.2009. [DOI] [PMC free article] [PubMed] [Google Scholar]
- Casseday JH, Ehrlich D, Covey E. Neural tuning for sound duration: role of inhibitory mechanisms in the inferior colliculus. Science. 1994;264:847–850. doi: 10.1126/science.8171341. [DOI] [PubMed] [Google Scholar]
- Casseday JH, Covey E, Grothe B. Neural selectivity and tuning for sinusoidal frequency modulations in the inferior colliculus of the big brown bat, Eptesicus fuscus. J. Neurophysiol. 1997;77:1595–1605. doi: 10.1152/jn.1997.77.3.1595. [DOI] [PubMed] [Google Scholar]
- Duellman WE, Trueb L. Biology of Amphibians. McGraw-Hill; New York: 1986. [Google Scholar]
- Edwards CJ, Alder TB, Rose GJ. Auditory midbrain neurons that count. Nat Neurosci. 2002;5:934–936. doi: 10.1038/nn916. [DOI] [PubMed] [Google Scholar]
- Edwards CJ, Leary CJ, Rose GJ. Counting on inhibition and rate-dependent excitation in the auditory system. J Neurosci. 2007;27:13384–13392. doi: 10.1523/JNEUROSCI.2816-07.2007. [DOI] [PMC free article] [PubMed] [Google Scholar]
- Ehret G. Common rules of communication sound perception. In: Kanwal JS, Ehret G, editors. Behavior and Neurodynamics for Auditory Communication. Cambridge UP; Cambridge: 1996. [Google Scholar]
- Fortune ES, Rose GJ. Short-term synaptic plasticity contributes to the temporal filtering of electrosensory information. J Neurosci. 2000;20:7122–7130. doi: 10.1523/JNEUROSCI.20-18-07122.2000. [DOI] [PMC free article] [PubMed] [Google Scholar]
- Geis HR, Borst JGG. Intracellular responses of neurons in the mouse inferior colliculus to sinusoidal amplitude-modulated tones. J. Neurophysiol. 2009;101:2002–2016. doi: 10.1152/jn.90966.2008. 2009. [DOI] [PubMed] [Google Scholar]
- Gerhardt HC. Acoustic properties used in call recognition by frogs and toads. In: Fritzch B, Ryan MJ, Wilczynski W, Hetherington TE, Walkowiak W, editors. The evolution of the amphibian auditory system. Wiley; New York: 1988. 1988. [Google Scholar]
- Gerhardt HC. Acoustic communication in two groups of closely related treefrogs. Adv Study Behav. 2001;30:99–167. [Google Scholar]
- Gerhardt HC, Huber F. Acoustic Communication in Insects and Anurans. Univ Chicago Press; Chicago, IL: 2002. 2002. [Google Scholar]
- Gittelman JX, Na L, Pollak GD. Mechanisms underlying directional selectivity for frequency-modulated sweeps in the inferior colliculus revealed by in vivo whole-cell recordings. J. Neuroscience. 2009;29:13030–13041. doi: 10.1523/JNEUROSCI.2477-09.2009. [DOI] [PMC free article] [PubMed] [Google Scholar]
- Grothe B. Interaction of excitation and inhibition in processing of pure tone and amplitude-modulated stimuli in the medial superior olive of the mustached bat. J Neurophysiol. 1994;71:706–721. doi: 10.1152/jn.1994.71.2.706. [DOI] [PubMed] [Google Scholar]
- Langner G. Periodicity coding in the auditory system. Hearing Research. 1992;60:115–142. doi: 10.1016/0378-5955(92)90015-f. [DOI] [PubMed] [Google Scholar]
- Large EW, Crawford JD. Auditory temporal computation: interval selectivity based on post-inhibitory rebound. J Comput Neurosci. 2002;13:125–142. doi: 10.1023/a:1020162207511. [DOI] [PubMed] [Google Scholar]
- Leary CJ, Edwards CJ, Rose GJ. Midbrain auditory neurons integrate excitation and inhibition to generate duration selectivity: an in-vivo whole-cell patch study in anurans. J Neurosci. 2008;28:5481–5493. doi: 10.1523/JNEUROSCI.5041-07.2008. [DOI] [PMC free article] [PubMed] [Google Scholar]
- Pluta SR, Kawasaki M. Temporal selectivity in midbrain neurons identified by modal variation in active sensing. J. Neurophysiol. 2010 doi: 10.1152/jn.00731.2009. in press. [DOI] [PubMed] [Google Scholar]
- Priebe NJ, Ferster D. Direction selectivity of excitation and inhibition in simple cells of the cat primary visual cortex. Neuron. 2005;45:133–145. doi: 10.1016/j.neuron.2004.12.024. [DOI] [PubMed] [Google Scholar]
- Rose GJ, Brenowitz EA. Plasticity of aggressive thresholds in Hyla regilla: discrete accommodation to encounter calls. Anim Behav. 1997;53:353–361. [Google Scholar]
- Rose GJ, Brenowitz EA. Pacific treefrogs use temporal integration to differentiate advertisement from encounter calls. Anim Behav. 2002;63:1183–1190. [Google Scholar]
- Rose G, Capranica RR. Temporal selectivity in the central auditory system of the leopard frog Rana pipiens. Science. 1983;219:1087–1089. doi: 10.1126/science.6600522. [DOI] [PubMed] [Google Scholar]
- Rose GJ, Capranica RR. Processing amplitude-modulated sounds by the auditory midbrain of two species of toads: matched temporal filters. J Comp Physiol A. 1984;154:211–219. [Google Scholar]
- Rose GJ, Fortune ES. New techniques for making whole-cell recordings from CNS neurons in vivo. Neurosci Res. 1996;26:89–94. doi: 10.1016/0168-0102(96)01074-7. 1996. [DOI] [PubMed] [Google Scholar]
- Rose GJ, Gooler DM. Function of the anuran central auditory system. In: Feng AS, Narins PM, Fay RH, Popper AH, editors. Hearing and Sound Communication in Amphibians. Springer Handbook of Auditory Research. Springer-Verlag; New York: 2007. [Google Scholar]
- Wells KD, Schwartz JJ. The behavioral ecology of anuran communication. In: Feng AS, Narins PM, Fay RH, Popper AH, editors. Hearing and Sound Communication in Amphibians. Springer Handbook of Auditory Research. Springer-Verlag; New York: 2007. pp. 44–86. [Google Scholar]
- Zhang LI, Tan AYY, Schreiner CE, Merzenich MM. Topography and synaptic shaping of direction selectivity in primary auditory cortex. Nature. 2003;424:201–205. doi: 10.1038/nature01796. [DOI] [PubMed] [Google Scholar]


