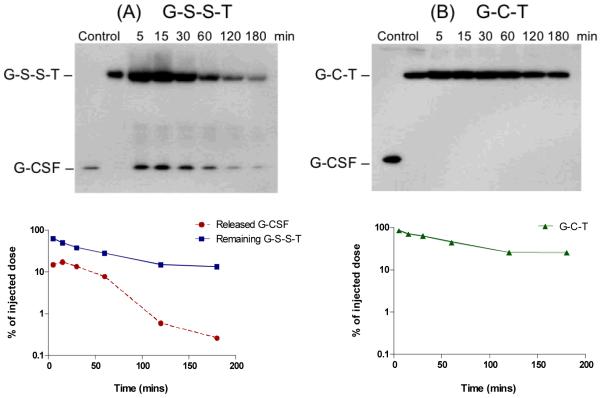
Figure 4. Evaluation of in vivo release of free G-CSF.
G-S-S-T (a) or G-C-T (b) was administered intravenously to CF1 mice via the tail vein at a dose of 4 mg/kg. After administration, the collected blood from 3 mice were pooled together and analyzed by non-reducing SDS-PAGE followed by anti-G-CSF Western blot as described in the Materials and Methods section. The amount of protein in each band was quantified using Quality One® software (Bio-Rad, Hercules, CA), and the percentage was calculated based on the injected dose.

