Abstract
We perform steered molecular dynamics (SMD) simulations and use the Brownian dynamics fluctuation-dissipation-theorem (BD -FDT) to accurately compute the free-energy profiles for several biophysical processes of fundamental importance: hydration of methane and cations, binding of benzene to T4-lysozyme L99A mutant, and permeation of water through aquaglyceroporin. For each system, the center-of-mass of the small molecule (methane, ion, benzene, and water, respectively) is steered (pulled) at a given speed over a period of time, during which the system transitions from one macroscopic state/conformation (State A) to another one (State B). The mechanical work of pulling the system is measured during the process, sampling a forward pulling path. Then the reverse pulling is conducted to sample a reverse path from B back to A. Sampling a small number of forward and reverse paths, we are able to accurately compute the free-energy profiles for all the afore-listed systems that represent various important aspects of biological physics. The numerical results are in excellent agreement with the experimental data and/or other computational studies available in the literature. 82.20.Wt, 82.37.Rs, 05.60.Cd, 05.40.Jc, 05.70.Ln
I. Introduction
Accurate computation of free-energy is of essential importance in quantitative studies of biological systems because most biophysical/chemical processes are driven by the free-energy gradients.1-8 Methods to calculate free-energy differences between two states (conformations) A and B fall into two classes, equilibrium methods and, developed more recently, non-equilibrium methods. A recent review can be found in Ref. 6. The equilibrium approaches such as the thermodynamic integration (TI) method require more computing resources because they are based on “full” sampling of the equilibrium ensembles involved in a given biophysical process. The non-equilibrium approaches exploit the stochastic dynamics of the system driven with some applied forces and aim to map out the free-energy landscape in terms of the potential of mean force (PMF).9 The free-energy difference between States A and B is extracted from the measurements of work along the transition paths connecting the two states. In Ref.10, a non-equilibrium PMF type of approach has been developed on the basis of the Brownian dynamics fluctuation-dissipation theorem (BD-FDT)11, extracting the equilibrium free-energy differences from the non-equilibrium, irreversible work measurements in steered molecular dynamics (SMD) simulations 12-19. The precision and efficiency of the BD-FDT approach have been demonstrated with the coil-helix transition of the deca-alanine peptide. Preliminary results have been obtained for water10 and glycerol transport20 through aquaglyceroporin GlpF.
In this paper, we further the BD-FDT study to three types of systems of fundamental biological importance: hydration of methane and sodium and potassium ions21-25, binding of benzene in the L99A mutant of T4-lysozyme (T4L)26-32, and water transport through aquaglyceroporin embedded in a cell membrane20, 33-41. In each case, we perform SMD simulations to sample five (or ten) forward pulling paths and the same number of reverse paths. With these small sets of pulling paths sampled, we use the BD-FDT to compute the free-energy landscapes between States A and B. In the case of hydration free-energies, we are able to reproduce accurately the well-accepted results in the literature, obtained with sophisticated methods incorporating various correction terms. In the case of binding benzene to T4L, the BD-FDT result for the absolute binding energy is in agreement with the experimental data and with other computational studies in the literature. In the case of water permeation through GlpF, the BD-FDT results give a complete map of the free-energy landscape along the entire channel length and are consistent with the existing studies based on the equilibrium sampling approaches.
The rest of the paper is organized as follows: In Section II, we outline the theoretical formulation. In Section III, we compute the hydration free-energies for methane, sodium ion, and potassium ion. In Section IV, we compute the absolute binding free-energy of benzene to T4L, a unique representative of the ligand-protein complexes. In Section V, we extend our preliminary study in Ref. 10 to give an accurate free-energy profile of water along the entire channel of GlpF. In Section VI, we present the details of the system setup and simulation procedures. In Section VII, we give a brief summary and some discussions on the applicability and limitations of the BD-FDT approach.
II. Theoretical formulation
In an SMD study 12, 19, we pull (steer) a group of atoms with appropriate forces so that they go along a desired direction to explore a certain manifold of the system's phase space. In the current literature, the steering is mostly accomplished by pulling the centre-of-mass of the steered group with a spring (elasticity constant k) whose other end is advanced along a specified direction (taken as along the z-axis in this paper) at a constant speed v. Pulling the system from State A to State B, the following amount of work is done to the system (excluding the spring):
| (1) |
Here the pulling control parameter λF(t) = vt . is the set of the coordinates of all the atoms of a given system. z(x) is the z-coordinate of the centre-of-mass of the pulled molecule/group of atoms that is a linear function of x . Along a reverse path when the system is pulled from State B back to State A, the work done to the system WB→A is a similarly defined force-displacement integral,
| (2) |
where λR(t) = −vt . Note that the mechanical work defined in Eq. (1) or (2) is not identical to the thermodynamic work often used in the literature.9
We assume each of the systems of our interest is governed by the Brownian dynamics. Therefore, we employ the BD-FDT11 to extract the equilibrium free energy from the irreversible work measurements. In terms of mechanical work, the BD-FDT relates the equilibrium free-energy difference to the non-equilibrium work as follows:
| (3) |
Here ΔG = GB −GA is the difference between the free energies of States A and B. β = 1/kBT with kB and T being the Boltzmann constant and the absolute temperature respectively. The statistical average over the forward paths is
| (4) |
where the index p indicates the p-th of the NF forward paths from State A to State B. The statistical average over NR reverse paths, from State B to State A, is
| (5) |
In order to improve the statistics, we use an infinitely stiff spring in the SMD simulations. In the limit of infinite stiffness, k → ∞, the pulling is accomplished by fixing the centre-of-mass coordinate of the pulled molecule, z(x), to the control parameter λF(R) (t) at each time step. In this limit, dz = vdt and the pulling force then is equal to the net force on the pulled molecule exerted by the rest of the entire system, namely,
| (6) |
Here H0(x) is the Hamiltonian of the entire system in the absence of the pulling force. Then the mechanical work done to the system along a forward (reverse) path can be expressed as
| (7) |
Note that the work in Eq. (7) is stochastic in nature as the system is subject to random forces of the Brownian dynamics. In following three sections, Eq. (3) will be used in conjunction with Eq. (7) to compute the free-energy differences between various relevant states.
III. Hydration of methane and cations
Needless to say, hydration free energy is fundamentally relevant to biological systems as all biochemical processes happen in aqueous environment.42 In this section we employ the BD-FDT to compute the hydration free energy of methane (CH4), sodium cation (Na+), and potassium (K+) cation that have been very well studied with the equilibrium approaches in the literature.21-24 We consider a system consisting of a molecule (CH4, Na+, or K+) to be hydrated and a body of water occupying the upper half space (z > 0) in the Cartesian coordinates. We simulate the hydration process by pulling the molecule into (forward path) and out of (reverse path) the body of water. We measure the mechanic work along each pulling path and convert the work measurements into the free-energy differences using Eq. (3). Details of the system setup and simulation procedures are presented in Section VI.A.
We define State A as the state of the system when the molecule is outside the body of water (zA = −14.6Å for CH4 and zA = −10Å for Na+ or K+) and State B as when the molecule is inside the body of water (zB = 15.4Å for CH4 and zB = 10Å for Na+ or K+). Then the hydration free energy of a molecule can be split into two parts:
| (8) |
where G∞ is the free energy of the system when the molecule is separated at an infinite distance from the body of water, z = −∞ . We use Eq. (3) in conjunction with Eq. (7) to determine GB –GA and we use the following analytical approximation for GA –G∞.
From z = −∞ to zA, the molecule to be hydrated is well outside the range of van der Waals interaction with the waters. For the Coulomb interaction, when the molecule is charged, we can well approximate the body of water as a continuous medium (dielectric constant ε) occupying the upper half space (z ≥ 0). Moving the molecule to be hydrated at an infinitely (reversibly) slow speed from −∞ to zA, we analytically carry out the force-displacement integral and obtain the following result:
| (9) |
where ε0 is the vacuum dielectric constant. q is the net charge carried by the molecule to be hydrated. For methane, q = 0 and, for sodium/potassium cation, q = +e. Taking the water dielectric constant as ε = 80εo, we have for sodium/potassium cation, GA −G∞ = −8.1 kcal/mol, and for methane, GA −G∞ = 0, of course. Now we will have the total hydration free energy [Eq.(8)] once we determine GB −GA through Eq.(3). For the purpose of determining GB −GA, we conduct SMD simulations for methane first and then for cations.
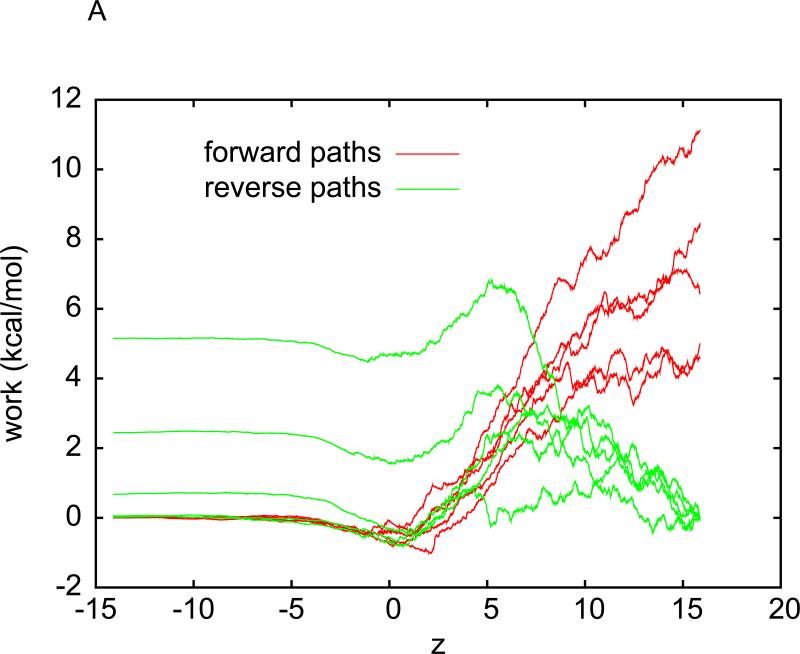
Plotted in Fig. 1(A) is a representative one of the five sets of pulling paths sampled between States A and B without intermediate stops for equilibration. Each set consists of the work curves along five forward paths (pulling methane into water) and five reverse paths (pulling methane out of water). From Fig. 1(A), we observe that the pulling at a speed of v = 0.05Å / ps is irreversible on the basis of the following details. The work WA→z = WA→B(z) is over a partial path of pulling from zA to z . The work WB→z = WB→A(z) is over a partial path of pulling from zB to z . Then work over a partial path from z to zA is Wz→A = WB→A(z). It is clear from Fig.1(A) that WA→z + Wz→A ≠ 0. It would be zero if the pulling were reversible.
Fig. 1.
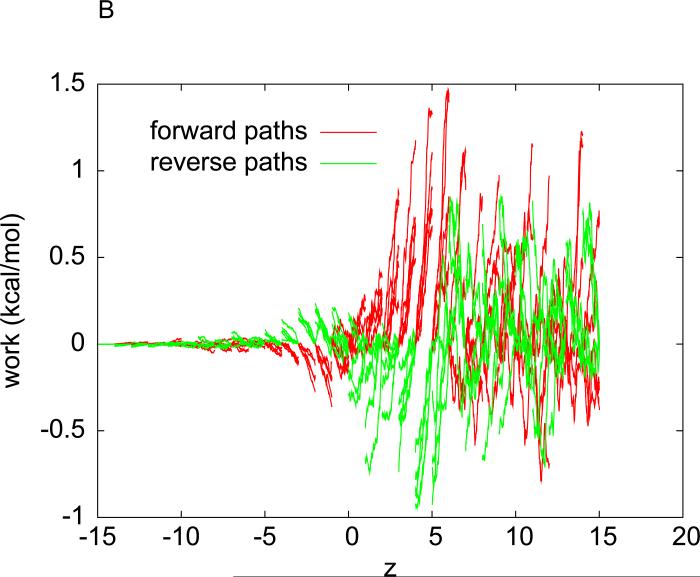
(A) Work done along the forward (red) and reverse (green) pulling paths. For forward paths, the work value, , is what is done to the system when the center of WA→B(z), is what is done to the system when the center of mass of methane is pulled from zA = −14.6Å to z . For reverse paths, the work value, WB→A(z), is what is done to the system when the center of mass of methane is pulled from ZB = 15.4Å to z . The pulling speed is 0.05Å / ps . The pulling is clearly irreversible because WA→B(zB)+WB→A(zA) ≠ 0. (B) The interval (−15Å,15Å) is divided into 30 equal sub-intervals of 1Å each. Over each sub-interval, five forward and five reverse pulling paths are sampled. Work measurements are done along the forward paths (red) and along the reverse paths (green) in each sub-interval.
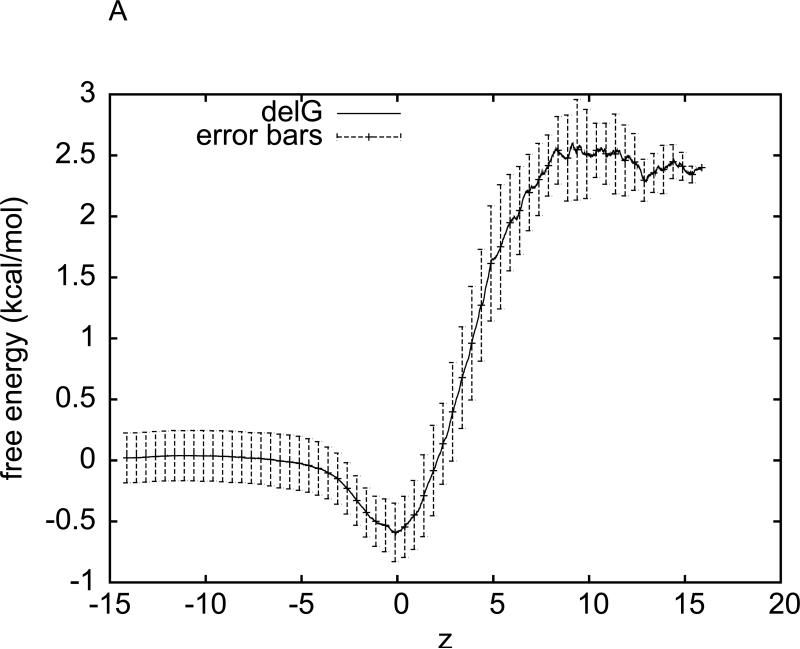
For the purpose of accurately determining the hydration free energy of methane, we have sampled five sets of pulling paths. Each set consists of five forward and five reverse paths. We apply Eq. (3) to each set to obtain a set of data for the free energy of the methane-water system as a function of the z-coordinate of methane's centre of mass. We perform statistical average over the five sets of data for the free energy profiles and compute the root mean square deviations from the average as the error bars. The average free energy and the error bars are plotted in Fig. 2(A). In this manner, the hydration free energy of methane is determined to be ΔGhydr = 2.4 ± 0.2 kcal/mol on the basis of CHARMM 27 force fields. This result is in perfect agreement with Shirts et al's value of 2.44±0.02 from their extremely precise free energy calculation 22 employing the thermodynamic integration method, an equilibrium approach. It also well agrees with Henin and Chipot's result of calculation with the adaptive biasing force (ABF) method 21, another equilibrium approach.
Fig. 2.
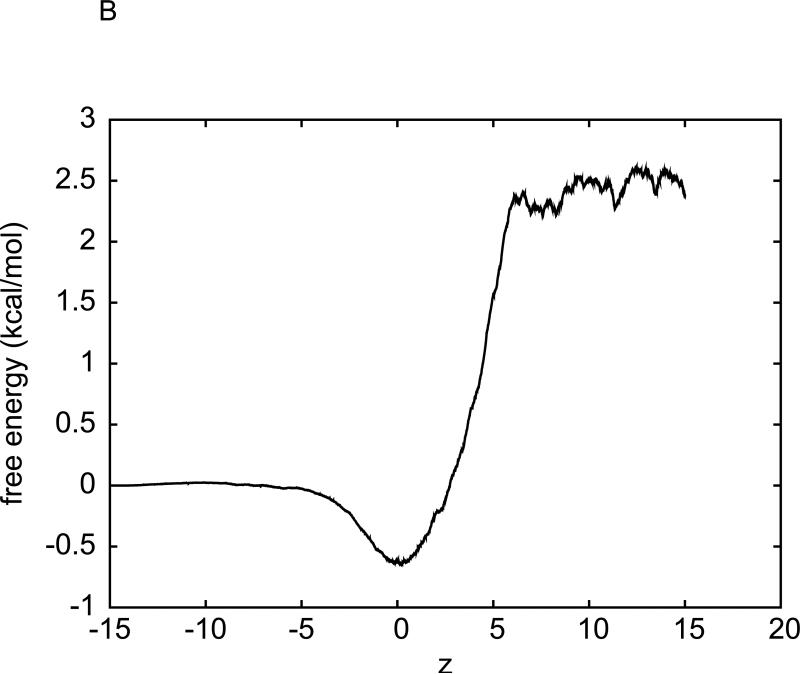
Free energy of the water-methane system as a function of methane's position (z-coordinate, in Å), obtained through two implementations of SMD with BD-FDT. (A) The free energy curve is the average over five sets of data. The error bars are the corresponding root mean square deviations from the average. Each set of the free-energy data is obtained through the BD-FDT from five forward and five reverse pulling paths over the entire interval (−14.6Å,15.4Å). (B) The interval (−15Å,15Å) is divided into 30 equal sub-intervals of 1Å each. Five forward and five reverse pulling paths are sampled to produce the free-energy differences in each sub-interval. The free-energy differences are patched together to give the overall free-energy profile.
For the hydration of methane, we have carried out another implementation of Eq. (3). Instead of sampling pulling paths over the entire interval (zA, zB), we divide the 30 Å interval into 30 equal sub-intervals of 1 Å each. Over each sub-interval, we sample five forward paths and five reverse paths with the two end states being equilibrated after every forward/reverse path sampling. The work measurements along the forward and reverse paths over the sub-intervals are plotted in Fig. 1(B). Eq. (3) is applied to each sub-interval for one segment of the free-energy profile. The overall free-energy profile obtained in this multi-segment implementation is shown in Fig. 2(B). The hydration free energy of methane is again determined to be ΔGhydr = 2.4±0.2 kcal/mol. Here the error bar is estimated from the fluctuations of the free energy in the region where it should be flat. Note that the multi-segment implementation is more efficient/accurate because it does not disturb the system as much as the single-segment implementation. It keeps the system closer to the equilibrium as equilibration is done at both ends of each sub-interval. In the rest of this paper, we adopt the multi-segment implementation for the hydration of the Na+ and K+ ions, for the binding free-energy of benzene to T4L, and for the transport of water through GlpF.
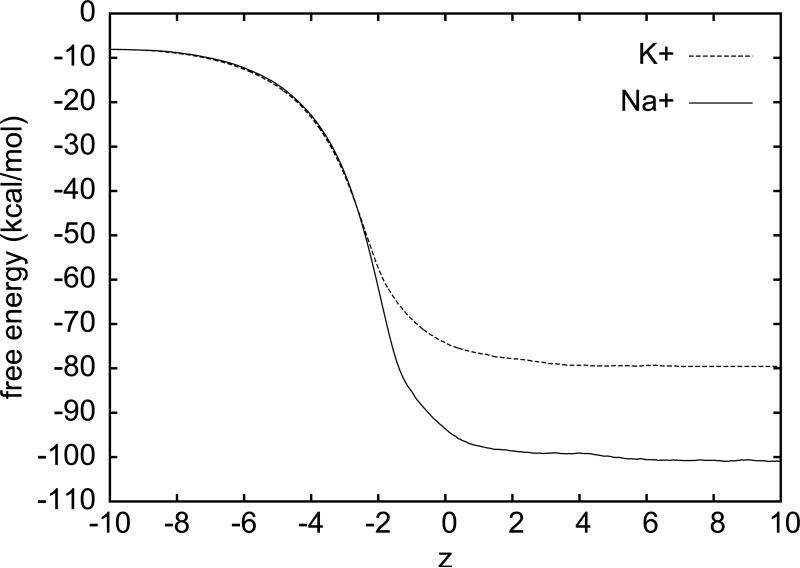
For the cation hydration, we note again that, in State A, the cation (Na+ or K+) is at zA = −10Åand, in State B, zB=10Å. We further note that the water-vacuum interface is the xy-plane (z = 0). Considering that a cation can disturb the body of water over a long range, we divide the 20Å separation between A and B into 20 segments of 1Å each. We perform SMD over each segment to sample five forward and five reverse paths. Using Eq. (3), we compute the free energy landscape over each segment. The overall free energy landscape is given Fig. 3. Sampling only five forward and five reverse pulling paths, we are able to accurately determine the free energy landscapes of the cation-water systems. In fact, the hydration energy of sodium cation so determined, -100.3kcal/mol (with an estimated error ±1kcal/mol), is perfect agreement with Warren and Patel's carefully corrected result of −100.72 kcal/mol.23 The potassium hydration energy of −79.9 kcal/mol obtained here with the BD-FDT also perfectly agrees with Warren and Patel's result of −79.66kcal/mol. 23 Note that Warren and Patel's approach is based on the equilibrium TI method while our SMD study is nonequilibrium in nature. In both Warren and Patel's and our studies, the cation hydration free energies include the full contribution from crossing the “air-liquid” interface.
Fig. 3.
The free energy landscape of the sodium cation (solid) and that of the potassium cation (dashed). The zero point of the free energy is set to when the cation is infinitely far from the body of water, z = −∞.
IV. Ligand-protein binding free-energy
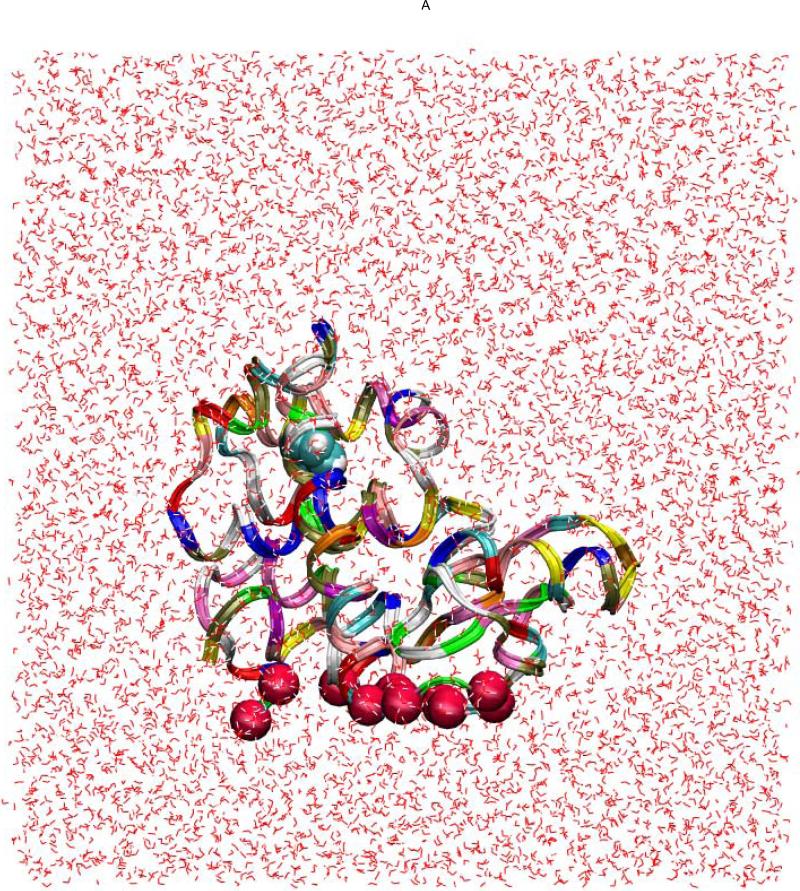
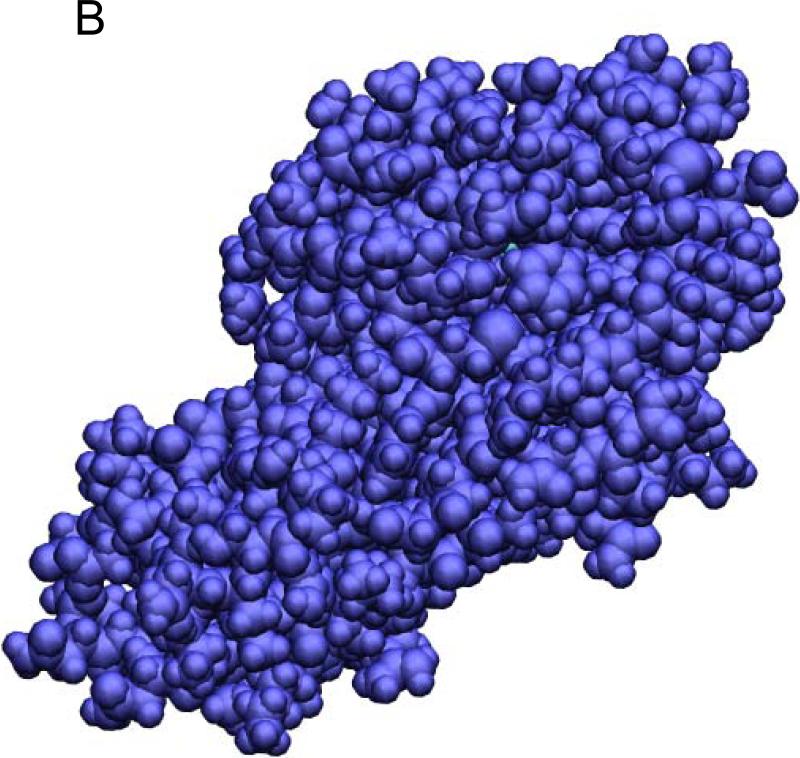
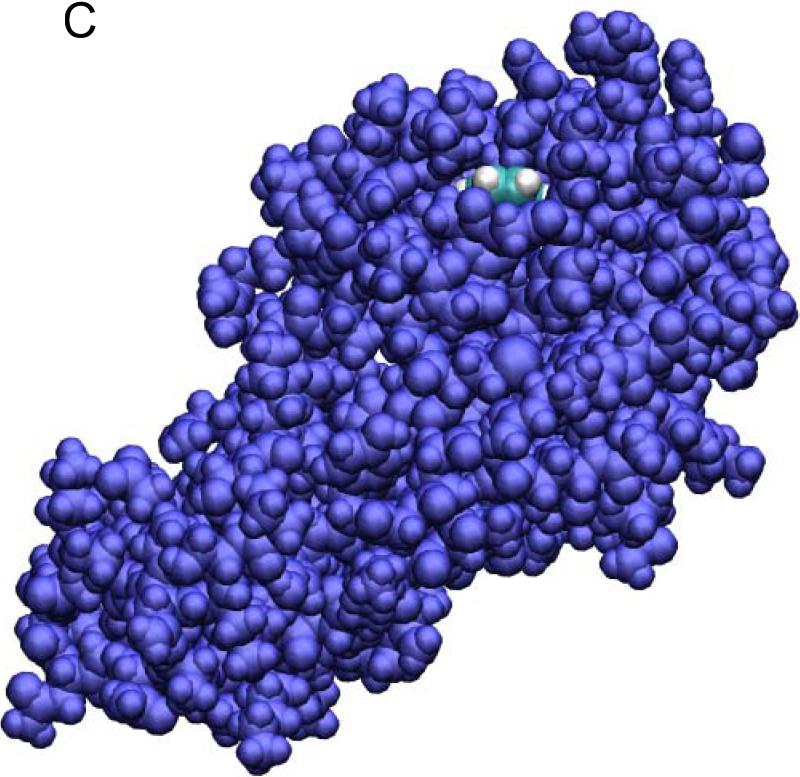
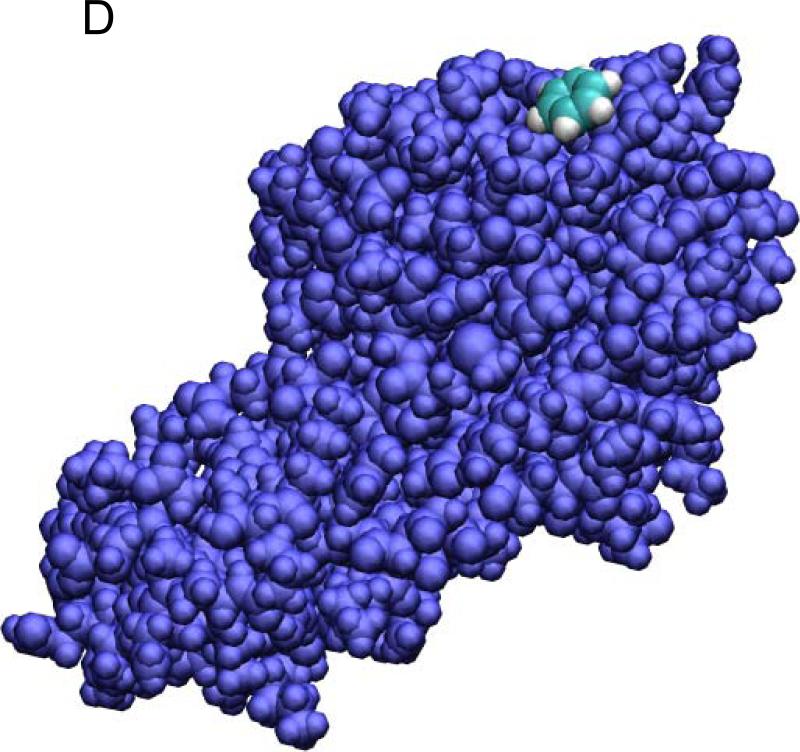
Ligand-protein binding is another biophysical problem of fundamental importance.7, 43-45 In this section, we explore the free-energy landscape between the dissociated state (State B) and the bound state (State A) of the benzene-T4L complex in solution. Binding of a ligand to a protein can be adhesion to the protein surface or a shallow hole on the protein surface, and it can be deep burial inside a cavity of the protein. The benzene-T4L system belongs to the latter case. In fact, the benzene molecule is completely buried inside the protein (Fig. 4). This system represents a very severe test for the accuracy of the BD-FDT, Eq. (3). Even though the binding free-energy is only a function of state and independent of the paths to follow from State A to State B, it is believed that the PMF type of approach is not applicable to systems like benzene-T4L that has no obvious preferred binding pathways connecting the bound and dissociated states 7. In another word, the PMF type of approach, if successful, will not only reveal the statistical differences between the dissociated and bound states in terms of binding free energy but also map out the free-energy landscape along the entire transition path from the dissociated to the bound state. Indeed, for the benzene-T4L system, the BD-FDT approach does accurately predict the binding free energy and yield the free-energy landscape between the bound and the dissociated states.
Fig. 4.
The benzene-T4L system in the bound state (A, B), the transition state (B), and the dissociated state (D). Shown in (A) are the waters (red lines), the benzene (in VDW representation), and the protein (in ribbon representation). The red spheres indicate the alpha-carbons of the bottom part of the protein that are fixed during the SMD simulations. Note that the z-axis is vertically up in (A) but no so in (B) to (D) where the views are rotated to better illustrate the relative positions of benzene (carbon in blue and hydrogen in white) and the protein (purple) both in VDW representations. All drawings were rendered with VMD.51
We conduct SMD12, 19 simulations of the benzene-T4L complex. Details of the system setup and simulation procedures are presented in Section VI.B. In our simulations, one degree of freedom, the z-coordinate of benzene's centre of mass, is steered (constrained to follow the control parameter) while the other 14 degrees of freedom of benzene are unconstrained but governed by the Brownian dynamics, subject to interactions with the protein, the ions, and the waters. Therefore benzene is allowed to sample around the most probable path (MPP) connecting its bound and dissociated states. Each point on the MPP corresponds to a minimum of the free energy under the constraint of its centre-of-mass z-coordinate being fixed to the control parameter λF(R)(t) as defined in Section II.
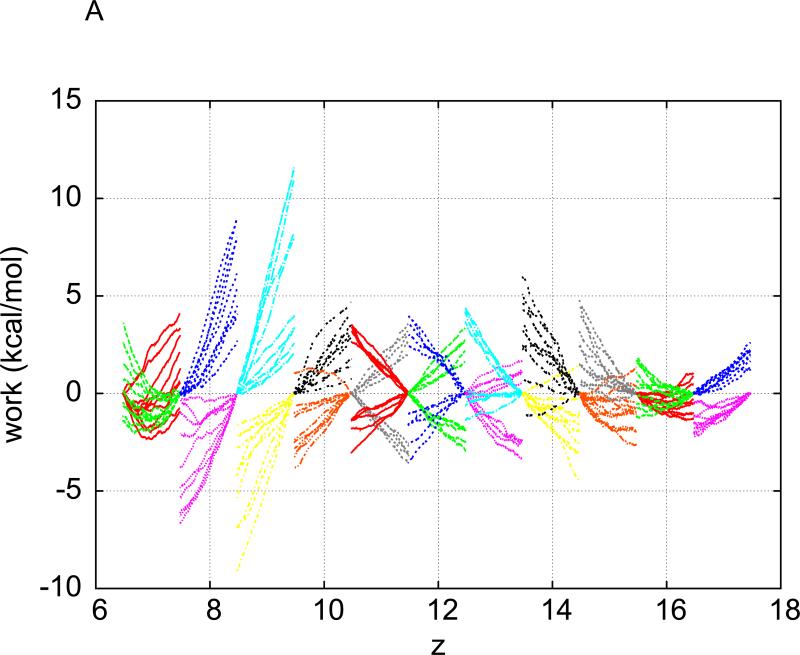
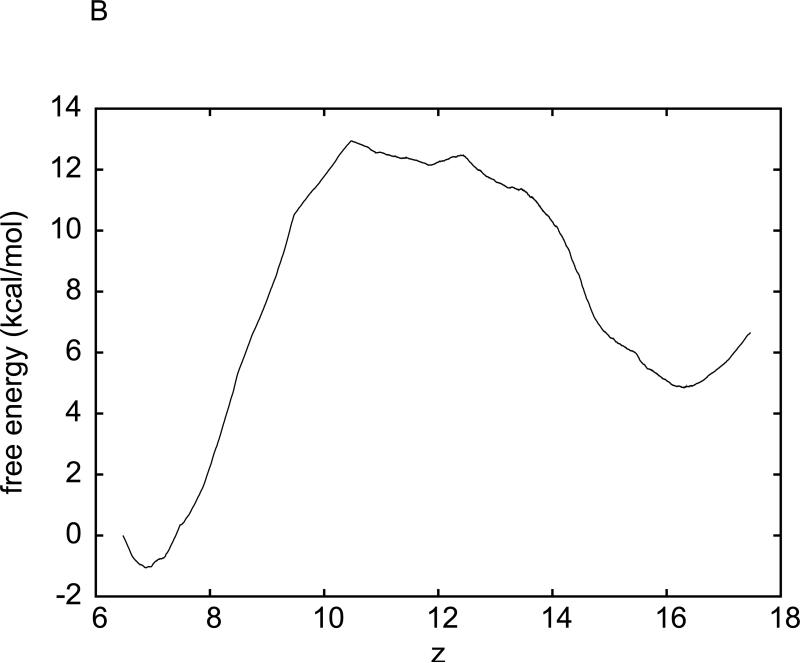
In order to avoid causing too drastic distortions to the protein, we again divide the separation between the bound and the dissociated states into multiple segments of 1Å each. Over each segment, we sample ten forward (away from the binding site) paths and ten reverse (back towards the binging site) paths. These pulling paths are shown in Fig. 5(A). Then we use Eq.(3) to estimate the free energy differences in each segment. The overall free energy landscape is shown in Fig. 5(B). The prediction of this BD-FDT approach, an absolute binding free energy of −5.7 kcal/mol, compares well with the experimental measurement of −5.19 kcal/mol. 7 It is also consistent with Deng and Roux's result of −5.96kcal/mol that is based on the free energy perturbation (FEP) method, an equilibrium molecular dynamics (MD) approach.
Fig. 5.
(A) Work done along the forward (spreading out towards right) and reverse (spreading out towards left) pulling paths. For forward paths, the work value, WA→B(z), is what is done to the system when the centre of mass of benzene is pulled from the left end of a section to z . For reverse paths, the work value, WB→A(z), is what is done to the system when the centre of mass of benzene is pulled from the right end of the same section to z . The pulling (at 0.01Å / ps) is irreversible because WA→z +Wz→A ≠ 0. (B) Free energy profile estimated with the BD-FDT.
In Ref. 7, Deng and Roux point out that conducting all-atom FEP/MD free energy simulations for an entire protein-solvent system with periodic boundary conditions is often prohibitively expensive. Their simulations were performed on reduced atomic systems using the spherical solvent boundary potential for bulk solvent and the generalized solvent boundary potential for the binding site. All the atomic details near the ligand are simulated explicitly, while the influence of the rest of the system is incorporated implicitly via a mean-field continuum electrostatic approximation. In contrast, our current study uses a non-equilibrium approach. All-atom SMD simulations are conducted to estimate the free energy through the BD-FDT. For the estimate to be accurate, the pulling paths sampled have to include or be close to the most probable path. Therefore, the pulling speed cannot be too high to cause too drastic distortion of the protein. The scheme of multiple segments is preferable because equilibrations at the end points of each segment bring the protein back to its equilibrium under the constraints. One advantage of BD-FDT is that the forward and reverse paths play symmetrical roles in numerator and denominator of Eq. (3). As long as the dissipative work is symmetrical along the forward and reverse paths, it cancels itself out, making the estimates of the free-energy difference between two states approximately path-independent.
V. Water permeation through GlpF
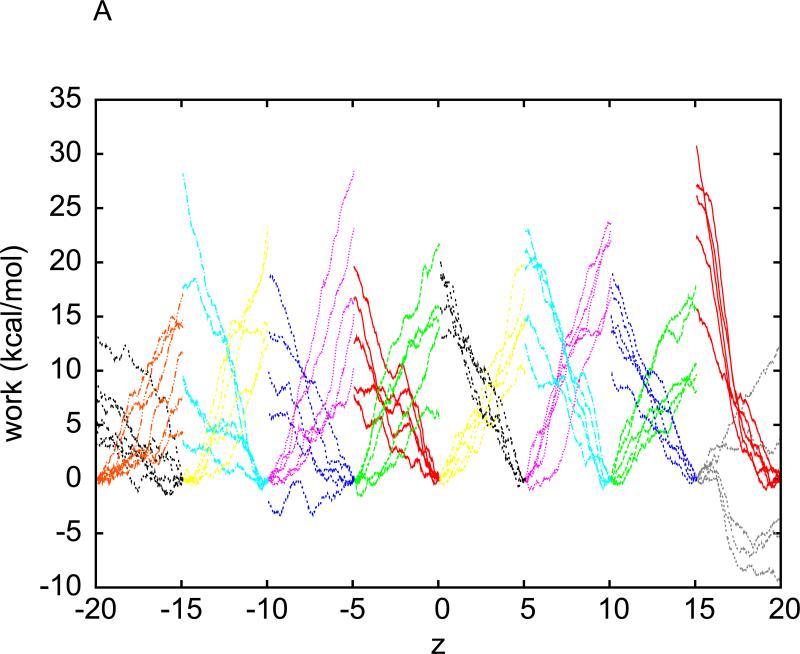
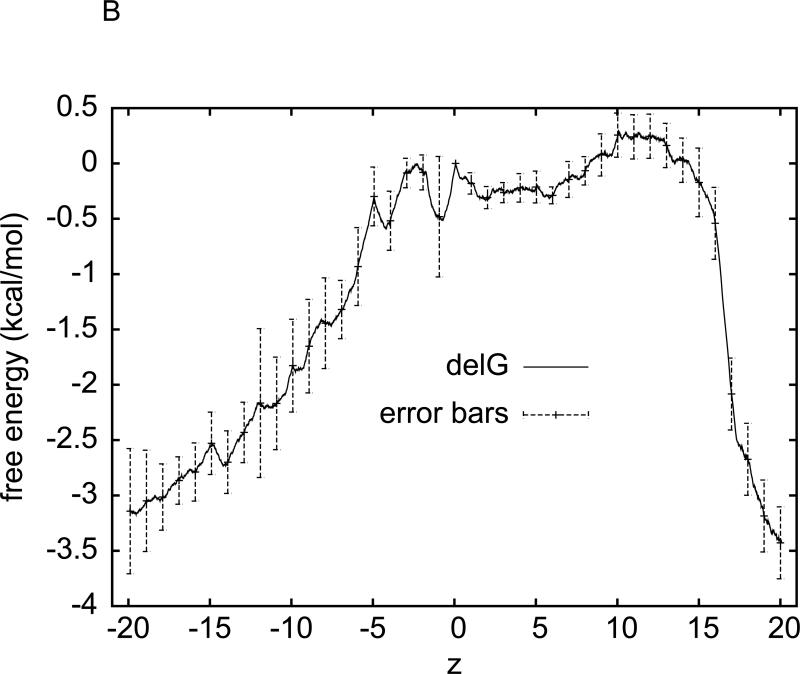
In this section, we extend our preliminary study10 of water permeation through aquaglyceroporin GlpF, conducting more extensive SMD simulations to determine the free-energy landscape throughout the entire permeation channels. We set up the model system as described in Section VI.C. Then we perform SMD simulations to pull four waters through the four channels of GlpF simultaneously, one water molecule through each of them. We divide the 40Å length of the whole channel into eight segments of 5Å each. Over each of the eight segments, two sets of pulling paths are sampled: Each set has five forward paths (in the direction pointing from periplasm to cytoplasm) and five reverse paths (in the direction pointing from cytoplasm to periplasm). One of the two sets of the pulling paths is plotted in Fig. 6(A). Following the same argument given in Section III, we observe that the pulling is irreversible.
Fig. 6.
(A) Work done along the forward (spreading out towards right) and reverse (spreading out towards left) pulling paths. The work is averaged over the four waters pulled through the four channels simultaneously. For forward paths, the work value, WA→B(z), is what is done to the system when the centre of mass of a water molecule is pulled from the left end of a section to z . For reverse paths, the work value, WB→A(z) , is what is done to the system when the centre of mass of a water molecule is pulled from the right end of the same section to z . The pulling (at 0.05Å / ps) is irreversible because WA→z +Wz→A ≠ 0. (B) Free energy profile estimated using the Brownian Dynamics FDT and the corresponding error bars. The midpoint between the Nδ atoms of Asn-68 and Asn-203 of the NPA motifs is located at z = 7.7Å . The SF is located around z = 0 and the NPA is around z = 7.7Å .
We apply the BD-FDT to each set of the five forward and five reverse paths and obtain a set of free-energy differences over each of the eight segments. The overall free-energy landscape is shown in Fig. 6(B). The average free energy is the statistical mean between the two sets of data and the error bars represent the deviations between them. It gives a complete map of the entire channel of water permeation. The free-energy profile and the PMF barrier so obtained from our non-equilibrium SMD simulations are in agreement with de Groot et al's computational study35, 41, 46 based on the equilibrium approaches. These results are also consistent with the experimental data in the literature.34
It is interesting to note that water permeation through the channels of GlpF is collective diffusion. Multiple water molecules form single files inside each pore and permeate through a channel in a concerted manner. In our in silico experiments, only one water per channel is pulled. Yet our non-equilibrium SMD study is actually in full agreement with the equilibrium simulations35, 41, 46 of the highly correlated diffusion of multiple water molecules. It indicates that the path averages in the numerator and the denominator of BD-FDT [Eq. (3)] cancel out the irreversible, non-equilibrium factors (the dissipative work terms in particular) in a very efficient manner even for a small number of pulling paths sampled.
VI. System setup and simulation procedures
A. Hydration of methane and cations
Our model system consists of a 60Å×60Å×60Å cube of TIP3 waters plus a “molecule” (methane, sodium ion, or potassium ion) to be hydrated. The water cube is placed on the xy-plane between 0 < z < 60Å , and periodically replicated on the x- and y-dimensions. Namely, we use periodic boundary conditions along the x- and y-dimensions. Namely, we use periodic boundary conditions along the x- and y-axes but not along the z-axis. A reflective boundary is placed at z=0 for waters only (not for the molecule to be hydrated) so that all waters remain above the xy-plane. A small constant force field along the negative z-axis is applied to waters to keep the body of water within a well-defined layer at z ≥ 0. This small constant force field (5×10⁻⁵ kcal/mol · amu· Å) mimics the gravity that exerts a constant force on every atom of the water molecules in proportion to its mass. The molecule to be hydrated is initially placed at (0, 0, zA). From there it will be pulled to (xB, yB, zB) inside the body of water in SMD simulations, noting that xB and yB are not fixed but determined by the stochastic dynamics of the system while zB is fixed for a given system. The intra- and inter- molecular interactions are represented by the CHARMM 27 force field.47 The cut-off for long-range interactions is set to 14 Å with a switching distance of 12 Å. The SMD simulations are implemented with the NAMD 2.648 source code adapted for pulling with an infinitely stiff spring. The damping constant is chosen to be γ = 5 / ps . The temperature is set to be T = 300K . The pulling speed v = 0.05Å / ps and the time step is 1fs. Particle Mesh Ewald (PME) is not applied in this case. Note that it is crucial to take into account long-range electrostatics. 49, 50 Patel et al applied PME and included the corrections necessitated by PME, which are on the order of −20 kcal/mol. In the present work, we consider the long-range part of the ion-water interactions by the analytical integration in Eq. (9), approximating the body of water as a continuous medium. Therefore, our results should and do compare well with Patel et al's data.
For the hydration of methane, we implemented two versions of the SMD pulling experiments. In the first implementation, we pull methane from zA directly to zB without intermediate stops for equilibration. In the second implementation, we divide the pulling from zA to zB into multiple segments. We pull methane forward and backward over each segment with equilibrations done at both ends of the segment. We find that the multi-segment implementation is more efficient/accurate because the system stays closer to its equilibrium under the constraint. We perform only the multi-segment pulling experiments for the four other systems studied in this work.
B. Benezene-T4L
We start with the crystallographic structure of the benzene-T4L complex (PDB code: 181L) 26 and solvate it in a box of TIP3 waters and neutralize it with sodium and chlorine ions. The dimensions of the solvated system are 67Å×61Å×65Å after equilibration under constant temperature (300 K) and constant pressure (1 bar). We use the CHARMM 27 force field47 for intra- and inter-molecular interactions. We use NAMD 2.648 for the stochastic dynamics simulations with the damping constant chosen as 5/ps. The temperature is kept at 300K and pressure at 1 bar. We use periodic boundary conditions for all three dimensions and employ PME for electrostatic interactions. The time step is 2 fs for short-range interactions and 4 fs for long-range forces. The covalent bonds of all hydrogen atoms are fixed to their equilibrium length. The cut-off for long-range interactions is set to 10 Å with a switching distance of 9 Å . We divide the separation between the bound state (Fig. 4B) and the dissociated state (Fig. 4D) into 11 segments of 1 Å each. Over each segment, SMD12, 19 simulations are performed, pulling the centre of mass of benzene away from (noted as forward) and back to (noted as reverse) the binding site. The pulling speed is 0.01 Å / ps . The alpha carbons of T4L's bottom part (Fig. 4(A)) are fixed during the SMD simulations.
In the bound state, benzene is completely buried inside the protein, as shown in Fig. 4(A and B). Pulling benzene out of its binding site will inevitably cause distortions to the protein. In order to not drive the system too far out of equilibrium, we sample ten forward paths and ten reverse paths over each of the 11 segments in the following manner: Holding the z-coordinate of benzene's center of mass (z) constant at the left end of a segment, we run equilibrium MD for a period of time τ chosen to the pulling time over one segment (100 ps). From there, we pull z in the z-direction (away from the binding site) from the left end to the right end of the segment, sampling a forward path. Then, holding z constant at the right end, we run equilibrium MD for a period of time τ . After the equilibrium run at the right end, we pull z in the negative z-direction (toward the binding site) back to the left end of the segment, sampling a reverse path. We repeat this process five times over every segment and advance, segment by segment, from the first segment starting from the bound state, all the way to dissociated state at the right end of the last segment, sampling five forward and five reverse paths over all segments. From the dissociated state at the right end of the last segment, we repeat the whole procedure in the reverse order, sampling five reverse paths by pulling in the negative z-direction and five forward paths by pulling in the positive z-direction over each and all segments. These ten pulling paths, shown in Fig. 5(A), are then used in Eq.(3) to estimate the free energy profiles in each of the 11 segments, leading to the overall free energy landscape shown in Fig. 5(B).
C. Water permeation through GlpF
Our model system of aquaglyceroporin GlpF has been fully described in Ref. 10. Briefly, GlpF possesses a homotetrameric structure: Each monomer forms an independently functional pore (channel). Each channel is approximately 40 Å in length across the membrane modeled by a lipid bilayer. In this work, the z–axis of the Cartesian coordinates is chosen to be normal to the water-membrane interface, pointing from periplasm to cytoplasm. The origin of the coordinates is set so that z = 7.7Å at the midpoint between the N-termini of Asn 68 and Asn 203. The pressure and the temperature are maintained at 1 bar and 300 K respectively. The Langevin damping coefficient is chosen to be 5 ps . The periodic boundary conditions are applied all three dimensions. The PME is utilized to compute electrostatic interactions. The cut-off for long-range interactions is set to 14 Å with a switching distance of 12 Å . The time step of 1 fs is used for short-range interactions and 4 fs for long-range forces. Covalent bonds of all hydrogen atoms are fixed to their equilibrium length. The pulling speed is v = 0.05Å / ps .
Starting from the fully equilibrated structure of Ref.10, we perform SMD simulations to pull four waters through the four channels of GlpF simultaneously, one water molecule through each of them. We divide the 40Å length of the whole channel into eight segments of 5Å each. Over each of the eight segments, two sets of pulling paths are sampled: Each set has five forward paths (from periplasm to cytoplasm) and five reverse paths (from cytoplasm to periplasm). One of the two sets of the pulling paths is plotted in Fig. 6(A).
VII. Summary and discussion
In summary, we have furthered the BD-FDT approach and explored the free-energy landscapes of three very different types of biological systems. Sampling five to ten forward and reverse pulling paths, we were able to accurately determine the free-energy profiles of the systems from the irreversible work measurements in SMD simulations. The accuracy of the BD-FDT method has been demonstrated by the nearly perfect agreement with the existing experimental and/or computational results in the literature for hydration of methane and cations and for benzene-T4L absolute binding energy. This BD-FDT study also has produced an accurate map of the free-energy landscape along the entire channel of GlpF for water permeation, again in agreement with the current literature based on the equilibrium MD approaches.
Finally, the accuracy/efficiency of the BD-FDT approach relies on the cancellation of the non-equilibrium factors between the numerator and the denominator of Eq. (3). When a sufficient number of sufficiently good pulling paths are sampled, the nonequilibrium factors, the dissipative parts of the work measurements, can be nearly symmetrical between the forward paths and the reverse paths. Then they cancel out in the BD-FDT to give an accurate estimate of the free-energy differences between the equilibrium states. Even though the BD-FDT, in its analytical form, is exactly valid for any nonequilibrium pulling process, its numerical implementation, on the basis of a small number of pulling paths, requires keeping system close to its equilibrium under the driven constraint for better accuracy. In another word, the pulling paths sampled need to include or be close to the MPP, noting that each point on the MPP represents a local minimum of the free energy of the system under the constraint. If all of the pulling paths sampled are far away from the MPP in a given SMD study, such a numerical implementation of the BD-FDT will fail. However, considering the successes with the three systems studied in this paper, it is reasonable to expect that future applications of the BD-FDT will produce accurate free-energy landscapes of many more chemical and biophysical processes.
Acknowledgments
The author thanks Gudong Hu for assistance in obtaining some of the data contained in Fig. 2(A) and Fig. 6(B). He acknowledges support from an NIH SC3 grant (GM084834) and the Texas Advanced Computing Center.
References
- 1.Meirovitch H, Cheluvaraja S, White RP. Current Protein & Peptide Science. 2009;10:229–243. doi: 10.2174/138920309788452209. [DOI] [PMC free article] [PubMed] [Google Scholar]
- 2.Michel J, Essex JW. Journal of Computer-Aided Molecular Design. 2010;24:639–658. doi: 10.1007/s10822-010-9363-3. [DOI] [PubMed] [Google Scholar]
- 3.Steinbrecher T, Labahn A. Current Medicinal Chemistry. 17:767–785. doi: 10.2174/092986710790514453. [DOI] [PubMed] [Google Scholar]
- 4.Ytreberg FM, Swendsen RH, Zuckerman DM. The Journal of Chemical Physics. 2006;125:184114–184111. doi: 10.1063/1.2378907. [DOI] [PubMed] [Google Scholar]
- 5.Gilson MK, Zhou HX. Annual Review of Biophysics and Biomolecular Structure. 2007;36:21–42. doi: 10.1146/annurev.biophys.36.040306.132550. [DOI] [PubMed] [Google Scholar]
- 6.Cossins BP, Foucher S, Edge CM, Essex JW. Journal of Physical Chemistry B. 2009;113:5508–5519. doi: 10.1021/jp803532z. [DOI] [PubMed] [Google Scholar]
- 7.Deng YQ, Roux B. Journal of Physical Chemistry B. 2009;113:2234–2246. doi: 10.1021/jp807701h. [DOI] [PMC free article] [PubMed] [Google Scholar]
- 8.Huang L, Makarov DE. The Journal of Chemical Physics. 2006;124:064108–064109. doi: 10.1063/1.2166397. [DOI] [PubMed] [Google Scholar]
- 9.Hummer G, Szabo A. Proceedings of the National Academy of Sciences of the United States of America. 2001;98:3658–3661. doi: 10.1073/pnas.071034098. [DOI] [PMC free article] [PubMed] [Google Scholar]
- 10.Chen LY, Bastien DA, Espejel HE. Physical Chemistry Chemical Physics. 2010;12:6579–6582. doi: 10.1039/b926889h. [DOI] [PMC free article] [PubMed] [Google Scholar]
- 11.Chen LY. The Journal of Chemical Physics. 2008;129:144113–144114. doi: 10.1063/1.2992153. [DOI] [PMC free article] [PubMed] [Google Scholar]
- 12.Isralewitz B, Baudry J, Gullingsrud J, Kosztin D, Schulten K. Journal of Molecular Graphics and Modelling. 2001;19:13–25. doi: 10.1016/s1093-3263(00)00133-9. [DOI] [PubMed] [Google Scholar]
- 13.Itsuo H, et al. Journal of Physics: Condensed Matter. 2008;20:255238. [Google Scholar]
- 14.Burendahl S, Danciulescu C, Nilsson L. Proteins-Structure Function and Bioinformatics. 2009;77:842–856. doi: 10.1002/prot.22503. [DOI] [PubMed] [Google Scholar]
- 15.Mascayano C, Nunez G, Acevedo W, Rezende MC. Journal of Molecular Modeling. 2010;16:1039–1045. doi: 10.1007/s00894-009-0616-9. [DOI] [PubMed] [Google Scholar]
- 16.Parravicini C, Abbracchio MP, Fantucci P, Ranghino G. Bmc Structural Biology. 2010;10 doi: 10.1186/1472-6807-10-8. [DOI] [PMC free article] [PubMed] [Google Scholar]
- 17.Strzelecki J, Mikulska K, Lekka M, Kulik A, Balter A, Nowak W. Acta Physica Polonica A. 2009;116:S156–S159. [Google Scholar]
- 18.Yang LJ, Zou J, Xie HZ, Li LL, Wei YQ, Yang SY. PLoS ONE. 2009;4 doi: 10.1371/journal.pone.0008470. [DOI] [PMC free article] [PubMed] [Google Scholar]
- 19.Park S, Schulten K. The Journal of Chemical Physics. 2004;120:5946–5961. doi: 10.1063/1.1651473. [DOI] [PubMed] [Google Scholar]
- 20.Chen LY. Biophysical Chemistry. 2010;151:178–180. doi: 10.1016/j.bpc.2010.05.014. [DOI] [PMC free article] [PubMed] [Google Scholar]
- 21.Henin J, Chipot C. The Journal of Chemical Physics. 2004;121:2904–2914. doi: 10.1063/1.1773132. [DOI] [PubMed] [Google Scholar]
- 22.Shirts MR, Pitera JW, Swope WC, Pande VS. Journal of Chemical Physics. 2003;119:5740–5761. [Google Scholar]
- 23.Warren GL, Patel S. Journal of Chemical Physics. 2007;127 doi: 10.1063/1.2771550. [DOI] [PubMed] [Google Scholar]
- 24.Kastenholz MA, Hunenberger PH. Journal of Chemical Physics. 2006;124 doi: 10.1063/1.2172593. [DOI] [PubMed] [Google Scholar]
- 25.Mobley DL, Bayly CI, Cooper MD, Shirts MR, Dill KA. Journal of Chemical Theory and Computation. 2009;5:350–358. doi: 10.1021/ct800409d. [DOI] [PMC free article] [PubMed] [Google Scholar]
- 26.Morton A, Baase WA, Matthews BW. Biochemistry. 1995;34:8564. doi: 10.1021/bi00027a006. [DOI] [PubMed] [Google Scholar]
- 27.Wei BQ, Baase WA, Weaver LH, Matthews BW, Shoichet BK. J. Mol. Biol. 2002;322:339. doi: 10.1016/s0022-2836(02)00777-5. [DOI] [PubMed] [Google Scholar]
- 28.Morton A, Matthews BW. Biochemistry. 1995;34:8576. doi: 10.1021/bi00027a007. [DOI] [PubMed] [Google Scholar]
- 29.Hermans J, Wang L. J. Am. Chem. Soc. 1997;119:2707. [Google Scholar]
- 30.Mann G, Hermans J. J. Mol. Biol. 2000;302:979. doi: 10.1006/jmbi.2000.4064. [DOI] [PubMed] [Google Scholar]
- 31.Deng Y, Roux B. J. Chem. Theory Comput. 2006;2:1255. doi: 10.1021/ct060037v. [DOI] [PubMed] [Google Scholar]
- 32.Mobley DL, Chodera JD, Dill KA. J. Chem. Phys. 2006;125:084902. doi: 10.1063/1.2221683. [DOI] [PMC free article] [PubMed] [Google Scholar]
- 33.Agre P, Bonhivers M, Borgnia MJ. Journal of Biological Chemistry. 1998;273:14659–14662. doi: 10.1074/jbc.273.24.14659. [DOI] [PubMed] [Google Scholar]
- 34.Borgnia M, Nielsen S, Engel A, Agre P. Annual Review of Biochemistry. 1999;68:425–458. doi: 10.1146/annurev.biochem.68.1.425. [DOI] [PubMed] [Google Scholar]
- 35.de Groot BL, Grubmuller H. Science. 2001;294:2353–2357. doi: 10.1126/science.1066115. [DOI] [PubMed] [Google Scholar]
- 36.Heller KBL, E. C. C., Wilson T. Hastings Journal of Bacteriology. 1980;144:5. [Google Scholar]
- 37.Hénin J, Tajkhorshid E, Schulten K, Chipot C. Biophysical Journal. 2008;94:832–839. doi: 10.1529/biophysj.107.115105. [DOI] [PMC free article] [PubMed] [Google Scholar]
- 38.Stroud RM, Miercke LJW, O'Connell J, Khademi S, Lee JK, Remis J, Harries W, Robles Y, Akhavan D. Current Opinion in Structural Biology. 2003;13:424–431. doi: 10.1016/s0959-440x(03)00114-3. [DOI] [PubMed] [Google Scholar]
- 39.Stroud RMN, Peter, Miercke Larry Advances in Protein Chemistry. 2003;63:26. doi: 10.1016/s0065-3233(03)63011-1. [DOI] [PubMed] [Google Scholar]
- 40.Tajkhorshid E, Nollert P, Jensen MO, Miercke LJW, O'Connell J, Stroud RM, Schulten K. Science. 2002;296:525–530. doi: 10.1126/science.1067778. [DOI] [PubMed] [Google Scholar]
- 41.Hub JS, De Groot BL. Proceedings of the National Academy of Sciences of the United States of America. 2008;105:1198–1203. doi: 10.1073/pnas.0707662104. [DOI] [PMC free article] [PubMed] [Google Scholar]
- 42.Mancera RL. Current Opinion in Drug Discovery & Development. 2007;10:275–280. [PubMed] [Google Scholar]
- 43.Mobley DL, Dill KA. Structure. 2009;17:489–498. doi: 10.1016/j.str.2009.02.010. [DOI] [PMC free article] [PubMed] [Google Scholar]
- 44.Michel J, Essex JW. Journal of Computer-Aided Molecular Design. 24:639–658. doi: 10.1007/s10822-010-9363-3. [DOI] [PubMed] [Google Scholar]
- 45.Cossins BP, Foucher S, Edge CA, Essex JW. Journal of Physical Chemistry B. 2008;112:14985–14992. doi: 10.1021/jp803533w. [DOI] [PubMed] [Google Scholar]
- 46.Aponte-Santamaria C, Hub JS, de Groot BL. Physical Chemistry Chemical Physics. 2010;12:10246–10254. doi: 10.1039/c004384m. [DOI] [PubMed] [Google Scholar]
- 47.MacKerell AD, Bashford D, Bellott, Dunbrack RL, Evanseck JD, Field MJ, Fischer S, Gao J, Guo H, Ha S, Joseph-McCarthy D, Kuchnir L, Kuczera K, Lau FTK, Mattos C, Michnick S, Ngo T, Nguyen DT, Prodhom B, Reiher WE, Roux B, Schlenkrich M, Smith JC, Stote R, Straub J, Watanabe M, Wiorkiewicz-Kuczera J, Yin D, Karplus M. The Journal of Physical Chemistry B. 1998;102:3586–3616. doi: 10.1021/jp973084f. [DOI] [PubMed] [Google Scholar]
- 48.Phillips JC, Braun R, Wang W, Gumbart J, Tajkhorshid E, Villa E, Chipot C, Skeel RD, Kalé and L, Schulten K. Journal of Computational Chemistry. 2005;26:1781–1802. doi: 10.1002/jcc.20289. [DOI] [PMC free article] [PubMed] [Google Scholar]
- 49.Bergdorf M, Peter C, Hunenberger PH. Journal of Chemical Physics. 2003;119:9129–9144. [Google Scholar]
- 50.Klauda JB, Wu XW, Pastor RW, Brooks BR. Journal of Physical Chemistry B. 2007;111:4393–4400. doi: 10.1021/jp068767m. [DOI] [PMC free article] [PubMed] [Google Scholar]
- 51.Humphrey W, Dalke A, Schulten K. J. Mol. Graph. 1996;14:33–&. doi: 10.1016/0263-7855(96)00018-5. [DOI] [PubMed] [Google Scholar]


