Abstract
Magnetic resonance imaging (MRI) has been gaining popularity over standard imaging modalities like ultrasound and CT because of its ability to provide excellent soft-tissue contrast. However, due to the working principle of MRI, a number of conventional force sensors are not compatible. One popular solution is to develop a fiber-optic force sensor. However, the measurements along the principal axes of a number of these force sensors are highly cross-coupled. One of the objectives of this paper is to minimize this coupling effect. In addition, this paper describes the design of elastic frame structures that are obtained systematically using topology optimization techniques for maximizing sensor resolution and sensor bandwidth. Through the topology optimization approach, we ensure that the frames are linked from the input to output. The elastic frame structures are then fabricated using polymers materials, such as ABS and Delrin®, as they are ideal materials for use in MRI environment. However, the hysteresis effect seen in the displacement-load graph of plastic materials is known to affect the accuracy. Hence, this paper also proposes modeling and addressing this hysteretic effect using Prandtl-Ishlinskii play operators. Finally, experiments are conducted to evaluate the sensor’s performance, as well as its compatibility in MRI under continuous imaging.
Index Terms: Optical force sensor, magnetic resonance imaging, topology optimization
I. INTRODUCTION
There is an increasing trend in performing robotic surgery and biopsy under some form of image guidance. In recent years, a number of groups have used magnetic resonance imaging (MRI) because MRI provides excellent soft-tissue contrast, 3D images, and for example, whole brain coverage. In addition, MRI does not emit harmful ionizing radiation. Unfortunately, due to its working principle, MRI environment poses many challenges and one of those is the introduction of robotics in the MRI environment with various sensors, actuators, and material choices. The components required to obtain a good MR image consists of: 1) strong magnetic fields (1.5T or 3T), 2) spatial and temporal field gradients, 3) radio frequency pulses, and 4) sensitive signal coils used for detection [1]. Any device developed for use in MRI needs to be appropriately designed to maintain excellent image quality. Ferro-based metals should be avoided if the device is to be placed near the scanner and if it cannot be securely anchored due to prevent “missile effect”. Non-ferro-based metals which can conduct electricity are used with caution as eddy currents can be generated due to the strong switching magnetic field gradients.
Force sensing is an important component for any application that involves contact [2], [3]. In a robotic system for teleoperated image-guided interventions, the force sensor can be used for control purposes, and also for haptic feedback so that surgeons have a better “feel” when teleloperating the slave robot in the MRI bore.
An MRI-compatible force sensor is desired for a manipulator that is currently being designed for breast biopsy (Bx) and radio-frequency ablation (RFA) of breast tumors under continuous MRI [4], [5]. This force sensor will be placed near the surface of the breast, and a needle driver system that is located through the center of the sensor will drive the biopsy needle or radiofrequency ablation (RFA) probe into the breast to the target lesion. As the sensor is located near the breast, the technology used for the sensor must be chosen carefully to prevent image artifacts which degrade the image quality of the target lesion and guiding device.
Researchers have developed a few MRI-safe force sensors. One example of the commercially available force sensors is a piezoresistive based sensor by Sensor Technics, Puchheim, Germany [6]. The sensor is classified as MRI-safe because no force is generated on the sensor when placed in the magnetic field. However, the sensor produces a localized artifact measuring 42 mm [1]. Such a large image artifact can adversely affects the image quality and hence cannot be placed next to the target location.
Researchers have also proposed using optical methods [7]–[13]. Hirose and Yoneda [7] were one of the pioneers in developing fiber-optic force sensor. Tada et al. [8] modified the sensor to make it usable in MRI environment, while Takahashi et al. [9] proposed a 6-axis fiber-optic force sensor. Tada and Kanade [10] and Tokuno [11] proposed using lens to improve the sensing performance. Recently, Puangmali et al. [14]–[16] proposed using a pair of bent-tip optical fibers to detect the displacement. Most of these flexure-based designs are sensitive to moments. In addition, the measurement along the axes of most of these multi-axes sensors are highly coupled and accuracy is affected when forces/moments along different axes are applied. The angle between the emitter/reflector and the receiver is dependent on the forces and moments in more than one axis. Hence, this paper presents a possible design of the force sensor for decoupling the force measurements.
An elastic frame structure is also required for these force sensors. Most present designs of the elastic frame structure are purely based on experience and intuition. Hence, a topology optimization algorithm is used to generate a suitable design for the sensor. The primary goal of using topology optimization algorithm in our prototype is to derive a systematic analytical process to design the fiber-optic based force sensor. It is desired that a software can be programmed based on this systematic approach to aid engineers in designing the elastic frame structures. With this software (with graphical user interface), users need not have background knowledge in topology optimization and are still able to use it. Another objective of using topology optimization is to maximize the input-output displacement gain. Mechanical displacement amplification has several advantages including: 1) better resolution, 2) higher stiffness (lesser movement at the loading point), and 3) larger bandwidth.
In a number of cases, the topology optimization algorithm outputs a design with very thin thickness, which is challenging to fabricate. Hence, a solution is also proposed in this paper for the topology optimization to ensure continuity between the input and output ports on the sensor.
Plastic material is commonly used in the elastic frame structure for MRI-compatibility. However, most plastic materials exhibit hysteretic force-displacement relationship due to the strain energy absorbed during deformation. Hence, the play operator of Prandtl-Ishlinskii is proposed to model this hysteretic effect to improve the sensing accuracy.
In section II, we present the sensor design with its sensing principle. Next, the design of the elastic frame structure using topology optimization is presented in section III and section IV presents the prototype developed. Section V discusses the calibration, which includes accounting for the hysteretic effect. Section VI covers the experimental results and section VII concludes the paper.
II. SENSOR
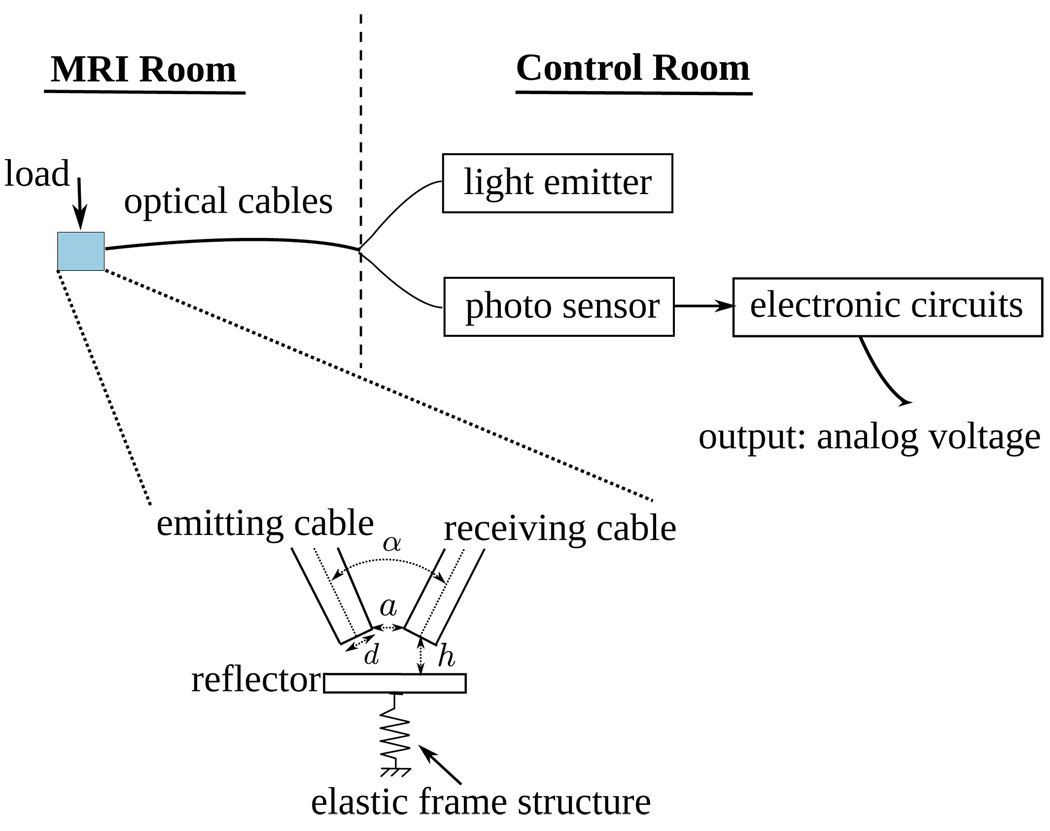
Fig. 1 provides an overview of a typical fiber-optic force sensor. The light source emits light via the optical cable to the force sensor. At the same time, there is an optical cable at the receiving end to transmit the light back into the control room, where all the non-MRI compatible equipment is stored. Electrical wires, which act as antennas and pick up RF signals and corrupt the image quality, are thus eliminated in the MRI room.
Fig. 1.
Overview of a typical MRI-compatible fiber-optic force sensor using reflective intensity as the sensing principle
The fundamental principle to obtain the displacement of the elastic frame structure is by measuring the change in light intensity. There are five general sensing principles to obtain the displacement as summarized by Hirose and Yoneda [7]. The underlying sensing principle that is adopted in this paper is the reflective intensity method proposed by Puangmali et al. [14]–[16]. Similar reflected light intensity measurement have been used by Gassert et al. [17], [18]. This section introduces the adopted sensing principle, followed by the design of the sensor using topology optimization techniques.
A. Sensing Principle
The sensing principle used in our prototype is the reflective intensity principle, which is illustrated in Fig. 1. There is a pair of optical fiber cables with their tip rigidly placed at an angle, α, and a distance, a, apart. The core diameter of the optical cable is d. A reflector, on an elastic frame structure, is placed at a distance, h, away from the optical cables.
Light is generated and transmitted from the control room via the optical fiber cable and projected onto the reflector. The receiving optical cable picks up the reflected light and transmits them back to the control room. The photo sensor senses the light intensity and the opto-electronic circuitry converts the intensity into appropriate voltage signal.
A force on the loading point will cause a deformation in the elastic frame structure, resulting in a displacement in the reflector and a change in the intensity of the reflected light. Hence, by monitoring the reflected light intensity, the force can be computed.
The parameters shown in Fig. 1, especially the angle between the two cables α, greatly influence the sensing fidelity. It has been proven in [14] that the angle α determines the range and sensing sensitivity. A theoretical mathematical model and an in-depth analysis of this sensing technique has been presented by Puangmali et al. [14], [15].
B. Sensor Design
Design specifications
The intended application of this sensor is for a manipulator designed for radiofrequency ablation of tumors under continuous MRI [4], [5]. A needle driver is currently being developed and will be placed through the force sensor. Furthermore, the needle will be continuously tracked as it is advanced towards the target lesion in the breast and hence the force sensor and the needle will be continuously imaged. As the biopsy and RFA procedures will be performed under the guidance of continuous MRI, the MRI bore and breast coil imposes a space contstraint. Due to the space constraint, it is intended that the sensor will be placed near the surface of the breast. Hence, it is desired that there is a space through the middle of the sensor through which the needle driver can be mounted. The desired design specifications are listed as follows:
Measurement axes are decoupled as much as possible,
Maximize input-output displacement amplification,
Include a through space at the center for instruments like a needle driver, and
Attach all the cables onto the same sensor’s face to lower the chances of the cables interfering with the robotic system during motion, and also the chances of the cables being entangled.
Design
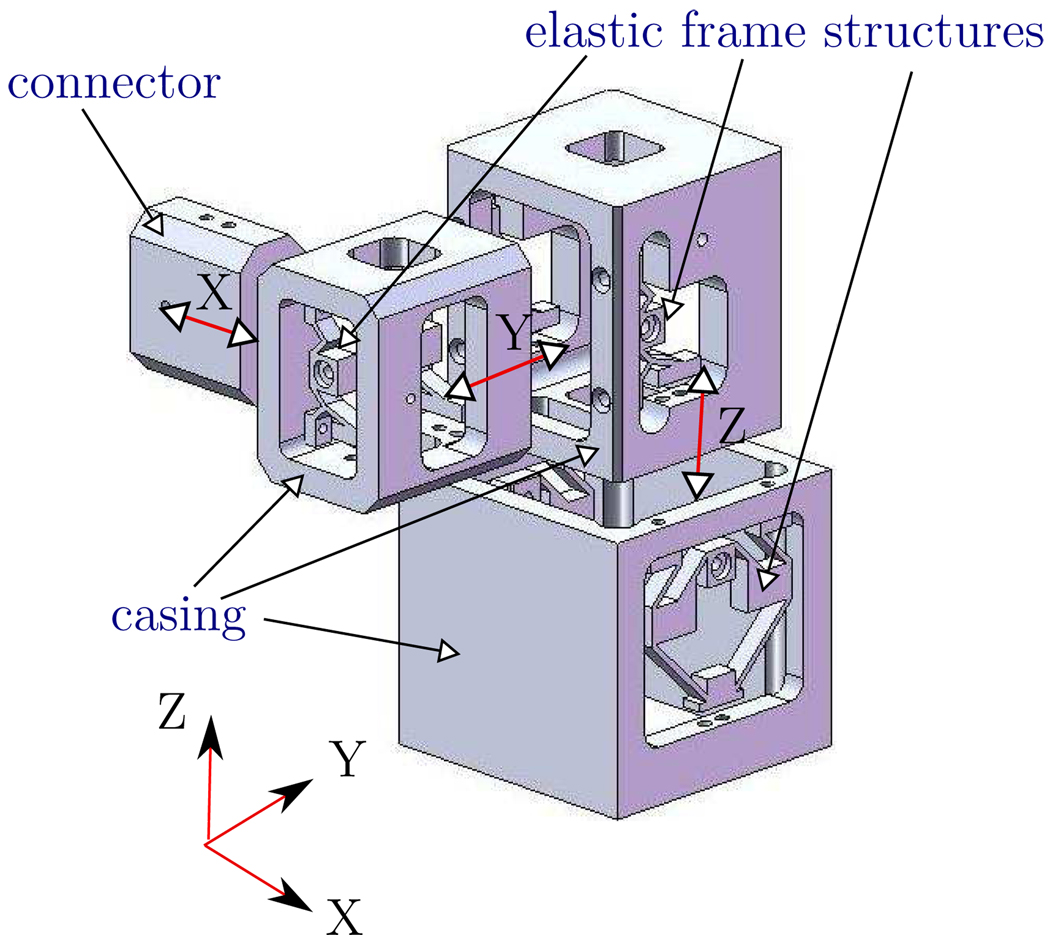
To ensure that the force measurements along the three principal directions are decoupled, it is important to design the sensor geometry that will enable motion along the principal direction of application of force while ensuring that no motion takes places in the other two principal directions. Fig. 2 shows the design of our sensor. It consists of 3 prismatic joints placed along 3 mutually orthogonal axes in series. Two elastic frame structures are attached to each prismatic joint. The purpose of these elastic frame structures are: 1) to provide the spring stiffness, 2) to provide an input-output displacement gain, and 3) to change the direction of displacement to allow all the fiber-optical cables to be connected from the bottom (see design specification above). The design of these elastic frame structures is a challenging task. Hence, a topology optimization method is presented in the next section.
Fig. 2.
Exploded view of the 3-axis MRI-compatible fiber-optic force sensor
III. DESIGN OF ELASTIC FRAME STRUCTURE USING TOPOLOGY OPTIMIZATION
A normal process of developing the elastic frame structure usually starts with the designing of the mechanism, followed by simulations using methods like finite element analysis (FEA) before building the prototype. The initial design phase is often the most challenging and depends greatly on experience and creativity. In this paper, a topology optimization technique for compliant mechanisms based on the methodology in [19] is used to present a systematic way of designing the required mechanisms.
A. Topology Optimization
Topology optimization of compliant mechanisms has been developed over the past 15 years [19]–[23]. A comparative study of the various methods and problems has been presented by Deepak et al. [21].
The resolution of the force sensor is dependent on the output displacement. Given a fixed range of input load to be sensed, the resolution of the force sensor improves as the range of output displacement increases. In addition, it is desired that the stiffness experienced by the input is high, since a high stiffness will result in smaller displacement at the input port, and also larger bandwidth.
A continuum can be approximated using finite element method and the element used in this paper is frames (which are similar to beams, except that axial loads and axial deformations are included) with design variables, x, as the out-of-plane width of each frame. In this paper, x, are initialized to be 2 mm.
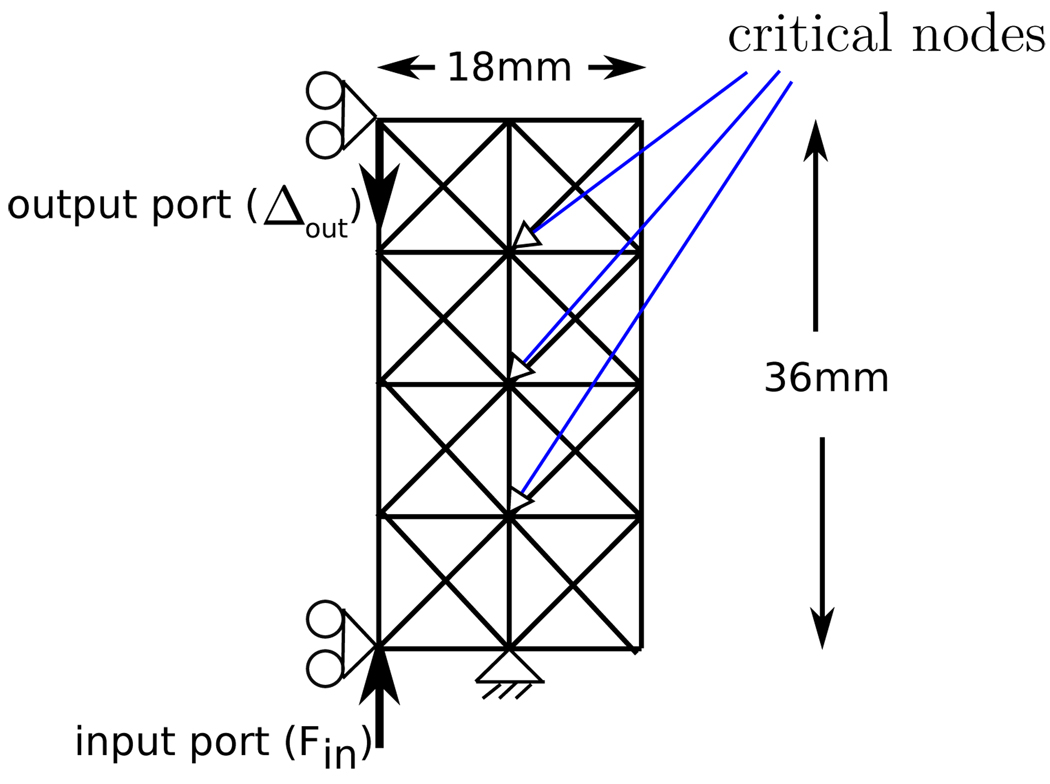
First, consider an arbitrary design domain with known loading and boundary conditions as illustrated in Fig. 3, where Fin is the input force, and Δout is the output displacement. The method used to solve this problem is the unit dummy load method. Hence, the discretized displacement field, U, due to the input force, Fin, is given by:
| (1) |
where F is the input force vector, and K is the structure stiffness matrix. Similarly, the displacement field, V, due to the unit dummy load can be obtained using:
| (2) |
where Fd is the dummy load force vector. The mutual potential energy, MPE is obtained by:
| (3) |
Fig. 3.
Boundary and loading conditions for the first mechanism
Since unit dummy load method is used, the output displacement, Δout can be obtained by:
| (4) |
The output displacement and mutual potential energy has the same numerical value because the dummy load used is 1 N (unit dummy load method). The strain energy, SE, stored can also be computed as:
| (5) |
The objective function proposed by Frecker et al. [24] is used in this paper to maximize the ratio of output and input displacement and is given by:
| (6) |
A design can be obtained by minimizing the objective function (6).
B. Ensuring linkage between input and output
Due to the limitation of manufacturing technology, there is a minimum required thickness of the frame elements for fabrication. In a number of cases, the optimization algorithm tends to produce a design that has very thin frame elements which ultimately breaks the continuity between input and output. Furthermore, some of these extremely thin frame elements are also not practically realizable due to machining constraints.
Approaches like filtered distortion energy approach and restrained local, relative rotation approach have been proposed to obtain a distributed compliant mechanisms for 4 nodes quad elements [20]. In this paper, frame elements are used and the two above-mentioned approaches cannot be applied directly. Hence, a solution to this problem is proposed in paper.
The general idea of the proposed method is to ensure that there are 0, 2, or more frames (with width large enough for fabrication) at the more critical nodes. In this paper, the more crucial nodes are chosen to be the nodes with 8 elements connecting to it. A filter function to differentiate frames that meet the required minimum width, is proposed as:
| (7) |
where xj is the width, P is an arbitrary large number (1012), and C is the minimum thickness needed. C is set to be 2.5 mm for our prototype. This filter function will output a value of 0 for frames whose width is smaller than C and 1 for width greater than C. Any frame’s thickness that is less than C is treated as non-existent during the fabrication of the elastic frame structure.
Next, the following constraint is imposed in the optimization algorithm for all the critical nodes:
| (8) |
where c0 is set to 0.5 and n is the total number of critical nodes. It is not advisable to choose all the nodes as critical nodes as this will significantly increase the number of constraints, in turn affecting the optimization result. Hence, only nodes with 8 elements are chosen as the critical nodes. The purpose of these constraints is to greatly penalize when only 1 frame is attached to the critical node.
C. Design output from the algorithm
In this force sensor, two types of mechanism are required. The first required mechanism is needed to perform motion amplification between the input and output displacement while the second one is needed to use the horizontal input force to realize a vertical displacement.
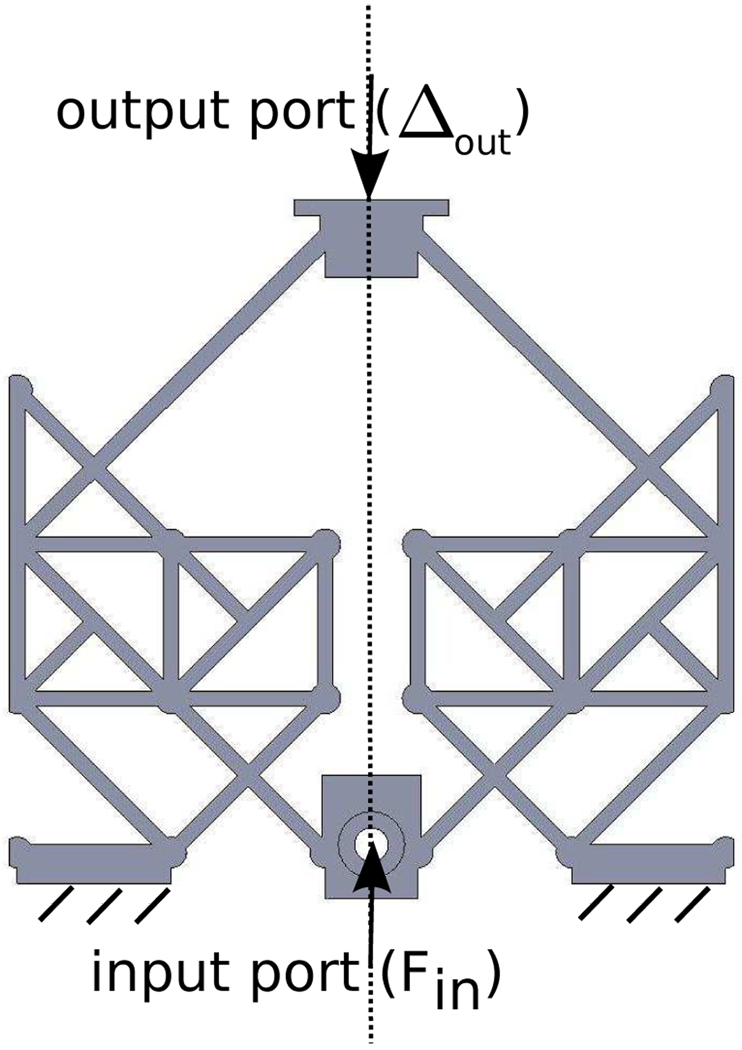
Fig. 3 shows the boundary condition for the first mechanism. It is desired that the vertical input force creates a displacement in the vertical direction. To reduce the number of design variables, symmetry is used and hence only one half of the entire elastic frame structure is considered as shown in Fig. 3. The two nodes on the left boundary are only allowed to slide along the vertical direction as shown in Fig. 3. Using Matlab to solve the first optimization problem, the output design is shown in Fig. 4 based on topology optimization.
Fig. 4.
Mechanism realized from topology optimization algorithm for condition shown in Fig. 3
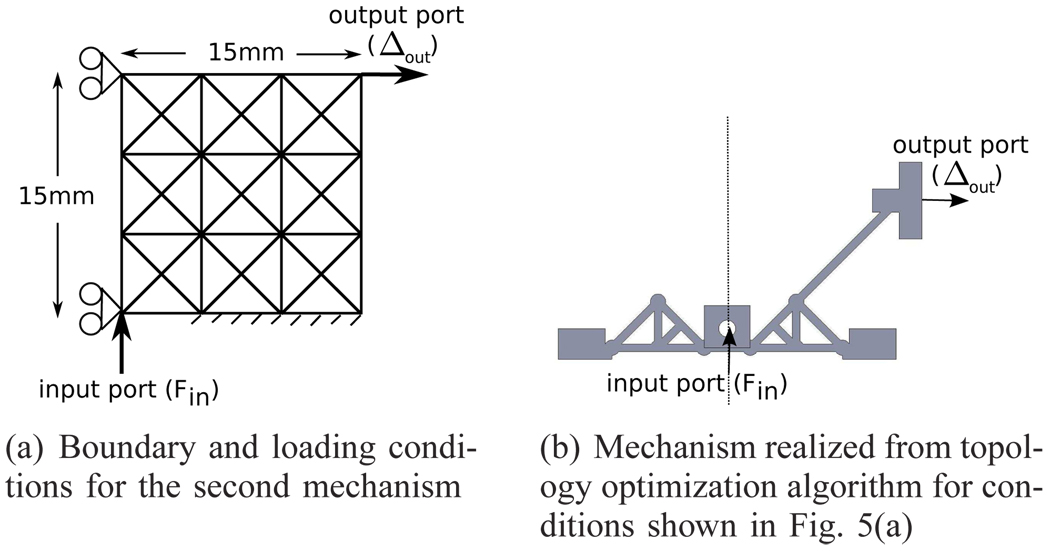
With regards to the second mechanism, it is desired to use the horizontal input force to realize a vertical displacement. Using symmetry, Fig. 5(a) shows the boundary and loading conditions and Fig. 5(b) shows the design output from topology optimization. Although the reflector will rotate when loaded, the amount of rotation is small and the rotation is only about one axis. In addition, this rotation is only dependent on the load along that axis.
Fig. 5.
Boundary conditions and results for the second mechanism
As seen in Fig. 2, the design of the sensor consists of three prismatic joints placed along three mutually orthogonal axes in series. These prismatic joints only have one degree of freedom and they will provide a reaction force if a force is applied in a direction other than the allowable direction of motion of this joint. Hence, maximizing the transverse rigidity is not needed to be taken into account in the optimization problem. Consequently, any moments that are applied about the three mutually orthogonal axes are naturally resisted by the kinematic structure of the mechanism.
D. Modifications
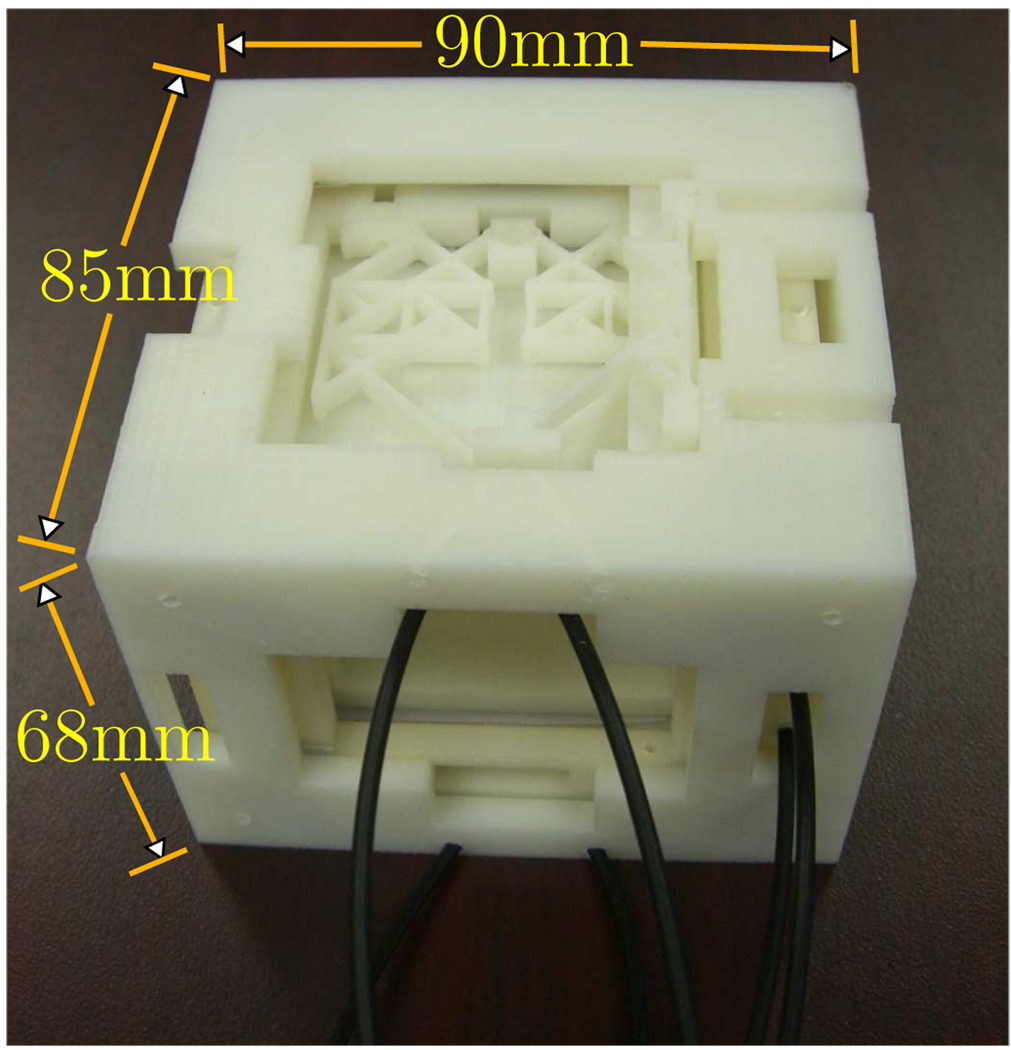
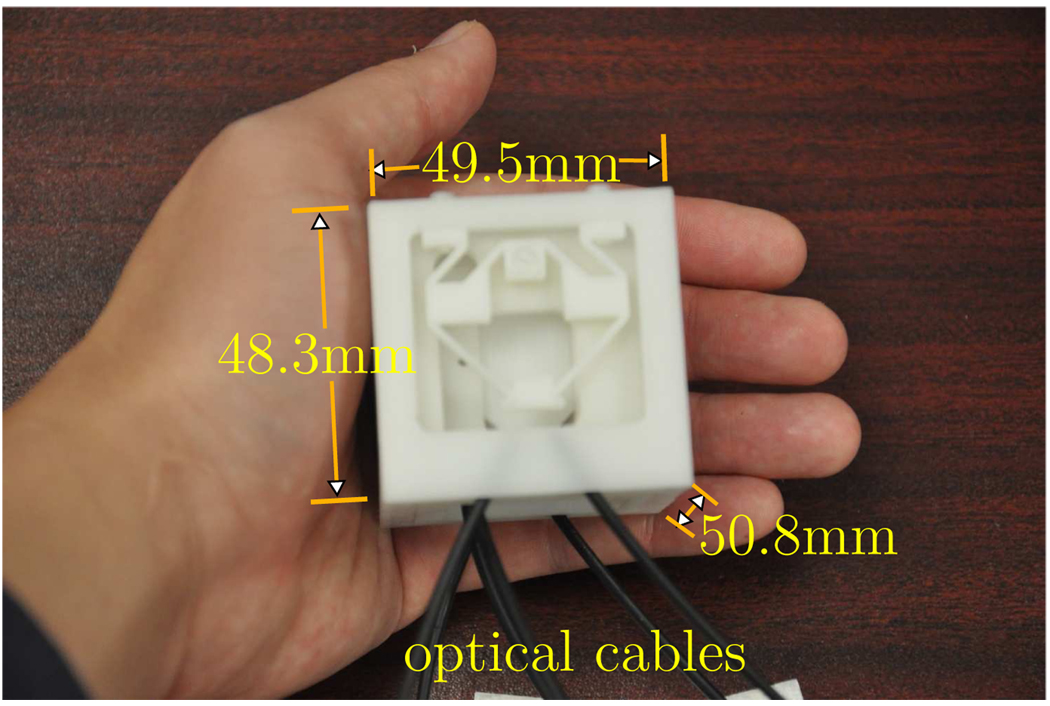
Based on the output designs from the two optimization problems, the first prototype of the 3-DOF force sensor was fabricated [25]. Fig. 6 shows a photo of the force sensor with its dimensions, and table I summmarizes its performance. Since the size of the first prototype is large, it was desired to reduce the volume by about 75% for our target application.
Fig. 6.
First prototype of the 3-DOF MRI compatible force sensor
TABLE I.
EXPERIMENTAL RESULTS
| direction of loading | xRMS-error | yRMS-error | zRMS-error |
|---|---|---|---|
| x-axis | 0.469 | 0.476 | 0.664 |
| y-axis | 0.557 | 0.686 | 0.782 |
| z-axis | 0.295 | 0.233 | 0.486 |
This table summarizes the RMS errors of the first prototype. All the readings are in N.
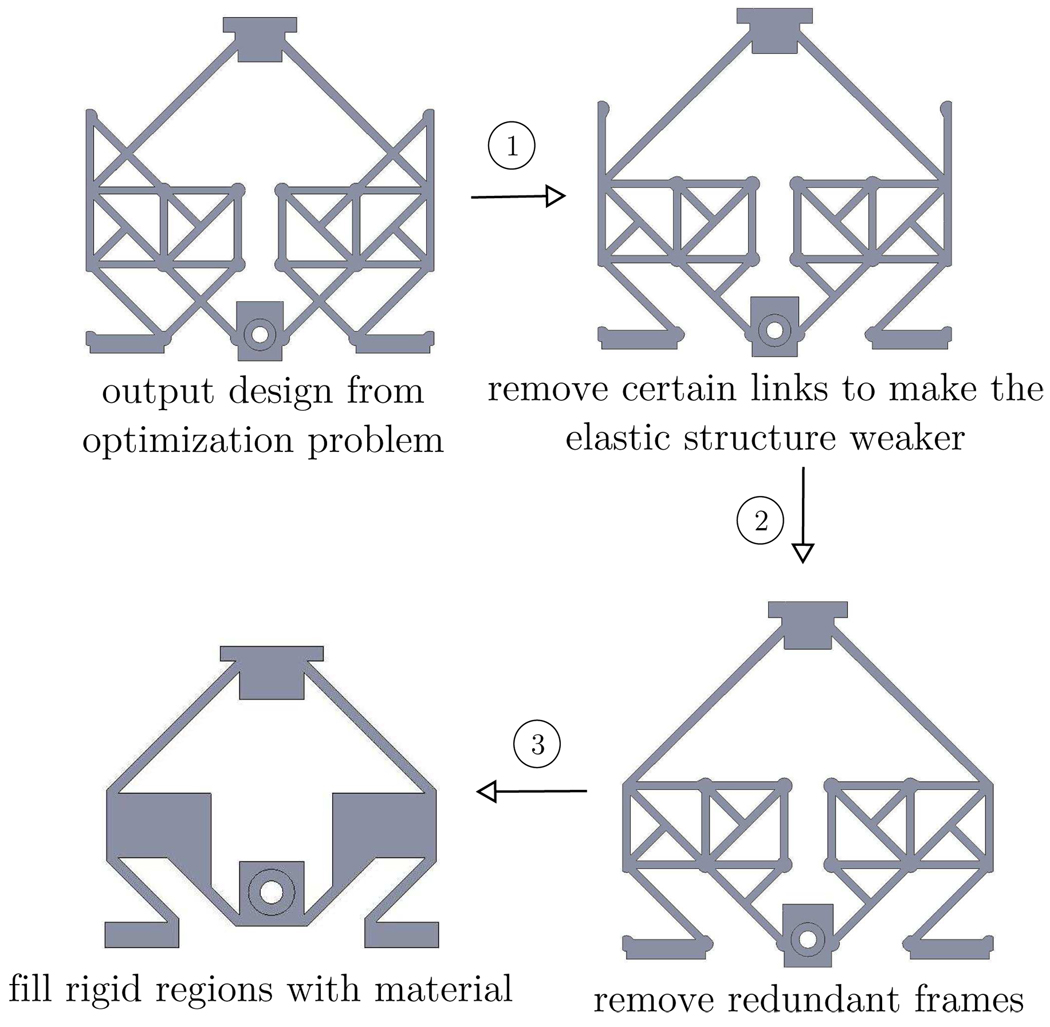
To reduce the size of the force sensor, some modifications to the design of the elastic frame structures have to be made. There are three primary modification steps to achieve size reduction of the sensor:
Remove certain links to weaken the elastic structure as desired,
Remove redundant links, and
Fill up all the rigid regions with material.
As the dimension of the elastic structure is made smaller, the moment acting on the frame elements will decrease significantly. In order to maintain the same output displacement given the same load, some modifications are needed. Hence, the first step is to remove certain links to make the elastic frame structure weaker. This is the only step that requires some knowledge or experience. If the designer has no knowledge or experience in working with flexure mechanisms, the designer should still be able to achieve this step through trial and error and simulating the output. Next, certain frames are redundant and can be removed as they will not affect the elastic frame structure. Finally, all the regions which are supposed to be rigid are filled with material. The reason for these two steps is to reduce the amount of cutting needed (and hence cost) if electrical discharge machining (EDM) is used to fabricate this elastic frame structure from metal.
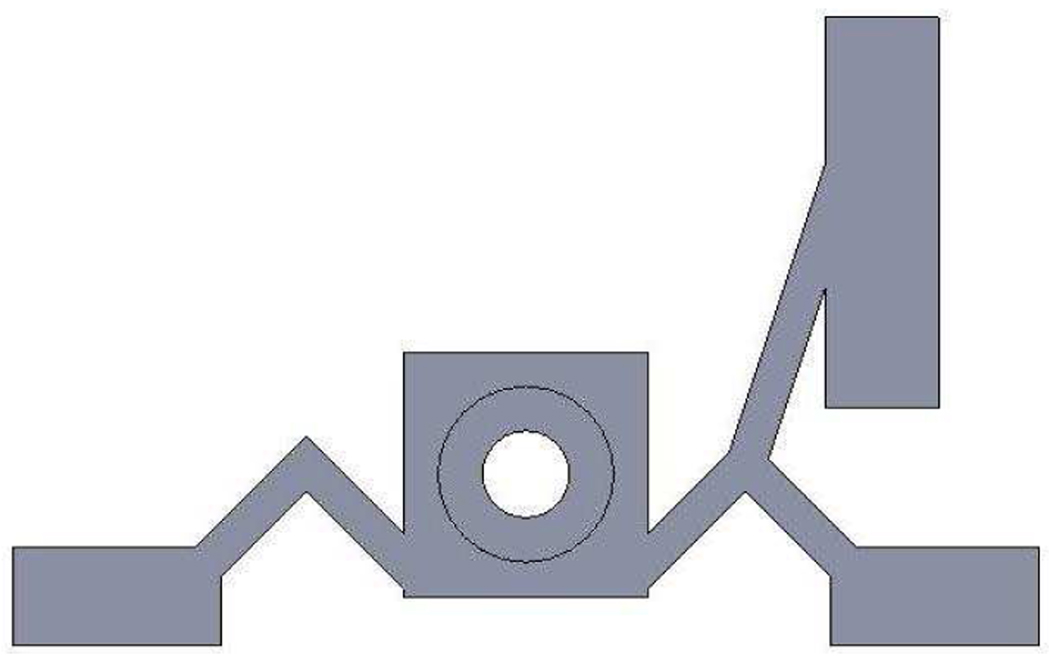
Fig. 7 illustrates the steps to obtain the modified design from the first mechanism realized from the first topology optimization problem. With regards to the second mechanism, only the first step is needed because there is no redundant frame or rigid region to fill. Fig. 8 shows the modified design from Fig. 5(b).
Fig. 7.
Steps to obtain the modified design from the first mechanism realized from the first topology optimization problem
Fig. 8.
Modified design from Fig. 5(b)
IV. PROTOTYPE
Fig. 9 shows a photo of the final prototype of the fiber-optic based MRI compatible 3-DOF force sensor. The casings are fabricated from Delrin® while the elastic frame structures are made from ABS. Delrin® is selected for the casing because of its relative high strength and Young Modulus, while ABS is chosen for the elastic frame structures because of the rapid prototyping (RP) machine used.
Fig. 9.
Final prototype of the 3-DOF MRI compatible fiber-optic force sensor
To save time, cost and allow complexity in the design, the elastic frame structure is built using a rapid prototyping (RP) machine. RP machines can build complicated designs which may be difficult or impossible to realize by conventional machining techniques. In addition, plastic is the preferred material for MRI and it is a challenge to fabricate thin plastic flexure joints using conventional machining. Finally, rapid prototyping machines enable us to build the parts rapidly and are ready for use in 1–2 days.
A fused deposition modeling (FDM) machine, which is classified as solid-based, is used to build the elastic frame structure. The heated head deposits plastic (ABS for this prototype) in a paste-like form layer by layer. The resolution of the FDM machine was 0.245mm. More details about RP machines can be found in [26]. In each layer, the extrusion head deposits the outline of the prototype first. Due to the cohesive forces, all the corners are naturally rounded. This small radius will help to reduce the stress concentration. The radius of the corner do affect the deformation of the elastic frame structure, but the exact value of the radius is not known. Hence, phenomena modeling to model the hysteretic effect using play operators as well as linearize the inherently nonlinear behavior of the sensor is used in this paper and discussed in the following section. As the sensor will be near the surface of the breast, and not inserted into the breast, it may not need to be sterilized to the same level like other surgical tools. We also envision making a single use disposable sensor using EDM at a reasonable cost which is on par with other medical supplies cost in such procedures.
As seen in Fig. 9, all the optical cables are placed on the same face of the force sensor. This will lower the chances of the optical cables obstructing the robotic system when the manipulator is moving, and also the chances of the cables getting entangled. The optical fiber cable selected in this prototype is FU-77 (manufactured by Keyence, NJ, USA), which has a core diameter of 1.13 mm. The photosensor in our prototype is also from Keyence and the model is FS-V31M.
V. CALIBRATION
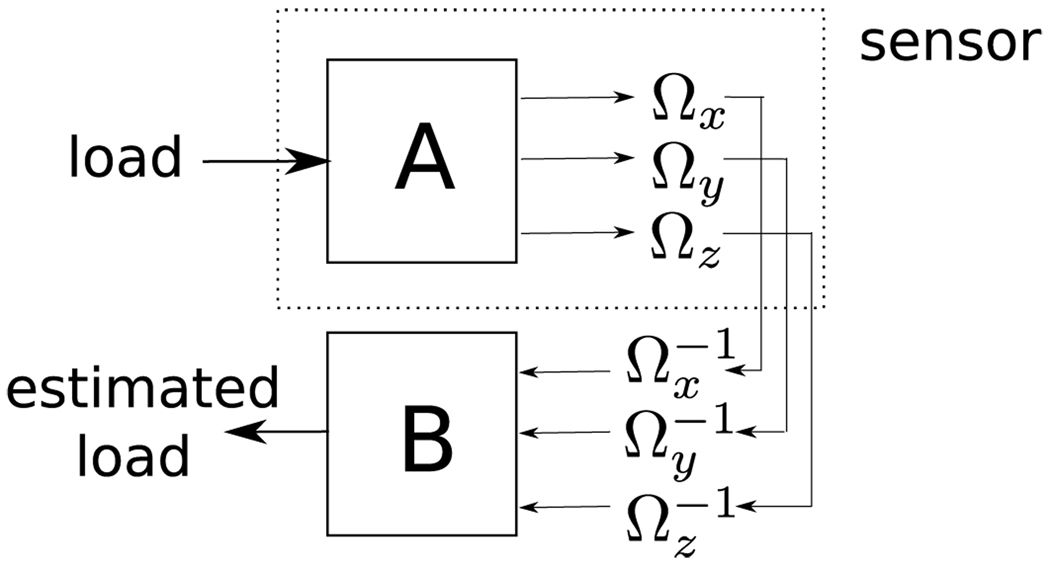
When a force is exerted on the force sensor, the matrix, A, is multiplied to the force to obtain the individual forces imparted onto the individual elastic frame structure. Each of these forces is then passed through the individual structure’s hysteretic effect (Ω) to obtain the voltage as illustrated in Fig. 10. To estimate the load from voltage measurements, the voltage measurements are first passed through the inverse hysteretic model of each individual elastic frame structure. The output vector is then pre-multiplied by B, which is ideally the inverse of A, to obtain the applied load information.
Fig. 10.
Estimation of external load through sensors’ output
A. Modeling of the hysteretic effect
Plastic materials, while ideal for MRI imaging, are known for their hysteretic force-deformation characteristic. It is proposed in this paper that the Prandtl-Ishlinskii (PI) play operator be used to model this hysteretic effect. The PI operator has been commonly used in controlling hysteretic plants and an in-depth explanation is available in [27]–[29].
Play Operators
The play operator in the PI hysteresis model, commonly used to model the backlash between gears, is defined by:
| (9) |
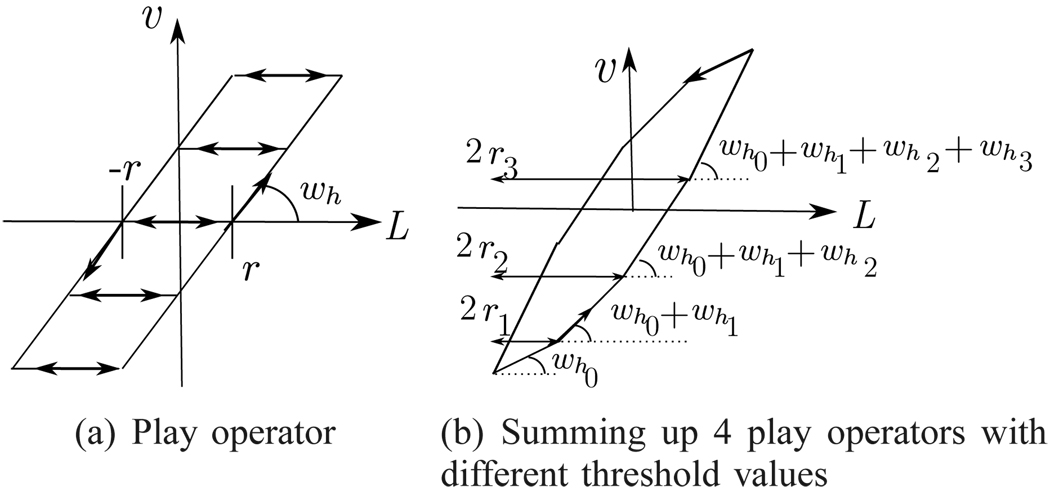
where L is the input load to the elastic frame structure, v is the voltage reading from photosensor, r is the threshold value or the magnitude of the backlash, T is the sampling period and i represents the respective elastic frame structure. Fig. 11(a) illustrates how the play operator behaves.
Fig. 11.
Prandtl-Ishlinskii hysteresis model
The initial Condition of (9) is given by:
| (10) |
where vi0 is a real number which is usually initialized to 0. To change the gradient, a weight value wh is multiplied to the play operator Hr. By summing a number of such operators with different threshold values and weights, a hysteresis model is obtained:
| (11) |
where is the weight vector, , threshold vector r⃗ = [r0 … rn]T (where rn > … > r0, r0 = 0), and the initial state vector is v⃗i0 = [vi00 … vi0n ]T. Fig. 11(b) shows the effect when 4 play operators with different threshold values are summed up.
A summarization of play operators with different threshold values is used to perform the phenomena modeling. These play operators are piecewise linear functions, with their gradient determined by the weights of the operator, and hence, factors like hysteresis and friction can be modeled accurately up to a certain extent.
Inverse Parameters
The inverse PI model is commonly expressed using the stop operators. Kuhnen [27] showed that the inverse PI model can be expressed by PI play operators too. Thus, the inverse of the PI model can also be expressed as:
| (12) |
The inverse model parameters can be calculated by:
| (13) |
B. Calibration Matrix
As the three prismatic joints are placed along three mutually orthogonal axes, the ideal value of matrix A is an identity matrix. However, due to errors in manufacturing for example, matrix A is not an identity matrix. The real value of matrix A is unknown, and hence, matrix B, which is ideally the inverse of matrix A, is obtained through experiments to account for the imperfection. Two sets (training and testing) of data are obtained. Applying least squares errors to the training set, the matrix B is obtained as:
| (14) |
The strength of the diagonal values of matrix B determines the separation capability of the different axes onto the different measurements channels. In this prototype, the diagonal values of B are significantly larger than the off-diagonal terms in the matrix, and this indicates a relatively strong decoupled effect. In most papers, a parallel mechanism is used, and the measurement axes are coupled and a few components of the off-diagonal terms are relatively larger.
VI. EXPERIMENTS
Experiments are conducted to evaluate the performance of the force sensor and also to check its MRI compatibility.
A. Experiment Setup
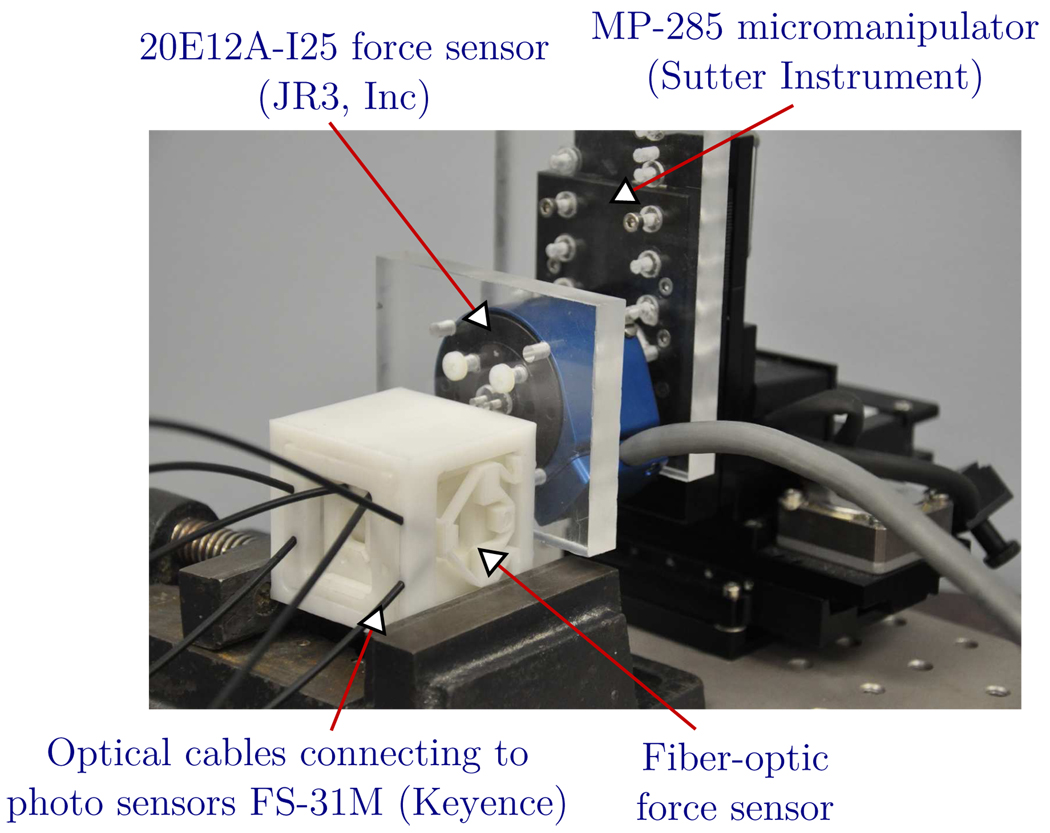
Fig. 12 shows the experiment setup to evaluate the fiber-optic force sensor. The fiber-optic force sensor is connected to a commercially available force sensor (model: 20E12A-I25, manufactured by JR3, Inc, CA, USA), which in turn is connected to a micromanipulator (model: MP-285, manufactured by Sutter Instrument, CA, USA). The micromanipulator is used to move and apply a force onto the 3-DOF fiber-optic force sensor prototype.
Fig. 12.
Experiment setup for calibrating the 3-DOF fiber optic force sensor
Based on the working principle of the fiber-optic force sensor, an external force applied on the input port will generate a displacement in elastic frame structure and the intensity of the reflected light will change. This change in the reflected light intensity is sensed, and converted to analog voltage by FS-V31M photosensors.
B. Experimental Results
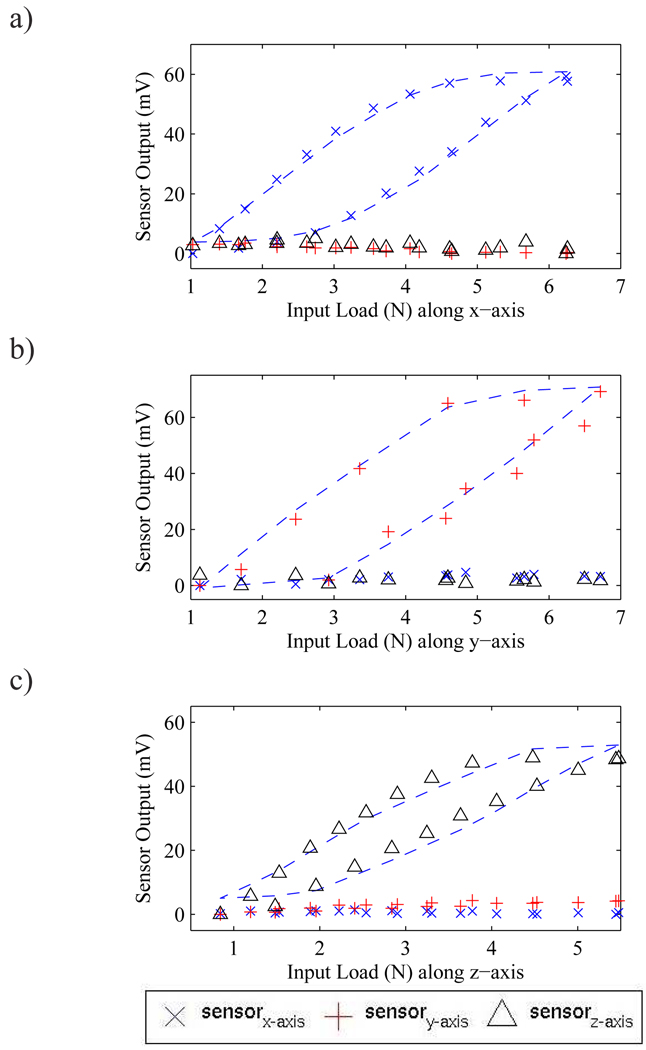
The MP-285 micromanipulator with the attached JR3 force sensor is used to apply a known force along the three principal directions, namely x-, y- and z- axes. Two sets of experiments are conducted, with the first being the training set for calibration and the second set for evaluation of the force sensor. Fig. 13 shows the result from the testing set of the voltage output from the photosensors. The dashed line in Fig. 13 is the model obtained from the training set discussed in section V(A), and it can be seen that the test data fits the model well. This indicates that the data obtained is repeatable and that the hysteresis model can be used.
Fig. 13.
Photosensor output voltage vs. applied load along the three principal axes, namely: 1) x-axis, b) y-axis, and c) z-axis. The dash line in each graph is the hysteresis model obtained from the training set described in section V(A).
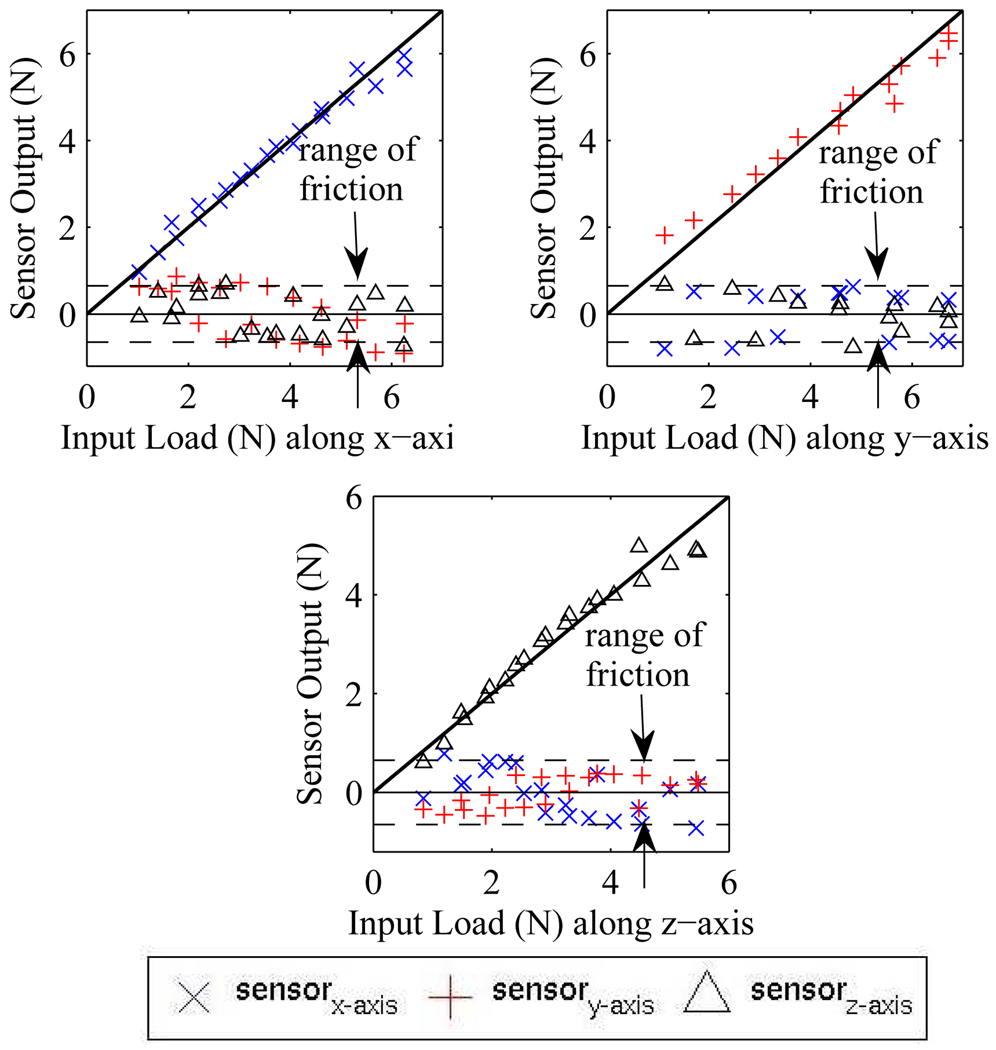
Fig. 14 shows the final result of the estimated force from the force sensor versus actual loading on the force sensor. It can be seen that the sensor output is linearized along its principal directions as expected from analysis. The main factor that is limiting the performance of this prototype is friction. Friction is the contributing factor for the very gentle gradient after each change in application direction and its inverse is a very steep gradient, thus making the sensor’s output sensitive to noise. The dotted lines in Fig. 14 represents the range of friction, which is approximately 0.7 N. It can be seen that most of the errors are within this range and the performance of the sensor can be improved significantly if friction is minimized in our design. Table II summarizes the result.
Fig. 14.
This figure shows the sensor output vs. input load along the three principal axes. The dotted lines indicate the range of friction, which is approximately 0.7 N. The sensor performance is linear along the principal directions as expected from analysis.
TABLE II.
EXPERIMENTAL RESULTS
| direction of loading | x-axis | y-axis | z-axis |
|---|---|---|---|
| xRMS-error | 0.233 | 0.483 | 0.454 |
| yRMS-error | 0.603 | 0.525 | 0.274 |
| zRMS-error | 0.446 | 0.307 | 0.454 |
| resoultion1 | 3 (mV) | ||
| bandwidth2 | 25 (Hz) | ||
| max. allowable load | 6.0 (N) |
This table summarizes the RMS errors of the sensor when a force is applied along the three principal axes. All the readings are in N unless specified otherwise.
This is the resolution from the sensors’ output after passing through a low pass filter with cut-off frequency of 25Hz.
The bandwidth is limited by the low pass filter, whose cut-off frequency is set to be 25Hz.
C. Magnetic Resonance Imaging
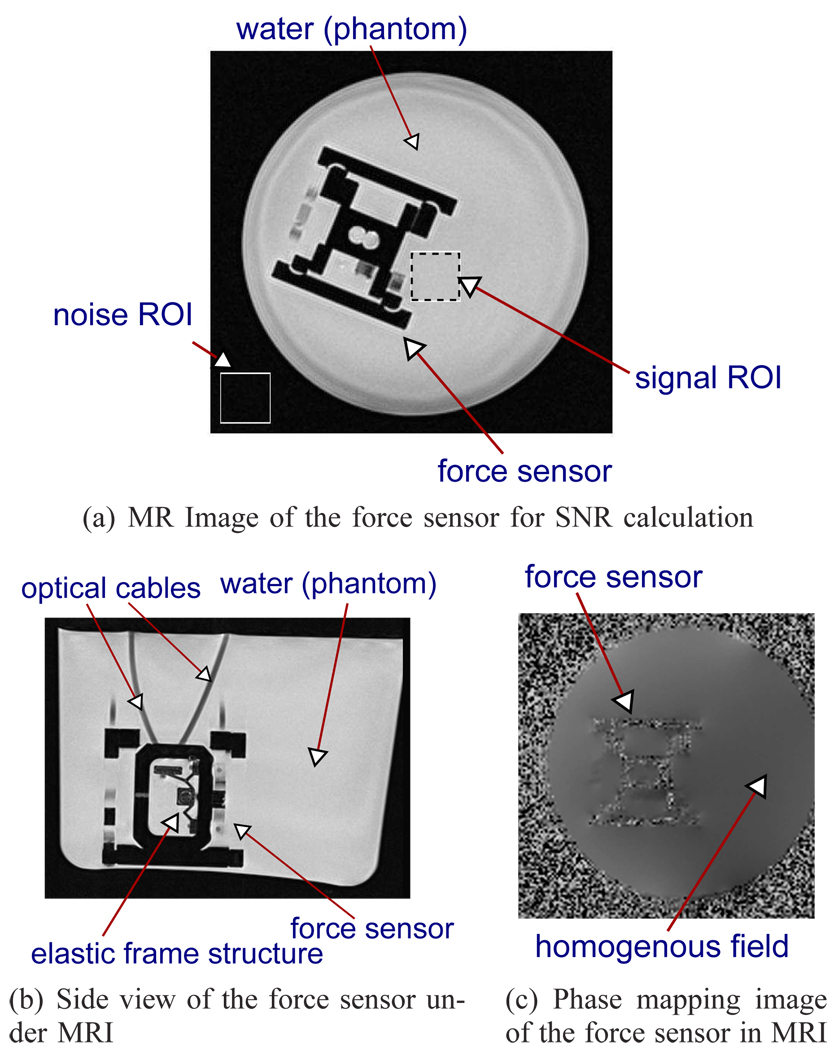
Safety is crucial in MR environment and should be considered seriously. Fortunately, all the materials used for this prototype are plastic, and hence are safe to be used in the MR environment. Images of the force sensor are also taken in the MRI to illustrate that no artifacts are formed in the images. The force sensor is placed inside a cylinder filled with water (which acts as the phantom) to provide the contrast for imaging. Fig. 15(a) shows one of the images taken when the force sensor is placed in the MRI. The white portion area in Fig. 15(a) indicates water. Clear edges of the force sensor can be seen in the image which demonstrates that no artifact is created. To determine the degree of MRI-compatibility, signal-to-noise ratio (SNR), defined as the ratio of the mean pixel value of the signal to the standard deviation of the pixel value of the background noise, is used. A spin-echo T2-weighted image (TE/TR=71ms/2760ms) with an in-plane pixel resolution of 0.625×0.625mm and slice thickness of 3mm is used to obtain the SNR information. The regions of interest (ROI), for both the signal and noise, used to calculate the SNR are shown in Fig. 15(a). The SNR is calculated to be 144 for this figure. Fig. 15(b) shows a slice of the side view of the force sensor, in which the elastic frame structure and optical cables can be clearly seen without creating any image artifacts.
Fig. 15.
Magnetic resonance imaging of the fiber-optic force sensor
A phase mapping that is sensitive to magnetic field in-homogeneity is also taken and is shown in Fig. 15(c). Minimum (or negilible) phase differences are seen in the phase mapping image (Fig. 15(c)) which shows that little or negligible magnetic field distortion is created by the force sensor. Hence, the use of this sensor in the MRI will not affect the image quality during its use in interventional procedures.
VII. DISCUSSION
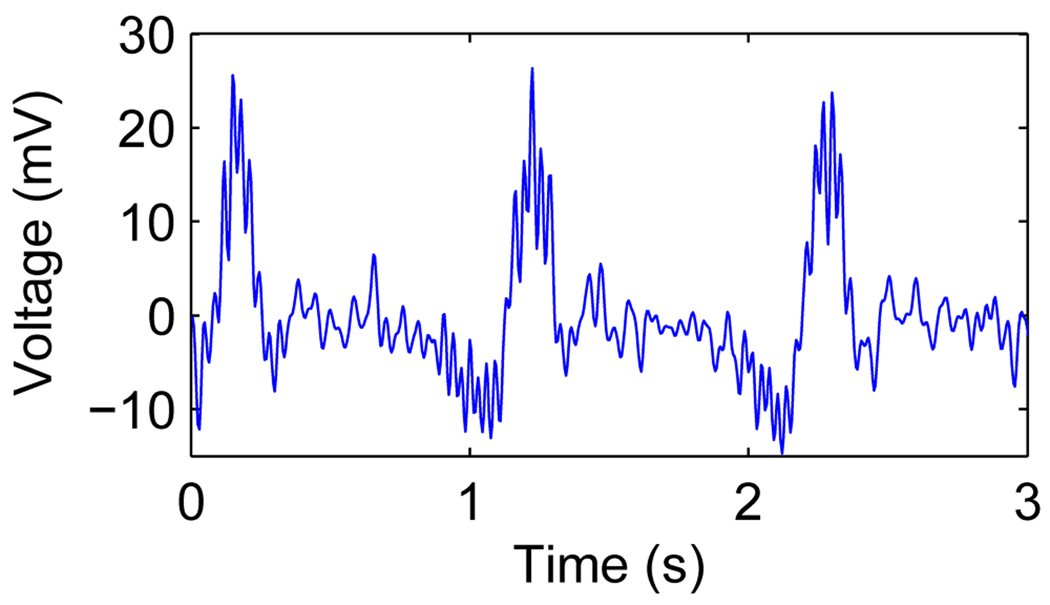
During our experiments, we initially noticed that signal interference along different axes was present to some extent. An example is now shown in Fig. 16. When the sensor size gets smaller, the placement of the optical cables between each measurement axes also gets closer. The authors suspect that the light from each of the three sources was able to traverse through the white Delrin material. This effect was removed when the intensity of the light source was reduced (at the expense of the sensitivity).
Fig. 16.
Observed interference when the light intensity is high
Friction between the sliding pieces of the primstic joint is also determined to be the other limiting factor in the performance of this prototype. Friction is the contributing factor for the very gentle gradient after each change in application direction. The inverse of this gentle gradient is a very steep gradient, resulting in the sensor’s output to be sensitive of noise. The authors plan to reduce the friction with better fabrication technique and finishing.
Plastic materials, while ideal for MR imaging, have its disadvantages, namely its ability to relax and settle down in its deformed shape, when permanently loaded. This will affect the sensor readings. Hence, the authors envision building the elastic frame structures using electrical discharge machining (EDM). Brass 360 alloy will be used, and this issue will be eliminated. As the dimension of the elastic frame structures are thin and small, the artifacts created should be small.
The proposed force sensor in this paper is designed for three axes force sensing. This is achieved by placing three prismatic joints placed along three mutually orthogonal axes. The design of the force sensor can be modified to include torque sensing by including revolute and universal joints. However, the size of the force sensor might correspondingly increase if torque sensing is included. In addition, the optimization criteria in this paper is to maximize input/output displacement amplification. More performance criteria can be included in future work depending on the requirements set by the application.
The desired force range for this sensor is presently 6N based on our prior work on needle and soft-tissue interaction studies [30], and it can be easily increased according to the target application. There is no overload protection presently. However, an overload protection can be easily implemented into the design by introducing a stopper in the prismatic joints to prevent the elastic frame structures from over-loading.
VIII. CONCLUSION
This paper presents an fiber-optic force sensor that can be used in MRI under continuous imaging. There are generally two main phases in developing a usable fiber-optic force sensor, namely: 1) design of the elastic frame structure, and 2) calibration to estimate the load from the photosensors’ voltage measurements. This paper has presented a systematic way of using a topology optimization algorithm to design the elastic frame structure, and in the process, a solution to ensure physical linkage between the input and output ports of the mechanism is proposed. A calibration method using Prandtl-Ishlinskii play operator is also proposed to account for the hysteretic behavior. A prototype of the force sensor was developed and evaluated. MRI compatibility tests were also conducted which demonstrated the feasibility of using this force sensor in the MRI environment without significant image artifacts.
ACKNOWLEDGMENTS
The authors would like to thank Prof Linda C. Schmidt of University of Maryland for the usage of her rapid prototyping machine. We would also like to acknowledge the help of Dr. Alan McMillan with some of the MRI imaging experiments.
We would like to acknowledge the support of NIH grant 1R01EB008713 for this work.
Biographies

U-Xuan Tan (S07-M10) received the B.Eng. and Ph.D. degrees in mechanical and aerospace engineering from Nanyang Technological University, Singapore, in 2005 and 2010, respectively.
He is currently a Postdoctoral Researcher at the University of Maryland, College Park. His research interests include mechatronics, sensing systems, medical robotics, and rehabilitative technology.

Bo Yang recevied his Bachelor of Engineering from Tsinghua University, Beijing, China, in 2006, and received the M.S. degree in automation from BeiHang University, Beijing, in 2009. He is currently working toward the Ph.D. degree in the Robotics, Automation, and Medical Systems (RAMS)Laboratory, Department of Mechanical Engineering, University of Maryland, College Park.
His research interests include mechatronics, medical robotics, and control.

Rao Gullapalli received his post-graduate degree in Chemical Engineering and the Ph.D. degree in instrumental sciences from the University of Arkansas, Fayetteville.
At the University of Arkansas, he was involved in research on biomedical imaging. He was a Senior Scientist in the Magnetic Resonance Imaging Division of Picker International, Cleveland, OH. He was instrumental in the development of several rapid imaging techniques and establishing research collaborations at various clinical sites. He joined the Department of Radiology, University of Maryland School of Medicine, Baltimore, in 1996 as an Assistant Professor, where he is currently an Associate Professor and Director of the Core of Translational Research in Imaging at Maryland (C-TRIM), and the Magnetic Resonance Research Center. His research interests include the development of multispectral imaging and real-time interventional imaging techniques using magnetic resonance.

Dr. Jaydev P. Desai (SM07) graduated from the Indian Institute of Technology, Bombay, India, in 1993 with a B. Tech. degree. He received the M.A. degree in mathematics, in 1997, and the M.S. and Ph.D. degrees in mechanical engineering and applied mechanics, in 1995 and 1998, respectively, all from the University of Pennsylvania, Philadelphia.
He is currently an Associate Professor in the Department of Mechanical Engineering, University of Maryland, College Park (UMCP), where he is also the Director of the Robotics, Automation, and Medical Systems (RAMS) Laboratory. His research interests include image-guided surgical robotics, haptics, reality-based soft-tissue modeling for surgical simulation, model-based teleoperation in robot-assisted surgery, and cellular manipulation.
Dr. Desai is a recipient of a National Science Foundation CAREER Award, the lead inventor on the Outstanding Invention of 2007 in Physical Science Category at the University of Maryland, College Park, and the Ralph R. Teetor Educational Award. He is currently a member of the Haptics Symposium Committee, Co-Chair of the Surgical Robotics Technical Committee of the IEEE Robotics and Automation Society, and a member of the Editorial Boards of the IEEE TRANSACTIONS ON BIOMEDICAL ENGINEERING, ASME Journal of Medical Devices, and IEEE TRANSACTIONS ON INFORMATION TECHNOLOGY IN BIOMEDICINE. He is also a member of the American Society of Mechanical Engineers.
Footnotes
A portion of the content of this paper has been published in: U-X. Tan, B. Yang, R. Gullapalli, and J. P. Desai, “Design and Development of a 3-Axis MRI-compatible Force Sensor,” in Proc. IEEE International Conference on Robotics and Automation, Alaska, USA, May 2010, pp. 2586–2591.
Contributor Information
U-Xuan Tan, Email: uxtan@umd.edu.
Bo Yang, Email: yangbo@umd.edu.
Rao Gullapalli, Email: rgullapalli@umm.edu.
Jaydev P. Desai, Email: jaydev@umd.edu.
REFERENCES
- 1.Elhawary H, Tse ZTH, Hamed A, Rea M, Davies BL, Lamperth MU. The case for MR-compatible robotics: a review of the state of the art. International Journal of Medical Robotics and Computer Assisted Surgery. 2008 March;vol. 4:105–113. doi: 10.1002/rcs.192. [DOI] [PubMed] [Google Scholar]
- 2.Dai JS, Kerr DR. A six-component contact force measurement device based on the Stewart platform. Journal of Mechanical Engineering Science. 2000;vol. 214:687–697. [Google Scholar]
- 3.Dai JS, Kerr DR. Analysis of Force Distribution in Grasps Using Augmentation. Journal of Mechanical Engineering Science. 1996;vol. 210:15–22. [Google Scholar]
- 4.Kokes R, Lister K, Gullapalli R, Zhang B, MacMillan A, Richard H, Desai JP. Towards a teleoperated needle driver robot with haptic feedback for RFA of breast tumors under continuous MRI. Medical Image Analysis. 2009 June;vol. 13(no. 3):445–455. doi: 10.1016/j.media.2009.02.001. [DOI] [PMC free article] [PubMed] [Google Scholar]
- 5.Kokes R, Lister K, Gullapalli R, Zhang B, Richard H, Desai JP. Towards a Needle Driver Robot for Radiofrequency Ablation of Tumors under Continuous MRI; Proc. IEEE International Conference on Robotics and Automation; Pasadena, CA, USA. 2008. May, pp. 2509–2514. [Google Scholar]
- 6.SensorTechnics. Force Sensor: FSS. [Online] Available: www.sensortechnics.com. [Google Scholar]
- 7.Hirose S, Yoneda K. Development of Optical 6-Axial Force Sensor and its Signal Calibration Considering Non-Linear Interference. Proc. IEEE International Conference on Robotics and Automation; Cincinnati, OH, USA. 1990. May, pp. 46–53. [Google Scholar]
- 8.Tada M, Sasaki S, Ogasawara T. Development of an Optical 2-axis Force Sensor Usable in MRI Environments. Proc. IEEE Sensors; Orlando, Florida, USA. 2002. Jun, pp. 984–989. [Google Scholar]
- 9.Takahashi N, Tada M, Ueda J, Matsumoto Y, Ogasawara T. An Optical 6-axis Force Sensor for Brain Function Analysis using fMRI. Proc. IEEE Sensors; Toronto, Canada. 2003. Oct, pp. 253–258. [Google Scholar]
- 10.Tada M, Kanade T. An MR-Compatible Optical Force Sensor for Human Function Modeling. Proc. of the international Conference on Medical Image Computing and Computer Assisted Intervention. 2004:129–136. [Google Scholar]
- 11.Tokuno T, Tada M, Umeda K. High-Precision MRI-Compatible Force Sensor with Parallel Plate Structure. Proc. of the International Conference on Biomedical Robotics and Biomechatronics; Scottsdale, AZ, USA. 2008. Oct, pp. 33–38. [Google Scholar]
- 12.Gassert R, Chapuis D, Bleuler H, Burdet E. Sensors for Applications in Magnetic Resonance Environments. IEEE/ASME Transactions on Mechatronics. 2008;vol. 13(no. 3):335–344. [Google Scholar]
- 13.Chapuis D, Gassert R, Sache L, Burdet E, Bleuler H. Design of a Simple MRI/fMRI Compatible Force/Torque Sensor. Proc. IEEE International Conference on Intelligent Robotics and Systems; Japan. 2004. Sep, pp. 2593–2599. [Google Scholar]
- 14.Puangmali P, Althoefer K, Seneviratne LD. Novel Design of a 3-Axis Optical Fiber Force Sensor for Applications in Magnetic Resonance Environments. Proc. IEEE International Conference on Robotics and Automation; Kobe, Japan. 2009. May, pp. 3682–3687. [Google Scholar]
- 15.Puangmali P, Liu H, Althoefer K, Seneviratne LD. Optical Fiber Sensor for Soft Tissue Investigation during Minimally Invasive Surgery. Proc. IEEE International Conference on Robotics and Automation; Pasadena, CA, USA. 2008. May, pp. 2934–2939. [Google Scholar]
- 16.Puangmali P, Althoefer K, Seneviratne LD. Mathematical Modeling of Intensity-Modulated Bent-Tip Optical Fiber Displacement Sensors. IEEE/ASME Trans. on Instrumentation and Measurement. 2010 Feb;vol. 59(no. 2):283–291. [Google Scholar]
- 17.Gassert R, Moser R, Burdet E, Bleuler H. MRI/fMRI-Compatible Robotic System With Force Feedback for Interaction With Human Motion. IEEE/ASME Transactions on Mechatronics. 2006;vol. 11(no. 2):216–224. [Google Scholar]
- 18.Gassert R, Chapuis D, Roach N, Wing A, Bleuler H. The Sense of Touch and its Rendering. ch. 5. Berlin: Springer; 2008. pp. 109–129. [Google Scholar]
- 19.Saxena A, Ananthasuresh GK. On an optimal property of compliant topologies. Structural and Multidisciplinary Optimization. 2000 March;vol. 19(no. 1):36–49. [Google Scholar]
- 20.Yin L, Ananthasuresh GK. Design of Distributed Compliant Mechanisms. Mechanics Based Design of Structures and Machines. 2003;vol. 31(no. 2):151–179. [Google Scholar]
- 21.Deepak SR, Dinesh M, Sahu DK, Ananthasuresh GK. A Comparative Study of the Formulations and Benchmark Problems for the Topology Optimization of Compliant Mechanisms. Journal of Mechanisms and Robotics. 2009 Feb;vol. 1(no. 1):011003. [Google Scholar]
- 22.Sigmund O. On the design of compliant mechanisms using topology optimization. Mechanics of structures and machines. 1997;vol. 25(no. 4):493–524. [Google Scholar]
- 23.Sigmund O. Morphology-based black and white filters for topology optimization. Structural and Multidisciplinary Optimization. 2007;vol. 33:401–424. [Google Scholar]
- 24.Frecker MI, Ananthasuresh GK, Nishiwaki N, Kikuchi N, Kota S. Topological synthesis of compliant mechanisms using multi-criteria optimization. ASME Journal of Mechanical Design. 1997;vol. 119(no. 2):238–245. [Google Scholar]
- 25.Tan U-X, Yang B, Gullapalli R, Desai JP. Design and Development of a 3-Axis MRI-compatible Force Sensor. Proc. IEEE International Conference on Robotics and Automation; Alaska, USA. 2010. May, pp. 2586–2591. [Google Scholar]
- 26.Chua CK, Leong KF, Lim CS. Rapid Prototyping: Principles and Applications in Manufacturing (2nd edition) World Scientific Publishing Company Inc.; 2003. [Google Scholar]
- 27.Kuhnen K. Modeling, Identification and Compensation of Complex Hysteretic Nonlinearities: A modified Prandtl-Ishlinskii Approach. European Journal of Control. 2003;vol. 9(no. 4):407–418. [Google Scholar]
- 28.Tan U-X, Latt WT, Shee CY, Riviere CN, Ang WT. Feed-forward Controller of Ill-Conditioned Hysteresis Using Singularity-Free Prandtl Ishlinskii Model. IEEE/ASME Trans. on Mechatronics. 2009 Oct;vol. 14(no. 5):598–605. doi: 10.1109/TMECH.2008.2009936. [DOI] [PMC free article] [PubMed] [Google Scholar]
- 29.Tan U-X, Latt WT, Widjaja F, Shee CY, Riviere CN, Ang WT. Tracking Control of Hysteretic Piezoelectric Actuator using Adaptive Rate-Dependent Controller. Sensors and Actuators A: Physical. 2009;vol. 150(no. 1):116–123. doi: 10.1016/j.sna.2008.12.012. [DOI] [PMC free article] [PubMed] [Google Scholar]
- 30.Hing JT, Brooks AD, Desai JP. A biplanar fluoroscopic approach for the measurement, modeling, and simulation of needle and soft-tissue interaction. Medical Image Analysis. 2007 Feb;vol. 11(no. 1):62–78. doi: 10.1016/j.media.2006.09.005. [DOI] [PubMed] [Google Scholar]


