

Abstract
Comparison of human sequences with the DNA of other mammals is an excellent means of identifying functional elements in the human genome. Here we describe the utility of high-density oligonucleotide arrays as a rapid approach for comparing human sequences with the DNA of multiple species whose sequences are not presently available. High-density arrays representing ∼22.5 Mb of nonrepetitive human chromosome 21 sequence were synthesized and then hybridized with mouse and dog DNA to identify sequences conserved between humans and mice (human–mouse elements) and between humans and dogs (human–dog elements). Our data show that sequence comparison of multiple species provides a powerful empiric method for identifying actively conserved elements in the human genome. A large fraction of these evolutionarily conserved elements are present in regions on chromosome 21 that do not encode known genes.
The identification of functional elements in the human DNA sequence is a major goal of genome research. Because sequences with function tend to be actively conserved through evolution whereas nonfunctional sequences diverge, comparison of human DNA with that of other species is a powerful method for identifying functional elements (Hardison et al. 1997; Oeltjen et al. 1997; Ansari-Lari et al. 1998; Hacia et al. 1998; Hardison 2000; Rubin and Tall 2000). Recent human–mouse genome comparisons focusing on relatively small (∼1-Mb) gene-rich intervals have discovered that evolutionarily conserved sequences are distributed between coding elements and noncoding regulatory elements (Loots et al. 2000; Onyango et al. 2000). However, the global pattern of conservation in the human genome has not yet been examined and, thus, the distribution of evolutionarily conserved sequences across gene-rich and gene-poor intervals is not known.
Conserved sequences between humans and mice can be present either as a result of active conservation due to functional constraints or as a result of shared ancestry due to insufficient divergence time. Long human–mouse elements are more likely than short human–mouse elements to be due to active conservation rather than shared ancestry. However, short human–mouse elements that are present due to active conservation may represent an interesting class of functional sequences, those that are evolving rapidly. Unfortunately, actively conserved short human–mouse sequences are difficult to distinguish from conserved sequences due to shared ancestry.
We recently performed a three-way comparative analysis of human, mouse, and dog DNA for a 200-kb gene-rich region on human 5q31 by generating pair-wise global sequence alignments (Dubchak et al. 2000). Our analysis showed that the majority of highly conserved human–mouse elements are also conserved in the dog. However, only a fraction of the human–mouse elements with lower levels of conservation is present in all three species (humans/mice/dogs). These results indicate that comparing human sequence with that of multiple species may be an effective approach for distinguishing short actively conserved elements from short conserved elements that are the result of shared ancestry.
Previous studies have shown that hybridization of DNA isolated from various mammals to human high-density oligonucleotide arrays can identify evolutionarily conserved sequences in the human genome (Hacia et al. 1998, 1999). In this report we examine the feasibility of scaling this technology for high-throughput comparisons of human sequence with the DNA of multiple mammals. We describe the use of human 21q high-density oligonucleotide arrays, on which the coding and noncoding sequences of human chromosome 21 are represented, to perform cross-species sequence comparisons. Evolutionarily conserved human sequences were identified by hybridizing the human 21q high-density arrays with fluorescently labeled syntenic mouse and dog bacterial artificial chromosome (BAC) sequences. Conserved human–mouse sequences along the entire length of 21q, and conserved human–dog elements across a 6-Mb 21q22 region, known as the “Down Syndrome Critical Region,” were identified. These conserved sequences were examined to determine the global pattern of conservation on human 21q across gene-rich and gene-poor intervals and to assess the general utility of multiple species sequence comparisons for identifying actively conserved elements in the human genome.
RESULTS AND DISCUSSION
Isolation of Mouse and Dog Syntenic BAC Sequences
When comparing human genomic sequences with those of other mammals, it is important to ensure that the DNA from the two species is orthologous (derived from the same ancestral piece of DNA) and not paralogous (similar because of a duplication of DNA). If paralogous sequences of the two species are used for the comparison, the number of conserved elements in the human sequence can be underestimated. In this study, mouse and dog BACs were considered orthologous if they contained two or more cross-species markers present on human chromosome 21 and formed part of a contig. In addition, BACs identified by a single marker, such as those at the edge of a contig or in a region not spanned by a contig, were considered orthologous if extended regions of conservation outside of known coding sequences were observed.
Orthologous chromosome 21 sequences were isolated using cross-species markers designed from the alignments of human 21q and mouse BAC-end sequences to coding and noncoding conserved elements. A total of 123 cross-species primers were developed (Supplemental Table 1, available on-line at http://www.genome.org). These markers, along with mouse-specific syntenic markers, were used to screen the RPCI-23 mouse BAC library (Osoegawa et al. 2000) by PCR. Our efforts, combined with existing mouse maps (Wiltshire et al. 1999; Pletcher et al. 2001), resulted in the assembly of >360 mouse BACs and P1 artificial chromosomes (PACs) into 35 contigs (Supplemental Table 2) that span ∼74% of the syntenic human chromosome 21 sequences.
The 6-Mb 21q22 “Down Syndrome Critical Region” was targeted for human–dog comparison because of the intense biological interest in this interval. Twenty-one cross-species markers spanning the 6-Mb 21q22 interval were amplified from genomic dog DNA by PCR and used to screen the RPCI-81 dog BAC library by hybridization. Sixty-one dog BACs were isolated, characterized by PCR content mapping, and assembled into 9 contigs covering ∼4 Mb (67%) of the targeted syntenic chromosome 21 region (Supplemental Table 3).
Array Design
Nonrepetitive human chromosome 21 sequence (22,490,347 bp; Hattori et al. 2000) was used to design a series of high-density arrays (Fig. 1A; Fodor et al. 1991; Pease et al. 1994; Chee et al. 1996). Four oligonucleotide probes (25-mers) were designed to interrogate each nucleotide present in the chromosome 21 sequence: one probe complementary to the sequence and three noncomplementary probes identical to the complementary probe except for the nucleotide at the central position (the 13th position) under interrogation (Fig. 1B). Both Watson and Crick strands were analyzed. In total, the series of 21q high-density arrays contained more than 180 million unique oligonucleotide probes.
Figure 1.

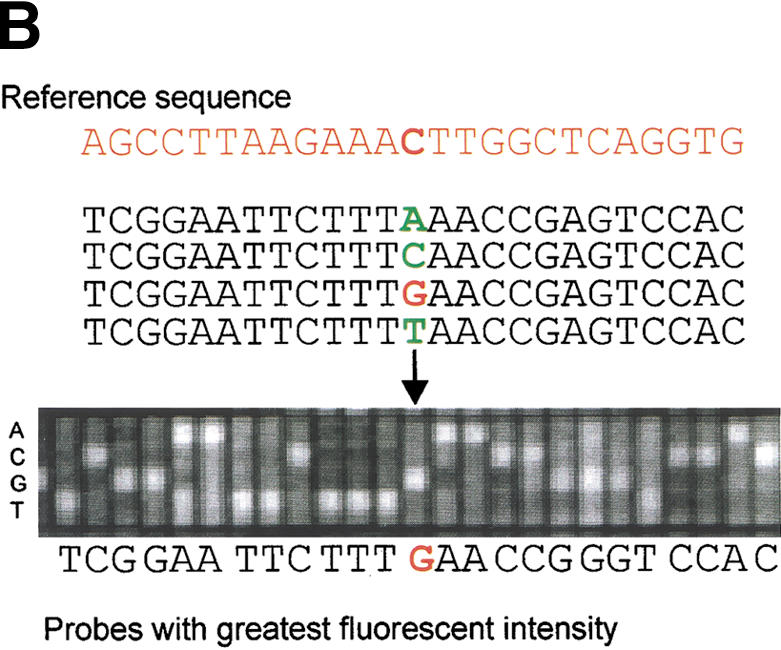


Detection and analysis of evolutionarily conserved sequences on human chromosome 21 by cross-species comparisons using high-density arrays. (A) The chromosome 21 arrays were designed using nonrepetitive sequences and hybridized with syntenic mouse and dog BACs (horizontal lines). A low-magnification view of a fluorescence hybridization image of an array is shown. (B) Chromosome 21 reference sequence was tiled as 25-mer oligonucleotides (probes). Each nucleotide of the reference sequence was interrogated by four probes: one probe complementary to the sequence and three probes noncomplementary at the central position. When the fluorescent intensities (white squares) of the complementary probes are greater than that of the noncomplementary probes, similarities between the tiled human 21q sequences and the hybridized animal DNA exist. (C) (Top) Enlarged view of a 21q array hybridized with syntenic dog BAC DNA. Two 30-nt intervals, one with high conformance between human and dog sequences (97% conformance, red rectangle) and one with low conformance between human and dog sequences (60% conformance, blue rectangle), are shown. (Bottom) For the conserved sequence with high conformance, the 29 conforming nucleotides are indicated in red. For the conserved sequence with low conformance, the 18 conforming nucleotides are indicated in blue. (D) CONSEQ plots showing the conserved sequences (red peaks that are highlighted yellow) detected on the above 21q array relative to their position in the human reference sequence (horizontal axis) and their percent conformances (vertical axis). The high-conformance (97%) conserved sequence has been merged with neighboring conserved sequences to form a 190-nt element. The low-conformance (60%) conserved sequence is an isolated 30-nt element. (Small tan rectangles) Positions of interspersed repeats, which compose ∼33.5% of chromosome 21 sequence and were not tiled on the arrays (Supplemental Table 4, http://www.genome.org); therefore, conformance information is absent.
Identification and Visualization of Conserved 21q Elements
We developed an algorithm to detect evolutionarily conserved human sequences using high-density array data. On incubation of labeled mouse and dog sequences with the human 21q arrays, if the complementary probe had greater fluorescent intensity than the corresponding noncomplementary probes, the nucleotide under interrogation was referred to as ‘conforming‘ to the human reference sequence (Fig. 1C). To identify conserved sequences we looked at 30-nt windows and averaged the conformance of the Crick and Watson strands. For example, if in a 30-nt window 75% of the Crick strand nucleotides and 85% of the Watson strand nucleotides conformed to the reference sequence, the window would have a reported conformance of 80%. We used empirically derived criteria to define a conserved sequence identified by array analysis as a 30-nt window with ≥60% conformance. To obtain conserved elements, neighboring 30-nt conserved sequences (separated by less than 100 nt of nonconserved sequence) were merged with each other. Details about the algorithm developed to identify conserved sequences and merge them into conserved elements are described in Methods.
A visualization tool, CONSEQ (CONserved SEQuences), capable of supporting the array data was developed to view the relative positions of conserved elements and known human genes (Fig. 1D). Detailed analysis of the conserved human–mouse and human–dog elements for each analyzed segment is available in tabular format as well as CONSEQ plots (Supplemental Tables 4, 5).
Specificity and Sensitivity of Conserved Element Detection by High-Density Arrays
Our goal was to develop stringent criteria so that the resulting set of conserved elements identified by the array analysis would have high specificity (low false-positive rate) with correspondingly lower sensitivity (higher false-negative rate). To estimate the false-positive rate, we hybridized ∼600 kb of chromosome 21 sequence with random mouse BAC DNA. Only three elements covering a total of 190 nt were identified as conserved. When the same ∼600-kb segment of chromosome 21 was hybridized with orthologous mouse BAC DNA, 203 conserved elements covering a total of 16,010 nt were identified. Based on these data we estimate that using our empiric definition of conserved elements, ∼1.5% of the conserved elements are false positives. When these criteria (≥60% conformance over ≥30 bp in length) were used to analyze four arrays containing ∼240 kb of chromosome 21 sequence hybridized to random dog DNA, not a single 30-nt window was identified as conserved.
The percent of conserved chromosome 21 sequences that we failed to detect by array hybridization (the false-negative rate) was estimated by examining the array data for 22 chromosome 21 genes with known mouse orthologs whose DNA sequence is present in GenBank. The 22 genes were chosen to represent coding elements along the entire length of chromosome 21 with varying degrees of similarity between the human and mouse orthologs. One hundred ninety exons had electronic matches using the BLAST algorithm and a cutoff of E ≤ 10−5 (where E is the expected value). After hybridizing the mouse BACs with the arrays and analyzing the data, 74% of the 190 electronic matches were identified as conserved elements in our analysis (Table 1). The majority of the electronic matches not detected using the arrays were those that are less conserved; only 54% of the matches with E ≥ 10−20 were identified versus 85% of the matches with E ≤ 10−20.
Table 1.
Comparison of the Array Data with BLAST Alignments for Twenty-Two Human Chromosome 21 Genes with Previously-Sequenced Mouse Orthologs
| BLAST Expect score | No. of BLAST matches | Percent identified by array | Total bp (%) overlap | BLAST % ID | Array % CON |
|---|---|---|---|---|---|
| 10−10–10−05 | 20 | 50 | 658 (42) | 88 | 71 |
| 10−20–10−10 | 47 | 55 | 2359 (41) | 89 | 72 |
| 10−30–10−20 | 40 | 72 | 3472 (45) | 89 | 72 |
| 10−40–10−30 | 24 | 79 | 2799 (51) | 89 | 68 |
| 10−60–10−40 | 29 | 90 | 4390 (54) | 90 | 69 |
| <10−60 | 30 | 100 | 9652 (49) | 90 | 65 |
| Total | 190 | 74 | 23330 (49) | 89 | 69 |
Column 1, BLAST matches of 190 exons divided into six classes based on their Expect scores. Column 2, the number of electronic matches in the class. Column 3, the percent of electronic matches in the class that were identified as conserved elements by the array analysis. For the conserved elements identified by both BLAST and the array, Column 4 lists the total number of basepairs in the electronic matches and the percent of those basepairs identified by the array. Column 5, the mean percent identity of the electronic matches in class. Column 6, the mean percent conformance of the base pairs identified by both BLAST and the array.
These data were also used to gauge how percent conformances and lengths of conserved elements identified by arrays compare with percent identities and lengths of conserved elements identified by sequence alignments. For the 140 conserved elements found by both BLAST and array analyses, the mean percent identities and percent conformances were 89% and 69%, respectively. Forty-nine percent of the base pairs present in the 140 electronic matches were represented in the conserved elements identified by the arrays. Thus, the stringent criteria used in this analysis to minimize the number of false positives results in an underestimation of the number of conserved human–mouse elements, and the elements that are found are shorter in length than if they had been identified by sequence alignments.
Conserved Human–Mouse 21q Elements
We analyzed 16,580,114 bp of nonrepetitive human chromosome 21 sequence by hybridization with orthologous mouse DNA. These human sequences represent ∼74% of the nonrepetitive chromosome 21 sequence (∼22.5 Mb). (For details, see Supplemental Table 4, available at http://www.genome.org).
Our initial analysis of the conserved human–mouse sequences consisted of classifying the elements based on whether or not they overlap known exons. In the ∼16.6 Mb of nonrepetitive chromosome 21 analyzed by hybridization with orthologous mouse DNA, the arrays identified 3398 conserved elements, of which 895 overlapped exons corresponding to 216 known 21q genes (as annotated in the chromosome 21 sequence GenBank files). The remaining 2503 elements were examined by database searches to determine if they had similarities to known exonic sequences. This analysis identified 242 additional putative coding elements (135 exons of 21q genes, 34 exons of non-21q genes, and 73 EST matches). These putative coding elements are indicated in the CONSEQ plots by a white background with black outline (Supplemental Table 4).
In the segment of chromosome 21 analyzed, ∼1.6% (260,226 bp) of the base pairs are conserved, of which 44% corresponds to the 1141 elements in identified exons (IEs) and 56% corresponds to the 2257 conserved elements not in identified exons (NIEs). These data indicate that known exons constitute less than half of the sequences on chromosome 21 conserved between humans and mice.
Comparison of Conserved Human–Dog and Human–Mouse 21q Sequences
We hybridized 2,597,732 bp representing ∼12% of the nonrepetitive 21q sequences (∼22.5 Mb) with orthologous dog DNA. In this segment of chromosome 21, ∼3.9% (101,491 bp) of the base pairs are conserved in the human–dog comparison, of which ∼26% corresponds to 240 IE elements and ∼74% corresponds to 1052 NIE elements; for detailed analyses of conserved elements, see Methods and also Supplemental Table 5 (available at http://www.genome.org).
Approximately 2.2 Mb of nonrepetitive chromosome 21 sequences (∼10% of 21q) were hybridized with both mouse and dog DNA. For these sequences, ∼4.3% and ∼1.3% of the base pairs were conserved in the human–dog and human–mouse analyses, respectively. Because of the higher level of similarity at the nucleotide level between humans and dogs than between humans and mice, the human–dog analysis identified considerably more conserved elements (IEs and NIEs) than the human–mouse analysis (Fig. 2A). Furthermore, the conserved elements identified in both comparisons are usually longer in the human–dog analysis.
Figure 2.


Comparison of the conserved human–mouse and human–dog elements. (A) CONSEQ plots showing the conserved elements identified by hybridizing a 100-kb interval (upstream and encoding the 5′ end of the single-minded [SIM2] gene) with dog and mouse DNA. The conserved elements are shown relative to their position in the human reference sequence (horizontal axis) and their percent conformances (vertical axis). (Top) Conserved elements identified in both the human–dog and human–mouse comparisons (yellow rectangles), identified in only the human–dog comparison (blue rectangles), identified in only the human–mouse comparison (green rectangles), are indicated. In this 100-kb region, 3 of the conserved elements were identified only in human–mouse comparison, 17 of the conserved elements were identified in both comparisons, and 35 of the conserved elements were identified in only the human–dog comparison. (B) Analysis of the percent of human–mouse elements that are also conserved in the dog based on length. (C) Venn diagrams showing that 77% of the human–mouse IE elements and 51% of the human–mouse NIE elements were also identified as conserved elements in the human–dog comparison. In contrast, only 62% of the conserved human–dog IE elements and 13% of the conserved human–dog NIE elements were also identified as conserved elements in the human–mouse comparison.
Multispecies Comparisons as a Means for Distinguishing Conserved Elements Due to Active Conservation from Conserved Elements Due to Shared Ancestry
The conserved human–mouse IE elements have a wide range in lengths, from 30 to 2690 nt (Supplemental Table 4, http://www.genome.org). The long IE elements represent sequences that are highly conserved, whereas the short IE elements represent sequences that are less conserved between humans and mice. Despite this fact, clearly all of these exonic sequences have been actively conserved due to functional constraints. Conserved human–mouse NIE elements also have a wide range in lengths, 30 to 950 nt (Supplemental Table 4, http://www.genome.org). However, unlike IEs that have clear function, the function of NIEs is unclear. Although a large fraction of the conserved human–mouse NIE elements are probably due to active conservation, some are likely due to shared ancestry.
Based on the assumption that conserved sequences present in all three species (human/dog/mouse) are more likely due to active conservation rather than shared ancestry, we searched for human–mouse conserved elements that are also conserved in the dog (Fig. 2A). Considering all of the human–mouse elements, 77% of the IEs and 51% of the NIEs were also identified as conserved elements in the human–dog comparison (Fig. 2C). Classifying the conserved human–mouse elements based on length and then determining the percentages that are also conserved in the dog reveals that as the length of an element increases, so does the probability that it is also detected as a conserved element in the dog (Fig. 2B). For the 30-nt length elements, there is a large discrepancy in the percent of conserved human–mouse IE elements (62%) versus human–mouse NIE elements (38%) that are also conserved in the dog. In contrast, for the >170-nt length elements, all of the human–mouse elements were also conserved in the dog. Thus, there is less discordance between the percent of the human–mouse IEs and NIEs that are also conserved in the dog for longer-length conserved elements than for shorter-length conserved elements. These data indicate that although conserved sequences of any length may be due to shared ancestry, the longer-length conserved elements are more likely than shorter-length conserved elements to be due to active conservation. This analysis also indicates that identifying evolutionarily conserved elements that are present in humans, mice, and dogs is an effective approach for identifying short conserved human–mouse elements due to active conservation.
There is more similarity between humans and dogs than between humans and mice at the nucleotide level; therefore, at any defined threshold of significance the overlap of conserved human–dog elements due to active conservation and conserved human–dog elements due to shared ancestry is greater than it is in the mouse. Furthermore, identifying the set of conserved elements present in the three species (human/mice/dogs) will be less effective at distinguishing conserved human–dog sequences due to active conservation from those due to shared ancestry than it is for distinguishing these two types of evolutionarily conserved human–mouse elements. Thus, it is not surprising that only 62% of the human–dog IEs and 13% of the human–dog NIEs are also conserved in the mouse (Fig. 2C). Comparisons between the human 21q sequences and the DNA of additional mammalian species at the same or closer evolutionary distance to humans as dogs will have to be performed to determine which of the human–dog conserved sequences are likely due to active conservation. These results indicate that comparison of human sequence with the DNA of multiple species will be important for generating a comprehensive list of potential functional elements in the human genome.
Distribution of Conserved Human 21q Elements in Genic and Nongenic Regions
To examine the global pattern of conservation on chromosome 21, we next determined the distribution of the conserved human–mouse elements in genic and nongenic intervals. Genic intervals (7,510,102 bp) were defined as all sequences contained within 10 kb upstream to 10 kb downstream of the 216 genes annotated in the chromosome 21 sequence GenBank files (Fig. 3A). Because of uncertainty in the 242 putative coding elements identified by database searches (see Methods) as to whether or not they are exonic, the regions containing these elements were considered unclassified sequences (552,175 bp) and excluded from the analysis. Nongenic intervals (8,533,733 bp) were defined as all other analyzed 21q sequences.
Figure 3.


Distribution analysis of conserved human–mouse elements in genic and nongenic intervals on chromosome 21. (A) Diagram illustrating the definition of genic regions as all sequences ± 10 kb of an annotated chromosome 21 gene. (B) The percent of the base pairs identified as conserved in the human–mouse comparison that are located in nongenic and genic intervals.
In the 21q genic intervals, ∼2.0% of the base pairs are conserved, of which ∼1.1% (79,096 bp) corresponds to IE elements and ∼0.9% (65,130 bp) corresponds to NIE elements (Fig. 3B). Thus, for the conserved base pairs in the regions of chromosome 21 encoding genes, ∼56% are in exons and ∼44% are not in known exons. Similar distributions of conserved elements in exonic and nonexonic sequences have been observed in recent studies comparing syntenic human and mouse DNA (Oeltjen et al. 1997; Ansari-Lari et al. 1998; Loots et al. 2000; Onyango et al. 2000).
In the 21q nongenic intervals, ∼1% (86,450 bp) of the base pairs are conserved. These conserved base pairs comprise ∼38% of all the conserved sequences identified on chromosome 21 and ∼58% of those in NIE elements. The NIE elements in the genic and nongenic intervals have similar length distributions, so the relative percentages of these conserved elements due to shared ancestry should be the same for the two classes of intervals (data not shown). Thus, a large fraction of the conserved sequences on human chromosome 21 exist in regions not encoding known genes. It is presently unknown what percent of the conserved sequences in nongenic intervals will comprise new chromosome 21 genes and what percent will comprise regulatory elements.
Analysis of Conserved IE Elements and Annotated Chromosome 21 Genes
Chromosome 21 contains 225 genes, of which 127 correspond to known genes and 98 represent genes predicted in silico (Hattori et al. 2000). We examined how many of these predictions are supported by human–mouse conservation (Table 2). In our study, for the 127 genes in the known category, 81% had at least one exon overlap a human–mouse IE element, 7% were not detected as conserved, and 13% were in regions not analyzed. Of the 21q predicted genes that we analyzed by human–mouse comparisons, 89% of those related to known genes, 88% of those containing a protein motif, and 18% of those based solely on EST and/or exon predictions had at least one exon overlapping a human–mouse IE (Table 2). Stringent criteria were used by Hattori et al. (2000) to define the latter class of novel anonymous predicted genes (based on EST matches that are spliced into two or more exons in genomic DNA and/or exons predicted by at least two of the following programs: GRAIL, GENSCAN, and MZEF). These data indicate that the majority of predicted chromosome 21 genes with similarity to known proteins or protein motifs are supported by human–mouse conservation, whereas predicted 21q genes lacking similarity to known proteins often fail to show human–mouse conservation.
Table 2.
Analysis of Chromosome 21 Genes for Overlap with Conserved Elements
| Classa | Analyzedb | Conservedc | |
|---|---|---|---|
| Known genes | 1.1 | 94 | 88 |
| 1.2 | 17 | 15 | |
| Related genes | 2.1 | 9 | 8 |
| 2.2 | 0 | ||
| Protein motifs | 3.1 | 8 | 7 |
| 3.2 | 1 | 0 | |
| Predicted | 4.1 | 12 | 6 |
| 4.2 | 16 | 2 | |
| 4.3 | 27 | 4 |
Class definitions according to Hattori et al. (2000). Briefly: (1.1) genes with 100% identity and known function; (1.2) genes with 100% identity but unknown function; (2.1) genes with similarity to known genes with assigned function; (2.2) genes with similarity to known genes without assigned function; (3.1) genes with similarity to a characterized functional motif; (3.2) genes with similarity to defined region of a known protein without functional association; (4.1) genes predicted based on spliced EST matches and ab initio predicted exons; (4.2) genes predicted on splice EST matches; (4.3) genes predicted on ab initio predicted exons.
The number of genes analyzed by cross-species comparison.
The number of genes with at least one exon conserved.
Conclusions
The most striking finding in this analysis is that a large fraction (∼40%) of the conserved elements on chromosome 21 are intervals that do not encode for known genes. The conserved elements in these nongenic regions might be unidentified genes and/or sequences that regulate processes such as transcription, replication, and chromosome pairing and condensation. This observation shows that cross-species sequence comparisons can be used to identify functional elements in the human genome that are not recognized by current computational and experimental annotation strategies. In addition, our analysis shows that comparing the sequences of multiple species provides a powerful empiric means of distinguishing actively conserved sequences from conserved sequences due to shared ancestry. Multispecies comparisons will undoubtedly be important for identifying rapidly evolving functional sequences in the human genome, which are likely to be an interesting class of conserved elements for functional and evolutionary studies. Although the complete genome sequences of some mammalian species, such as the mouse and rat, will be available soon, the current high cost of sequencing genomic DNA makes it unlikely that even 3× shotgun sequences of many mammalian genomes will be available in the near future. Our data show that human high-density arrays hybridized with orthologous clones from multiple species can provide a rapid and effective tool for identifying conserved elements in human sequence by comparative analysis with mammalian species for which sequence information is not available.
METHODS
Development of Chromosome 21 Cross-Species Markers
The 106 human chromosome 21 segments were obtained (http://www.ncbi.nlm.nih.gov/genome/seq/chr.cgi?CHR=21&SRT=size&MIN=0&ORG=Hs), masked for repeats using RepeatMasker2 (A.F.A. Smit and P. Green, unpubl.), and queried against the Mouse BAC End (at ftp.tigr.org /pub/data/m_musculus/bac_end_sequences/), GenBank nt, and dbEST (restricted to the mouse) databases using BLAST (Altschul et al. 1990). Matches between coding and noncoding chromosome 21 DNA and sequences in the Mouse BAC End (with an E value ≥ 10−10) and GenBank (to known or suspected mouse orthologs) databases were used to design cross-species primer pairs (with ∼50% GC content and a predicted product of 100–200 bp). Each primer pair was tested individually against human and mouse genomic DNA to determine if it produced a single clear fragment visible by agarose gel electrophoresis and ethidium-bromide staining. A total of 123 primers passing this PCR assay are listed in Supplemental Table 1 (available at http://www.genome.org). All mouse-specific primers used in the study were obtained from either the Mouse Genome Database (http://www.informatics.jax.org/) or the WICGR Mouse RH Map (http://www.genome.wi.mit.edu/mouse_rh/index.html).
PCR Conditions
PCR reactions were performed in a 25-μL volume containing 10 ng of genomic DNA or 1 ng of purified BAC DNA, 1 mM of each primer, 2.5 units of AmpliTaq Gold (Perkin-Elmer), 0.25 mM deoxynucleotide triphosphates (dNTPs), 10 mM Tris-HCl (pH 8.3), 50 mM KCl, 1.25 mM MgCl2. Thermocycling was performed on a 9600 or 9700 (Perkin-Elmer), with initial denaturation for 10 min at 95°C, followed by one of two cycling conditions based on the melting temperature of the primers: either 10 cycles of (30 sec, 94°C; 30 sec, 58°C; 30 sec, 72°C) followed by 30 cycles of (30 sec, 94°C; 30 sec, 55°C; 30 sec, 72°C) or 10 cycles of (30 sec, 94°C; 30 sec, 55°C; 30 sec, 72°C) followed by 30 cycles of (30 sec, 94°C; 30 sec, 52°C; 30 sec, 72°C). A final extension reaction was performed for 5 min at 72°C. To score BACs for the presence or absence of markers, 10 μL of the PCR amplification product was assayed by 2% agarose gel electrophoresis and ethidium-bromide staining.
Screening of Mouse and Dog BAC Libraries
Cross-species markers and mouse-specific markers were screened against 147,456 clones (∼8.8-fold coverage of the mouse genome) from plates 1–384 of the RPCI-23 mouse library (Osoegawa et al. 2000; http://www.chori.org/bacpac/23framefmouse.html) using a PCR approach as described (Hudson et al. 1995). Briefly, the library was divided into 48 blocks, each containing eight 384-well plates. For each block, DNA from all the clones in the eight plates were pooled by plate, row, and columns (8 plate, 16 row, and 24 column pools) to form superpools. If a clone was identified positive in the block screening, the superpools were used to determine the corresponding plate, row, and column address. Partial addresses were not used in the map assembly. Isolation of mouse PACs and the one RPCI-21 BAC (b340M5) used in this study were described previously (Wiltshire et al. 1999; Pletcher et al. 2001). Cross-species markers were screened against the dog RPCI-81 library (http://www.chori.org/bacpac/81framemcanine.htm) by hybridization as described (BACPAC Resources, Children’s Hospital Oakland Research Institute).
Oligonucleotide Array Hybridization
BAC and PAC DNA was purified from clones using the Qiagen Large-Construct Kit (QIAGEN). DNA labeling and hybridization to chips was performed as described (Wang et al. 1998) with minor modifications. Thirty micrograms of purified BAC DNA (average insert size 197 kb) was fragmented with DNase I (Boehringer Mannheim) and labeled with biotin with terminal deoxynucleotidyl transferase (TdT, GIBCO BRL Life Technology). Fragmentation was performed in a 74-μL volume with 0.2 unit of DNase I, 10 mM Tris-acetate (pH 7.5), 10 mM magnesium acetate, 50 mM potassium acetate for 10 min at 37°C, after which the reaction was stopped by heat inactivation for 10 min at 99°C. The terminal transferase reaction was performed by adding 50 units of TdT and 12.5 μM biotin-N6-ddATP (Dupont NEN) to the preceding reaction mix, incubating for 90 min at 37°C, and then heat-inactivating for 10 min at 99°C. Next, labeled DNA sample was denatured in hybridization buffer (3M tetramethylammonium chloride, 10 mM Tris-HCl at pH 7.8, 0.01% Triton X-100, herring-sperm DNA [100 μg/mL], 50 pM control oligomer) for 5 min at 99°C and hybridized to a oligonucleotide array overnight at 40°C on a rotisserie at 40 rpm. All washes and staining were performed at room temperature. Oligonucleotide arrays were washed twice with 1× MES buffer (0.1 M 2-[N-Morpoline]ethanesulfonic acid at pH 6.7, 1 M NaCl, 0.01% Triton X-100) and stained with staining solution (streptavidin R-phycoerythrin [20 μg/mL; Molecular Probes] and acetylated bovine serum albumin [BSA; 1 mg/mL] in 2× MES) for 20 min on a rotisserie at 40 rpm. Following two washes with 1× MES, chips were incubated with antibody solution (biotinylated anti-streptavidin antibody [10 μg/mL] and BSA [1 mg/mL] in 2× MES) for 20 min on a rotisserie at 40 rpm. After two washes with 1× MES, chips were stained again with staining solution for 20 min. Oligonucleotide arrays were washed six times with 6× SSPET (0.9 M NaCl, 60 mM NaH2PO4, 6 mM EDTA at pH 7.4, 0.01% Triton X-100) at 35°C on a fluidics workstation (Affymetrix). Hybridization was detected by using a custom confocal scanner with a resolution of 110 pixels per feature (pixel size of 2.27 μM) and 560-nm filter.
Algorithm for Conserved Sequences
Sequences were classified as conserved on the basis of high conformance. Conformance was computed as the percent of perfect-match probes that had greater fluorescent intensity than the corresponding mismatch probes over sequences of 30 bp. That is, if the 25-mer probe complementary to the reference sequence (as opposed to one of the three probes with a mismatch to the reference sequence at the 13th nucleotide) had the highest intensity of the four probes, then 1 was added to the total conformance for the interval. Therefore, if 8 of 30 bases had the perfect-match probe having the highest intensity on the Watson strand, and 7 perfect-match probes had the highest intensity on the Crick strand, the conformance would be (8 + 7)/(30 + 30) = 25%.
Conformance was computed for base pairs 1–30, 21–50, 41–70, and so on for each sequence fragment tiled on the arrays. Interspersed repeats were not tiled on the arrays; therefore, sequence fragments of differing lengths were present. For a sequence fragment of 100 bp, conformance would be computed for five overlapping intervals, with the fifth interval being base pairs 71–100. This was to maintain an interval width of exactly 30 bp with a minimum overlap of 10 bp, such that every base appeared in at least one interval.
Based on examination of known false positives and verified conserved sequences, criteria were developed to classify a 30-bp interval as conserved. An interval was classified conserved if:
- (1)
conformance was ≥60%,
- (2)
an interspersed repeat did not exist in an overlapping interval (within 20 bp),
- (3)
the maximum frequency of any one base in the reference sequence was <15, and
- (4)
the maximum frequency of any one base was <10 in any 15 consecutive base pairs.
Criteria (2), (3), and (4) eliminated intervals in which high levels of hybridization occurred solely because of the repetitive or low-complexity (e.g., a sequence of “ATATAT…AT”) nature of the reference sequence.
After determining which 30-bp intervals were conserved, the conserved elements were derived from merging overlapping conserved intervals. If, for example, the intervals containing base pairs 131–160, 151–180, and 171–200 were conserved, but not the intervals before and after them, then this would constitute a single conserved element from base pairs 131–200, with length 70 bp.
Inspection of the intervals classified as conserved showed some in close proximity to each other, but not overlapping, that appeared to be part of the same conserved element. Based on this observation, if two conserved intervals were within 100 bp of each other they were merged into one element, and the intervals between them were classified as conserved even though they did not meet criteria (1)–(4).
Sensitivity Analysis
The following 22 genes were used: SAMSN-1, CXADR, BTG3, PRSS7, NCAM2, GABPA, APP, CCT8, BACH1, CLDN8, IFNAR2, IL10RB, GART, CBR1, CLDN14, SIM2, DSCAM, BACE2, PKNOX1, PFKL, SMT3H1, COL6A2. Human chromosome 21 sequence was searched against the GenBank database (November 2000) restricted to mouse using BLAST (default parameters), and the matches were inspected to ensure that only those corresponding to human–mouse orthologs were used. Exonic sequences in regions not analyzed by the oligonucleotide arrays were not used to calculate the false-negative rate.
Human–Mouse Comparative Analysis
Conserved elements not overlapping exons (as annotated in the GenBank sequence files listed in Supplemental Table 4, http://www.genome.org) were searched against the GenBank nt (November 2000) and dbEST (January 2001) databases using BLAST (default parameters). The results were filtered to exclude matches E ≥ 10−5 and the words “genomic DNA” or “Chromosome 21” in the FASTA description line. The remaining matches were parsed and manually inspected. Thirty-four conserved elements had similarities to 11 genes not assigned to chromosome 21 at the time the sequence was released. Of these 11 genes, 3 are currently known to be on chromosome 21: Donson (Seg. 62; Wynn et al. 2000), CRFB4 (Seg. 61; Spencer et al. 1998), and bHLHB1 (Seg. 61; Wang et al. 2000); one, KIAA1019 (Seg. 62), significantly overlaps the sequence of SON (a known chromosome 21 gene); one, Ktrap13-like (Seg. 53), has intron/exon boundaries and likely is a newly identified chromosome 21 gene. The significance of the similarities with the other six genes is unclear. Seventy-three conserved elements matched ≥2 ESTs (of any species) with a BLAST E ≤ 10−5 and were counted as coding (65 conserved elements matched a single EST with a BLAST E ≤ 10−5 and were not considered coding). The following known or predicted genes, which were indicated as being on chromosome 21 at the time the sequence was released (Hattori et al. 2000), are not in the annotated GenBank files: UBASH3A, WDR4, NDUFV3, SLC37A1, N143, KAP cluster, TSGA2, UMODL1, and TMPRSS3. There are multiple conserved elements in the regions in which TMPRSS3, UMODL1, and TSGA2 are reported to be encoded (Hattori et al. 2000), none of which matched coding sequences in GenBank nt (November 2000). Thus, we could not determine which of these elements are coding, and consequently all of them are counted as coding and are indicated by a white background with black outline in the CONSEQ plots (Supplemental Table 4).
Human–Dog Comparative Analysis
The arrays identified 1292 conserved human–dog elements of which 197 overlapped exons of known chromosome 21 genes (as annotated in GenBank files). The remaining 1095 conserved elements were compared against the GenBank nt (November 2000) and dbEST (January 2001) databases using BLAST (default parameters). Matches with E ≥ 10−5 and the words “genomic DNA” or “Chromosome 21” in the FASTA description line were excluded. Of the remaining 1095 elements, 10 matched exons of known chromosome 21 genes and 14 matched cDNAs not assigned to chromosome 21 at the time the sequence was released (Hattori et al. 2000). The locations of these 14 matches (which correspond to 8 different cDNAs) are indicated by a white background with black outline in the CONSEQ plots (Supplemental Table 5, http://www.genome.org). Nineteen conserved elements matched ≥2 ESTs (of any species) with an E ≤ 10−5 and were considered coding (27 matched a single EST with an E ≤ 10−5 and were not counted as coding).
Acknowledgments
We thank K. Vyas, D. Thomas, A. Berno, C. Hacker, D. Scott, M. Hamilton, and O. Kahsai for assistance, R.H. Reeves for sharing data before publication, and the members of Perlegen Sciences' Scientific Advisory Board for constructive comments and helpful discussions. This work was supported in part by the following grant: NIH GM-5748202 (K.A.F.).
The publication costs of this article were defrayed in part by payment of page charges. This article must therefore be hereby marked “advertisement” in accordance with 18 USC section 1734 solely to indicate this fact.
Footnotes
E-MAIL kelly_frazer@perlegen.com; FAX (408) 731-5391.
Article and publication are at http://www.genome.org/cgi/doi/10.1101/gr.198201.
REFERENCES
- Altschul SF, Gish W, Miller W, Myers EW, Lipman DJ. Basic local alignment search tool. J Mol Biol. 1990;215:403–410. doi: 10.1016/S0022-2836(05)80360-2. [DOI] [PubMed] [Google Scholar]
- Ansari-Lari MA, Oeltjen JC, Schwartz S, Zhang Z, Muzny DM, Lu J, Gorrell JH, Chinault AC, Belmont JW, Miller W, et al. Comparative sequence analysis of a gene-rich cluster at human chromosome 12p13 and its syntenic region in mouse chromosome 6. Genome Res. 1998;8:29–40. [PubMed] [Google Scholar]
- Chee M, Yang R, Hubbell E, Berno A, Huang XC, Stern D, Winkler J, Lockhart DJ, Morris MS, Fodor SP. Accessing genetic information with high-density DNA arrays. Science. 1996;274:610–614. doi: 10.1126/science.274.5287.610. [DOI] [PubMed] [Google Scholar]
- Dubchak I, Brudno M, Loots GG, Pachter L, Mayor C, Rubin EM, Frazer KA. Active conservation of noncoding sequences revealed by three-way species comparisons. Genome Res. 2000;10:1304–1306. doi: 10.1101/gr.142200. [DOI] [PMC free article] [PubMed] [Google Scholar]
- Fodor SP, Read JL, Pirrung MC, Stryer L, Lu AT, Solas D. Light-directed, spatially addressable parallel chemical synthesis. Science. 1991;251:767–773. doi: 10.1126/science.1990438. [DOI] [PubMed] [Google Scholar]
- Hacia JG, Makalowski W, Edgemon K, Erdos MR, Robbins CM, Fodor SP, Brody LC, Collins FS. Evolutionary sequence comparisons using high-density oligonucleotide arrays. Nat Genet. 1998;18:155–158. doi: 10.1038/ng0298-155. [DOI] [PubMed] [Google Scholar]
- Hacia JG, Fan JB, Ryder O, Jin L, Edgemon K, Ghandour G, Mayer RA, Sun B, Hsie L, Robbins CM, et al. Determination of ancestral alleles for human single-nucleotide polymorphisms using high-density oligonucleotide arrays. Nat Genet. 1999;22:164–167. doi: 10.1038/9674. [DOI] [PubMed] [Google Scholar]
- Hardison RC. Conserved noncoding sequences are reliable guides to regulatory elements. Trends Genet. 2000;16:369–372. doi: 10.1016/s0168-9525(00)02081-3. [DOI] [PubMed] [Google Scholar]
- Hardison RC, Oeltjen J, Miller W. Long human–mouse sequence alignments reveal novel regulatory elements: A reason to sequence the mouse genome. Genome Res. 1997;7:959–966. doi: 10.1101/gr.7.10.959. [DOI] [PubMed] [Google Scholar]
- Hattori M, Fujiyama A, Taylor TD, Watanabe H, Yada T, Park HS, Toyoda A, Ishii K, Totoki Y, Choi DK. The DNA sequence of human chromosome 21. Nature. 2000;405:311–319. doi: 10.1038/35012518. [DOI] [PubMed] [Google Scholar]
- Hudson TJ, Stein LD, Gerety SS, Ma J, Castle AB, Silva J, Slonim DK, Baptista R, Kruglyak L, Xu SH, et al. An STS-based map of the human genome. Science. 1995;270:1945–1954. doi: 10.1126/science.270.5244.1945. [DOI] [PubMed] [Google Scholar]
- Loots GG, Locksley RM, Blankespoor CM, Wang ZE, Miller W, Rubin EM, Frazer KA. Identification of a coordinate regulator of interleukins 4, 13 and 5 by cross-species sequence comparisons. Science. 2000;288:136–140. doi: 10.1126/science.288.5463.136. [DOI] [PubMed] [Google Scholar]
- Oeltjen JC, Malley TM, Muzny DM, Miller W, Gibbs RA, Belmont JW. Large-scale comparative sequence analysis of the human and murine Bruton's tyrosine kinase loci reveals conserved regulatory domains. Genome Res. 1997;7:315–329. doi: 10.1101/gr.7.4.315. [DOI] [PubMed] [Google Scholar]
- Onyango P, Miller W, Lehoczky J, Leung C, Birren B, Wheelan S, Dewar K, Feinberg AP. Sequence and comparative analysis of the mouse 1-megabase region orthologous to the human 11p15 imprinted domain. Genome Res. 2000;10:1697–1710. doi: 10.1101/gr.161800. [DOI] [PubMed] [Google Scholar]
- Osoegawa K, Tateno M, Woon PY, Frengen E, Mammoser AG, Catanese JJ, Hayashizaki Y, de Jong PJ. Bacterial artificial chromosome libraries for mouse sequencing and functional analysis. Genome Res. 2000;10:116–128. [PMC free article] [PubMed] [Google Scholar]
- Pease AC, Solas D, Sullivan EJ, Cronin MT, Holmes CP, Fodor SP. Light-generated oligonucleotide arrays for rapid DNA sequence analysis. Proc Natl Acad Sci. 1994;91:5022–5026. doi: 10.1073/pnas.91.11.5022. [DOI] [PMC free article] [PubMed] [Google Scholar]
- Pletcher M, Wiltshire T, Cabin DE, Villanueva MP, Reeves RH. Use of comparative physical and sequence mapping to annotate mouse chromosome 16 and human chromosome 21. Genomics. 2001;74:45–54. doi: 10.1006/geno.2001.6533. [DOI] [PubMed] [Google Scholar]
- Spencer SD, Di Marco F, Hooley J, Pitts-Meek S, Bauer M, Ryan AM, Sordat B, Gibbs VC, Aguet M. The orphan receptor CRF2-4 is an essential subunit of the interleukin 10 receptor. J Exp Med. 1998;187:571–578. doi: 10.1084/jem.187.4.571. [DOI] [PMC free article] [PubMed] [Google Scholar]
- Rubin EM, Tall A. Perspectives for vascular genomics. Nature. 2000;407:265–269. doi: 10.1038/35025236. [DOI] [PubMed] [Google Scholar]
- Wang DG, Fan JB, Siao CJ, Berno A, Young P, Sapolsky R, Ghandour G, Perkins N, Winchester E, Spencer J, et al. Large-scale identification, mapping, and genotyping of single-nucleotide polymorphisms in the human genome. Science. 1998;280:1077–1082. doi: 10.1126/science.280.5366.1077. [DOI] [PubMed] [Google Scholar]
- Wang J, Jani-Sait SN, Escalon EA, Carroll AJ, de Jong PJ, Kirsch IR, Aplan PD. The t(14;21)(q11.2;q22) chromosomal translocation associated with T-cell acute lymphoblastic leukemia activates the BHLHB1 gene. Proc Natl Acad Sci. 2000;97:3497–3502. doi: 10.1073/pnas.97.7.3497. [DOI] [PMC free article] [PubMed] [Google Scholar]
- Wiltshire T, Pletcher M, Cole SE, Villanueva M, Birren B, Lehoczky J, Dewar K, Reeves RH. Perfect conserved linkage across the entire mouse chromosome 10 region homologous to human chromosome 21. Genome Res. 1999;9:1214–1222. doi: 10.1101/gr.9.12.1214. [DOI] [PMC free article] [PubMed] [Google Scholar]
- Wynn SL, Fisher RA, Pagel C, Price M, Liu QY, Khan IM, Zammit P, Dadrah K, Mazrani W, Kessling A, et al. Organization and conservation of the GART/SON/DONSON locus in mouse and human genomes. Genomics. 2000;68:57–62. doi: 10.1006/geno.2000.6254. [DOI] [PubMed] [Google Scholar]