

Abstract
H-Ras functions as a signal switch molecule in numerous signaling pathways in the cytoplasm, requiring H-Ras localization to the inner surface of the cytoplasmic membrane, and H-Ras is considered to be a cytoplasmic protein. Immunoblot studies of cells transformed by overexpression of c-H-ras indicated that H-Ras protein was present in both cytoplasmic and nuclear extracts, suggesting a possible correlation of nuclear H-Ras and cellular transformation. Unexpectedly, additional studies revealed that H-Ras protein was also present in the nuclei of nontransformed and primary mouse cells, which do not overexpress H-Ras. Mouse fibroblast NIH 3T3 cells, L cells, and a primary fibroblast line all had H-Ras present in both cytoplasmic and nuclear extracts. Nuclear extracts of cells synchronized by growth without serum displayed an increasing amount of H-Ras and cyclin D1 as cells grew after serum addition. Treatment with farnesyltransferase inhibitor caused loss of H-Ras from the nucleus. Immunofluorescence in situ studies of nuclei from synchronized cultures showed that H-Ras protein appeared in and disappeared from the nuclei as the cells moved through the growth cycle. This cycling occurred in both nontransformed and ras-transformed cells. Flow cytometry measurements on parallel cultures revealed that the time point at which the greatest percentage of cells were in S phase, for each line, corresponded to appearance of a noticeably stronger in situ signal for H-Ras. H-Ras may participate in nuclear signaling pathways associated with replication in addition to its cytoplasmic signaling functions.
Keywords: Ras, nuclear localization, cell cycle, cyclin D1, farnesyltransferase inhibitor
Introduction
Ras is a member of the small G, or guanine nucleotide binding, family of proteins and functions as a signaling switch molecule. Three closely related human ras genes, designated as H-, K-, and N-ras, were identified as the founding members of the family; there are now 36 genes encoding 39 Ras family proteins.1 Ras cycles between an active state for signaling when GTP is bound and an inactive state when GTP is hydrolyzed to GDP. This inactivation can be catalyzed by the weak intrinsic GTPase activity of Ras but is mainly controlled by GTPase activating proteins (GAPs). Ras binds both GTP and GDP strongly, and the return to an active state involves guanine nucleotide exchange factors (GEFs), which reduce the affinity for GDP, allowing release of GDP and uptake of another GTP. Ras proteins are involved in diverse cytoplasmic signaling networks that transduce extracellular stimuli and effect changes in gene expression, apoptosis, cell cycling, and endocytosis, among others.1 H-, K4A-, K4B- (K-ras is alternatively spliced to give 2 different proteins), and N-Ras proteins require posttranslational modification (prenylation) for anchoring to the inner surface of the cell membrane; the H-, N-, and K4A-Ras proteins also require palmitoylation for the anchoring, and this localization is crucial to the Ras signaling functions. If Ras has been mutated at codon 12, 13, or 61, the protein becomes constitutively active, resulting in unregulated signaling and loss of cell growth control mechanisms. This can lead to cellular transformation and uncontrolled growth. Thus, the effects of Ras in cells appear to be exerted from the cytoplasmic compartment.
Regardless, oncogenic Ras (activated H-ras val12) has been shown to localize to the nucleus,2 and this localization was dependent on the occurrence of posttranslational farnesylation. The oncogenic Ras interacted with nuclear transfer factor 2. K-Ras4B, but not K-Ras4A or H-Ras, was shown to be present in the nucleoli of both normal and transformed cells and to associate with nucleolin.3 Nucleolar localization required an intact C-terminal hexalysine motif unique to K-Ras4B. It was recently reported that the K-Ras4B antibody used in those studies is not specific,4 so additional confirmation may be needed. The Ras-related protein RRP22 also localizes to the nucleolus, dependent on GTP binding, and can act as a tumor suppressor.5 A splice variant of H-Ras, p19ras, localizes to both the cytoplasm and nucleus6,7 and has been shown to bind with and activate p73β, a p53 homolog, in the nucleus.8,9 Ras is known to play a role in cell cycle progression in nontransformed cells. Treatment of NIH 3T3 cells with anti-Ras antibody blocked entry into S phase if antibody was present before the prior M phase started.10 Ras activity during G2 induces cyclin D1,11 and G1 progression was accelerated, and cyclin D1 was elevated, in NIH 3T3 mouse cells transformed by v-H-ras.12
We examined the localization of H-Ras in L cells, primary fibroblasts, nontransformed NIH 3T3 cells, and cells transformed by overexpression of nonmutated c-H-Ras. We found that H-Ras not only localizes to the nucleus in all 4 cell lines studied but also that Ras moves in and out of the nucleus as cells move through the growth cycle. This movement occurred in both nontransformed and transformed cells, and signals for H-Ras in the nuclei became noticeably stronger at the time point where the largest percentage of cells was in S phase for each cell line. Nuclear H-Ras was observed by in situ hybridization in both whole cells and isolated nuclei. Inhibition of Ras prenylation by farnesyltransferase inhibitors prevents membrane localization, blocks the cytoplasmic signal transduction pathway, and results in reversion of cells transformed by mutated H-Ras.13 Farnesyltransferase inhibitors are being investigated as potential anticancer agents, although performance in preclinical studies has been better than in clinical ones.14,15 We observed a decreased signal for nuclear H-Ras in cell lines treated with farnesyltransferase inhibitor, suggesting that any action of nuclear-localized Ras could also require membrane anchoring.
Results and Discussion
Distribution of H-Ras in asynchronous cell cultures
NIH 3T3 cells transformed by overexpression of an LTR-c-H-ras construct (cell line RS485)16 contain large amounts of nonmutated 21-kDa H-Ras protein. We observed in immunoblots, using a rabbit monoclonal H-Ras antibody (Y132), that H-Ras was present in nuclear as well as cytoplasmic extracts of transformed cell line RS485 (Fig. 1A). This could not be an artifact attributed to H-Ras splice variant p19ras, which localizes to both the cytoplasm and nucleus, as this variant does not crossreact with the Y132 antibody, and the protein observed migrated at the expected mass of 21 kDa. The specificity of Y132 for H-Ras was confirmed by immunoblot of H-Ras knockouts of NIH 3T3 created by transfection of siRNA for H-Ras. The 21-kDa signal in the siRNA-treated cells was reduced by an average 33% after transfection with 6 µL of siRNA and an average 49% after transfection with 8 µL of siRNA, as compared with the signal in cells transfected with a negative control siRNA.
Figure 1.
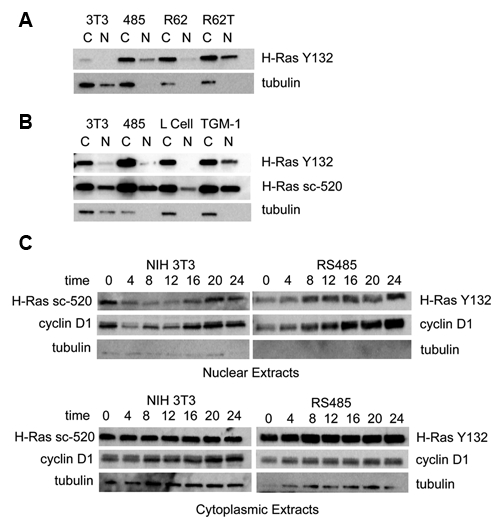
Immunoblot analysis of Ras expression. (A) Cytoplasmic (C) and nuclear (N) extracts of asynchronous cultures of nontransformed (3T3), ras-transformed (485), ras-revertant (R62), and retransformant (R62T) cell lines were probed with monoclonal H-Ras antibody Y132. R62T is retransformed, created by treatment with azacytidine. Anti–α-tubulin was used as a compartment marker. There was 10 µg of protein applied per lane. Detection was with ECL Plus reagent. (B) Cytoplasmic (C) and nuclear (N) extracts of asynchronous cultures of nontransformed (3T3), ras-transformed (485), L cells, and primary mouse fibroblast line TGM-1 were probed with monoclonal H-Ras antibody Y132 and then with H-Ras antibody sc-520. To prevent overexposed signal in RS485 lanes, only 5 µg of this protein was applied; all other lanes contained 20 µg protein. Anti–α-tubulin was used as a compartment marker. Detection was with ECL Advance reagent. (C) Nontransformed (NIH 3T3) and ras-transformed (RS485) cells were synchronized by 24 hours of growth in the absence of serum. Nuclear and cytoplasmic extracts were made at the indicated time, in hours, after the addition of serum. Blots were probed with antibody to H-Ras Y132, H-Ras sc-520, cyclin D1, or α-tubulin. Similar results were obtained with each Ras antibody, and representative results for each are shown.
The parent cell line NIH 3T3 initially appeared to have only a small amount of Ras protein, in cytoplasmic extracts only. This was the expected observation and consistent with the currently accepted paradigm of H-Ras as a cytoplasmic-only protein. We therefore posited a putative association between nuclear-localized H-Ras and cellular transformation and tested this notion by examining the localization of H-Ras in nontransformed revertants of H-Ras that continue to overexpress H-Ras protein. The expectation was that revertants would not have H-Ras in the nucleus even though H-Ras was still overexpressed. These revertants were generated by transient treatment of transformed cultures with IFNβ or an IFNβ–retinoic acid combination17,18 and are stable, contact inhibited in growth, and nontumorigenic even as they continue to overexpress H-Ras protein. Eight independent IFNβ–retinoic acid revertants had significant amounts of H-Ras in cytoplasmic extracts but had much reduced or undetectable amounts of H-Ras in nuclear extracts. A representative revertant (R62) is shown (Fig. 1A). These revertants are retransformed by treatment with 5-azacytidine, and retransformant R62T exhibited larger amounts of nuclear H-Ras than that observed in R62 nuclear extracts (Fig. 1A).
However, this potential association between the appearance of H-Ras in the nucleus and cellular transformation was not upheld in subsequent studies that employed a more sensitive chemiluminescence reagent. H-Ras was subsequently detected by antibody Y132 in nuclear extracts of asynchronous cultures of NIH 3T3 and TGM-1; NIH 3T3 is a nontransformed cell line, and TGM-1 is a primary mouse fibroblast line (Fig. 1B). Neither of these cell types overexpresses H-Ras. The observation of 21-kDa H-Ras protein in nuclear extracts of nontransformed cells was confirmed by reprobing the protein blot with another independent antibody to H-Ras (Fig. 1B). Antibody sc-520 detected nuclear H-Ras, even more strongly than antibody Y132, in NIH 3T3, TGM-1, RS485, and also L cells; nuclear H-Ras was not apparent in L cells probed with Y132. TGM-1 and NIH 3T3 appeared to have larger amounts of nuclear H-Ras than did L cells.
The amount of H-Ras in the cytoplasm of asynchronous NIH 3T3, L cells, and TGM-1 cells was roughly the same, and this was at least an order of magnitude less than that observed in the cytoplasm of transformed RS485 cells. (The quantity of RS485 protein loaded for Figure 1B was one fourth of the amount loaded for the other cell lines.)
H-Ras distribution in synchronous cell cultures
H-Ras localization was examined in cytoplasmic and nuclear extracts of NIH 3T3 and RS485 cells synchronized by 24 hours growth in serum-free medium, followed by stimulation with serum (Fig. 1C). NIH 3T3 nuclear extracts had a strong signal for H-Ras after the serum starvation period (time 0), while RS485 nuclear extracts did not; the signal for H-Ras in NIH 3T3 nuclei decreased between 0 and 4 hours and remained low until 16 hours poststimulation. The signal for H-Ras in RS485 nuclei was low at time 0 but increased significantly by 8 hours poststimulation. The expression pattern for cyclin D1 in these nuclear extracts was examined to provide a reference with a protein that is known to vary in a specific manner in the nucleus during the cell cycle. Cyclin D1 is expected to be at elevated levels in G1, decrease and remain low through S phase, and increase again in G2. The cyclin D1 patterns observed for both NIH 3T3 and RS485 nuclear extracts were not as expected. In NIH 3T3 nuclei, although the signal was strong at time 0, appropriate for cells mainly in G0-G1, this signal then decreased between 0 and 4 hours and began to gradually increase beginning at 8 hours poststimulation. Previous cycling measurements of NIH 3T319 indicated that these cells were around 90% in G0-G1 after 24 hours of serum deprivation and that these levels persisted until about 12 hours after serum stimulation. Thus, cyclin D1 levels in NIH 3T3 would be expected to stay high through at least 12 hours. This was not observed. The cyclin D1 pattern in RS485 nuclei was also not as expected; RS485 was found to be around 85% in G0-G1 after serum deprivation,19 and these levels persisted until about 7 hours poststimulation. The cyclin D1 levels observed in RS485 nuclei were low at time 0 and increased steadily up to 24 hours poststimulation rather than decreasing as cells moved into S phase. Thus, while both H-Ras and cyclin D1 nuclear levels varied during synchronous cell growth, cyclin D1 did not appear to follow the expected pattern for NIH 3T3 and RS485 cells, and cyclin D1 patterns could not be used as a standard for H-Ras patterns. In cytoplasmic extracts of synchronized cells, the signal for H-Ras was uniform over time in each cell line. Cyclin D1 signal increased during growth in NIH 3T3 cells; in RS485 cells, there was some increase but less than that observed for NIH 3T3.
Effect of farnesyltransferase inhibitor on nuclear localization of H-Ras
Cells cultured in the presence of several concentrations of farnesyltransferase inhibitor (FTI) were examined by Western immunoblot with H-Ras antibody (Fig. 2) and signals quantitated by densitometry. The amount of nuclear H-Ras in RS485 decreased with increasing concentrations of FTI, while the amount of H-Ras in cytoplasmic extracts of RS485 increased. RS485 nuclear H-Ras signal decreased 25% after treatment with 1 µM FTI, decreased 83% with 10 µM FTI, and decreased 93% with 50 µM FTI. H-Ras signal in the cytoplasmic extracts of treated RS485 cells increased variably from 32% to 48% over untreated control. There is a faint signal for tubulin in the RS485 nuclear extracts, but this is not a significant contamination; quantitation of these tubulin signals and comparison with the H-Ras signals confirm that the nuclear H-Ras signals cannot be attributed to cytoplasmic contamination. The signal for tubulin in nuclear samples, represented as a percentage of the tubulin signal in the paired cytoplasmic extract, ranges between 1.81% and 2.40%. The nuclear signal for H-Ras was 17.32% of the cytoplasmic signal for H-Ras in untreated cells. This nuclear signal decreased to 9.62% after treatment with 1 µM FTI and decreased further, as FTI concentrations increased, to 1.98% and 1.08%. If cytoplasmic contamination of nuclear extracts was responsible for the H-Ras signal observed in nuclear extracts, then the amount of this signal would be expected to be proportional to the nuclear tubulin signal. It is not. In treated NIH 3T3 cells, the decreases in nuclear H-Ras signal were 21% (1 µM FTI), 42% (10 µM FTI), and 74% (50 µM FTI). Cytoplasmic H-Ras signal also decreased in treated NIH 3T3 cells: 16%, 11%, and 26%, respectively, with increasing concentrations of inhibitor. The faint signals for histone H1 in NIH 3T3 cytoplasmic extracts, which range from 5% to 10% of the paired nuclear signal, are not necessarily indicative of nuclear contamination of cytoplasmic extracts. Histone H1 does appear in cytoplasmic extracts,20 and the translocation of histone H1 from the nucleus to cytoplasm appears to be required for the maturation of dendritic cells.21 Primary mouse fibroblast line TGM-1 was treated with 10 µM or 50 µM FTI; nuclear H-Ras decreased 59% and 67%, respectively, and cytoplasmic H-Ras decreased 62% and 48%, respectively. Thus, in nontransformed as well as c-H-ras–transformed cell lines, the presence of H-Ras in the nucleus is dependent on the presence of the farnesyl group on this protein. The RS485 cell line was created by stable transfection with multiple copies of LTR-linked c-H-ras. This may explain the increased rather than decreased amounts of cytoplasmic H-Ras in FTI-treated RS485 cells if expression of the LTR-promoted ras genes is differently affected by FTI than is the endogenous ras gene. Regardless of any differential effect on H-Ras protein expression induced by FTI, its inhibition of farnesylation of H-Ras results in the loss of nuclear localization of the protein.
Figure 2.
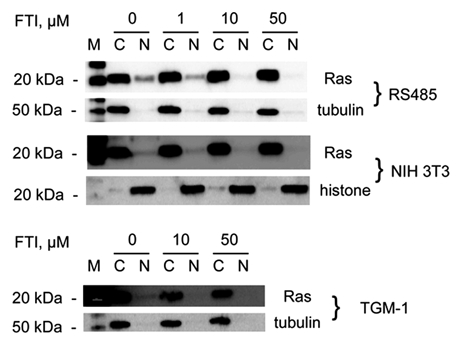
Effect of farnesyltransferase inhibitor. Cell lines RS485, NIH 3T3, and TGM-1 were grown in the presence of several concentrations of farnesyltransferase inhibitor; cytoplasmic and nuclear extracts were then probed with H-Ras antibody sc-520. Tubulin and histone were used as compartment controls. FTI = farnesyltransferase inhibitor; M = marker; C = cytoplasmic extract; N = nuclear extract. Brightness and contrast were adjusted for NIH 3T3 and TGM-1 Ras to show the nuclear signal. Signals were quantitated using densitometry.
H-Ras enters and leaves cell nuclei as cells cycle
Indirect immunofluorescence staining of cell nuclei during synchronous growth was performed to confirm the results obtained with nuclear extracts for H-Ras localization. Concurrent determinations of cell cycling were also performed to determine if there was any correlation of growth stage and appearance of nuclear H-Ras signal. Initially, whole cell preparations of both RS485 and NIH 3T3 were examined, and nuclear signal as well as cytoplasmic signal for H-Ras was detected. However, to ensure that the observed nuclear signal could not be attributed to any overlying cytoplasmic material, cells cultured in chambered slides were treated in situ, as described in Materials and Methods, to remove the cytoplasm prior to immunostaining. The localization of H-Ras in the nuclei of primary mouse fibroblast cells TGM-1 was examined in asynchronous cells, as this line did not grow well in the absence of serum. In these cells, about 5% of the TGM-1 cell nuclei had a moderate-to-strong H-Ras signal. A representative field is shown inFigure 3A. Synchronously growing cultures of L cells, NIH 3T3 cells, and c-H-ras–transformed RS485 cells were studied by indirect immunofluorescence of isolated nuclei. Cell cultures were deprived of serum for 24 hours, and then nuclei were prepared at 0, 4, 8, 12, 16, 20, and 24 hours after the addition of serum. Nuclei were stained with H-Ras antibody Y132, and staining was repeated on an independent set of nuclei preparations with H-Ras antibody sc-520. Similar results were obtained with each antibody, and representative results are shown in Figure 3B. Flow cytometry was performed on cultures grown in parallel for each cell line to determine the proportion of cells in G0-G1, S, and G2-M at each time point (Table 1). Each cell line showed a somewhat different cycling profile. L cells had a baseline of approximately 30% of cells in S phase after serum deprivation, and the peak number of cells in S phase was reached at 12 hours, after which the percentage of cells in S phase gradually returned to the baseline level. Figure 3B shows that the H-Ras signal in L cell nuclei was strongest at 12 hours, persisted at 16 hours, and declined thereafter. In NIH 3T3 cells, only about 10% of cells were in S phase through 8 hours of serum stimulation (Table 1); the percentage of cells in S phase increased, reached a peak at 16 hours, and then rapidly declined. Staining of NIH 3T3 nuclei (Fig. 3B) showed that the signal for H-Ras was fairly low through 12 hours after serum stimulation, was significantly increased by 16 hours, and continued to increase/persist through 24 hours. In transformed RS485 cells, about 20% of cells are in S phase after synchronization (Table 1), but by 8 hours after serum stimulation, there is a maximal 47% in S phase that then declines to around 30% by 24 hours. In RS485 nuclei (Fig. 3B), signal for H-Ras is low through 4 hours of serum stimulation, strongest at 8 hours, remains fairly high through 20 hours, and declines thereafter. Thus, in each cell line, H-Ras both enters and leaves the nucleus as cells progress through the growth cycle. Each cell line reaches a peak for S phase at a different time point during synchronous growth, and this peak appears to be the point at which signal for H-Ras begins to increase.
Figure 3.
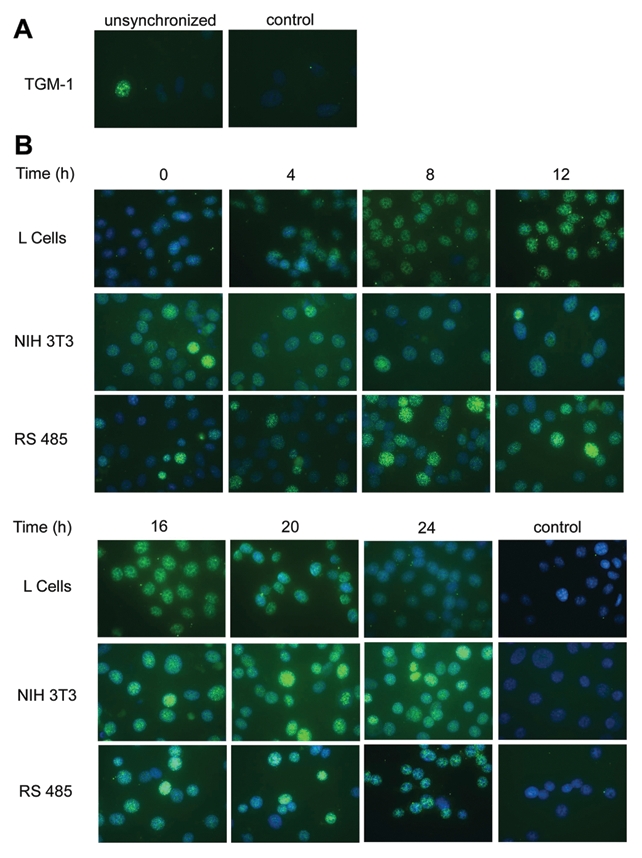
Cyclic appearance of Ras in nuclei of nontransformed and transformed cells. Cells were synchronized by 24 hours of growth in serum-free medium. Time refers to the number of hours of serum stimulation of cells prior to preparation of nuclei. Control refers to nuclei incubated with normal rabbit IgG. Mounting media contained DAPI for staining of nuclei (blue color). (A) Immunofluorescence of nuclei preparation of asynchronous culture of primary mouse fibroblast line TGM-1 incubated with H-Ras antibody Y132 and detected with secondary fluorescent antibody (green color). (B) Immunofluorescence of nuclei preparations of L cells, NIH 3T3 cells, and ras-transformed line RS485, incubated with H-Ras antibody sc-520 (L cells) or H-Ras antibody Y132 (NIH 3T3 and RS485), and detected with secondary fluorescent antibody.
Table 1.
Flow Cytometry Analysis
| Cell line | L cells | NIH 3T3 | RS485 |
|---|---|---|---|
| % | G0-G1/S/G2-M | G0-G1/S/G2-M | G0-G1/S/G2-M |
| Time, h | |||
| 0 | 65/29/6 | 89/8/3 | 60/24/16 |
| 4 | 65/29/6 | 86/10/4 | 69/17/14 |
| 8 | 65/30/5 | 86/11/3 | 53/47/0 |
| 12 | 43/54/3 | 72/28/0 | 46/44/10 |
| 16 | 34/45/21 | 6/85/9 | 44/39/17 |
| 20 | 48/32/20 | 43/18/39 | 60/30/10 |
| 24 | 61/29/10 | 69/20/11 | 60/31/9 |
Note: Cells were cultured for 24 hours in serum-free medium for synchronization. Time, h = time in hours after the addition of serum to synchronized cell cultures. The percentage of cells in stages G0-G1, S, and G2-M is shown for each time point for each cell line. Bold numbers indicate the maximal percentage in S phase for each cell line.
There is a large body of research on cytoplasmic Ras with the findings of nuclear Ras limited to oncogenic or splice variants of H-Ras and possibly a subset of K-Ras. Thus, it would seem unlikely that the occurrence of normal H-Ras in the nucleus was never previously reported. The fact that there is less nuclear H-Ras than cytoplasmic H-Ras in nontransformed cells could have contributed to this omission, as cytoplasmic signal can overwhelm nuclear signal during in situ staining; also, findings in nuclear extracts of cells can always be suspect due to potential contamination with cytoplasmic proteins. However, we have shown, using 2 independent H-Ras antibodies, in both cell extracts and by in situ staining of cultured cell nuclei, that normal H-Ras protein does localize to the nucleus of nontransformed cells and that this localization is dependent on protein prenylation. It is possible that others may have disregarded findings of nuclear H-Ras. The H-Ras antibody sc-520, which we also employed, was used as a control in a study focusing on K-Ras nuclear expression.4 That study verified the specificity of sc-520 by using it to probe H-Ras−/− fibroblasts, which, as expected, showed no signal in any cell compartment. However, 2 other figures in the publication, of human mesangial cells and of K-ras+/+ fibroblasts, each stained with H-Ras antibody, do show H-Ras signal in the nucleus, unremarked. There is less H-Ras signal in the nucleus than in the cytoplasm both cell types, but the nuclear signal exists. Another study22 examined the localization of transfected GFP-H-Ras–expressing vectors and the effect of USP17 on membrane localization of Ras; Figure 2 of that publication clearly shows GFP-H-Ras signal in the nucleus of mouse embryo fibroblasts. Superimposition of the USP17 (red) nuclear signal and the GFP-H-Ras signal results in the characteristic orange and yellow colocalization signal; this colocalization signal was not discussed.
The function of nuclear H-Ras and its mechanism of action remain to be determined; the requirement for membrane localization suggests a signal transduction pathway not unlike that in the cytoplasm. Studies are planned to determine which nuclear protein(s) may bind with H-Ras in the nucleus to begin to investigate this potential new signal pathway.
Materials and Methods
Cell culture
L cells were cultured in EMEM supplemented with 10% fetal bovine serum. All other cells were cultured in DMEM, high glucose with GlutaMAX (Invitrogen, Carlsbad, CA), and 10% fetal bovine serum. All cells were cultured at 37°C in a humidified 5% CO2 atmosphere. Cell culture reagents were from GIBCO-Invitrogen (Invitrogen, Carlsbad, CA). For synchronization, cells cultured to confluence were deprived of serum for 24 hours and then stimulated with medium containing 10% serum for times ranging from 4 hours to 24 hours. For farnesylation effects, cells were cultured in the presence of 1, 10, or 50 µM of farnesyltransferase inhibitor L-744,832 (EMD Chemicals Inc., Gibbstown, NJ), followed by preparation of cytoplasmic and nuclear protein extracts. L cells are a fibroblast line derived from a C3H/An mouse; we used subclone 11, derived from the LB cell line.23 TGM-1 are low-passage primary fibroblast cells cultured using shared tissue from 1-day-old FVB/N mice. NIH 3T3 is a fibroblast cell line derived from a Swiss mouse. This line is nontransformed and nontumorigenic. RS485 is a transformed, tumorigenic line created from NIH 3T3 by overexpression of LTR-c-H-ras.16 Revertants were cloned from RS485 treated with interferon/retinoic acid as described.17 All revertants continue to overexpress Ras and have regained lysyl oxidase expression. 62T is a retransformant, derived by treatment of revertant 62 with 3 µM 5-azacytidine.24 62T has lost expression of lysyl oxidase.
Antibodies
Rabbit monoclonal antibodies to human H-Ras (Y132), cyclin D1 (SP4), and α-tubulin (EP1332Y) were from Abcam (Cambridge, MA). Y132 does not crossreact with other Ras family members and does not recognize p19ras. Rabbit anti-human H-Ras (sc-520) and goat anti-rabbit HRP were from Santa Cruz Biotechnology (Santa Cruz, CA), and Alexa Fluor 488 goat anti-rabbit IgG H+L was from Invitrogen. H-Ras siRNA (mouse), control siRNA, and transfection reagents were obtained (Santa Cruz Biotechnology) and used to transfect NIH 3T3 cells as specified in the manufacturer’s protocol. Transfected cells were lysed in electrophoresis sample buffer, and siRNA control and H-Ras knockout cells were analyzed by immunoblot with antibody Y132.
Protein preparation and immunoblot analyses
Cytoplasmic and nuclear extracts were prepared using NE-PER (Pierce Biotechnology, Rockford, IL). Protein concentration was determined using the BCA Protein Assay kit (Pierce Biotechnology). Cytoplasmic or nuclear cell extracts were denatured in NuPage sample buffer and electrophoresed on NuPage 4% to 12% Bis-Tris gels in 3-(N-morpholino) propanesulfonic acid (MOPS)-SDS buffer (Invitrogen) according to the manufacturer’s instructions. MagicMark XP Western Protein Standard (Invitrogen) was used for direct visualization of protein standard bands by secondary antibodies. Electrophoresed proteins were transferred to Hybond-P membranes (GE Healthcare Bio-Sciences, Piscataway, NJ) at 35 V for 60 minutes at 4°C in a Novex XCell blot module (Invitrogen). Membranes were rinsed in TBST (tris-buffered saline Tween-20; 0.1% Tween-20 in 1.5 M NaCl, 100 mM Tris, pH 8.0) and blocked overnight with rocking at 4°C in a blocking buffer of 5% nonfat dry milk or 2% ECL Advance blocking agent (GE Healthcare Bio-Sciences) in TBST. Membranes were incubated with primary antibody in blocking buffer with rocking for 2 hours at room temperature, washed 3 times for 15 minutes each at room temperature with TBST, incubated with secondary antibody in blocking buffer for 45 minutes at room temperature with rocking, and washed as described. Membranes were developed with ECL Plus or ECL Advance (GE Healthcare Bio-Sciences) for 5 minutes. Digital images were obtained using a LAS-1000 Plus Luminescent Image Analyzer (Fujifilm Co., Stamford, CT). Membranes to be reprobed were stripped for 15 to 30 minutes at 50°C in Restore (Pierce Biotechnology).
Indirect immunofluorescence staining
Cells were grown in 8-chamber culture slides (BD Falcon, Franklin Lakes, NJ) and synchronized as described above. After serum stimulation for the desired number of hours, cells were pre-extracted with ice-cold cytoskeleton buffer (10 mM Pipes, pH 6.8, 100 mM NaCl, 300 mM sucrose, 3 mM MgCl2, 1 mM EGTA, 0.5% Triton X-100) for 5 minutes, followed by a 5-minute incubation with ice-cold cytoskeleton stripping buffer (10 mM Tris HCl, pH 7.4, 10 mM NaCl, 3 mM MgCl2, 1% NP-40, 0.5% sodium deoxycholate). The resulting nuclei preparations were fixed in 4% paraformaldehyde for 15 minutes, permeabilized with 0.2% Triton for 5 minutes, and blocked for 30 minutes with Image-iT FX Signal Enhancer (Invitrogen). Nuclei were incubated overnight at 4°C with either rabbit monoclonal anti–H-Ras (Y132) at a 1:1,000 dilution or rabbit anti-human H-Ras antibody (sc-520), followed by Alexa Fluor 488 (Invitrogen) goat anti-rabbit IgG at a 1:1,000 dilution for 45 minutes. Negative controls were incubated with normal rabbit IgG at 1:1,000 in place of Ras antibody. Slides were mounted with UltraCruz mounting medium with DAPI (Santa Cruz Biotechnology), and nuclei were viewed in an Olympus BK-40 fluorescence microscope equipped with a 60x oil objective and Orca ER digital charge–coupled device camera (Hamamatsu, Bridgewater, NJ). Images were captured and analyzed using OpenLab 5.5.0 software (Improvision, Waltham, MA).
Flow cytometry
Cells were synchronized by 24-hour growth in serum-free medium and then stimulated with medium containing 10% serum. At designated times after serum stimulation, the medium was removed, and cell layers were rinsed with DPBS (Invitrogen) at 4°C and then dissociated with TrypLE Express (Invitrogen). Suspended cells were collected and washed in PBS, then fixed in cold 100% methanol at –20°C for 30 minutes. Fixed cells were rehydrated in 2 mL cold PBS for 30 minutes at 4°C. 2 × 10⁶ cells were collected and suspended in 1 mL propidium iodide (PI) solution (20 mg/mL PI [Sigma-Aldrich, St. Louis, MO], 0.2 mg/mL DNase-free RNase A, and 0.1% Triton X-100 in PBS) for 30 minutes. Samples were measured on an LSR II (BD Biosciences) and analyzed using FACS Diva version 6.1.1 (BD Biosciences). The percentages of cells in the G0/G1, S, and G2/M phases of the cell cycle were determined using ModFit LT software 3.0 (Varity Software House, Topsham, ME).
Acknowledgments
Many thanks to Drs. Thomas N. Darling and Ji-an Wang, Department of Dermatology, USUHS, for access to fluorescence imaging instruments and assistance with these techniques.
Footnotes
The author(s) declared no potential conflicts of interest with respect to the authorship and/or publication of this article.
This work was supported by the Department of Pathology Research and Education Fund at the Henry M. Jackson Foundation.
References
- 1. Karnoub AE, Weinberg RA. Ras oncogenes: split personalities. Nat Rev Mol Cell Biol. 2008;9:517-31 [DOI] [PMC free article] [PubMed] [Google Scholar]
- 2. Wurzer G, Mosgoeller W, Chabicovsky M, Cerni C, Wesierska-Gadek J. Nuclear Ras: unexpected subcellular distribution of oncogenic forms. J Cell Biochem Suppl. 2001;Suppl 36:1-11 [DOI] [PubMed] [Google Scholar]
- 3. Birchenall-Roberts MC, Fu T, Kim SG, et al. K-Ras4B proteins are expressed in the nucleolus: interaction with nucleolin. Biochem Biophys Res Commun. 2006;348:540-9 [DOI] [PubMed] [Google Scholar]
- 4. Fuentes-Calvo I, Blazquez-Medela AM, Santos E, Lopez-Novoa JM, Martinez-Salgado C. Analysis of k-ras nuclear expression in fibroblasts and mesangial cells. PLoS One. 2010;5:e8703. [DOI] [PMC free article] [PubMed] [Google Scholar]
- 5. Elam C, Hesson L, Vos MD, et al. RRP22 is a farnesylated, nucleolar, Ras-related protein with tumor suppressor potential. Cancer Res. 2005;65:3117-25 [DOI] [PubMed] [Google Scholar]
- 6. Cohen JB, Broz SD, Levinson AD. Expression of the H-ras proto-oncogene is controlled by alternative splicing. Cell. 1989;58:461-72 [DOI] [PubMed] [Google Scholar]
- 7. Guil S, de La Iglesia N, Fernandez-Larrea J, et al. Alternative splicing of the human proto-oncogene c-H-ras renders a new Ras family protein that trafficks to cytoplasm and nucleus. Cancer Res. 2003;63:5178-87 [PubMed] [Google Scholar]
- 8. Jeong MH, Bae J, Kim WH, et al. p19ras interacts with and activates p73 by involving the MDM2 protein. J Biol Chem. 2006;281:8707-15 [DOI] [PubMed] [Google Scholar]
- 9. Kim JW, Kim WH, Jeong MH, et al. p19(ras) amplifies p73beta-induced apoptosis through mitochondrial pathway. Biochem Biophys Res Commun. 2008;373:146-50 [DOI] [PubMed] [Google Scholar]
- 10. Hitomi M, Stacey DW. Cellular ras and cyclin D1 are required during different cell cycle periods in cycling NIH 3T3 cells. Mol Cell Biol. 1999;19:4623-32 [DOI] [PMC free article] [PubMed] [Google Scholar]
- 11. Hitomi M, Stacey DW. Ras-dependent cell cycle commitment during G2 phase. FEBS Lett. 2001;490:123-31 [DOI] [PubMed] [Google Scholar]
- 12. Liu JJ, Chao JR, Jiang MC, Ng SY, Yen JJ, Yang-Yen HF. Ras transformation results in an elevated level of cyclin D1 and acceleration of G1 progression in NIH 3T3 cells. Mol Cell Biol. 1995;15:3654-63 [DOI] [PMC free article] [PubMed] [Google Scholar]
- 13. Moasser MM, Sepp-Lorenzino L, Kohl NE, et al. Farnesyl transferase inhibitors cause enhanced mitotic sensitivity to taxol and epothilones. Proc Natl Acad Sci U S A. 1998;95:1369-74 [DOI] [PMC free article] [PubMed] [Google Scholar]
- 14. Brunner TB, Hahn SM, Gupta AK, Muschel RJ, McKenna WG, Bernhard EJ. Farnesyltransferase inhibitors: an overview of the results of preclinical and clinical investigations. Cancer Res. 2003;63:5656-68 [PubMed] [Google Scholar]
- 15. Appels NM, Beijnen JH, Schellens JH. Development of farnesyl transferase inhibitors: a review. Oncologist. 2005;10:565-78 [DOI] [PubMed] [Google Scholar]
- 16. Chang EH, Furth ME, Scolnick EM, Lowy DR. Tumorigenic transformation of mammalian cells induced by a normal human gene homologous to the oncogene of Harvey murine sarcoma virus. Nature. 1982;297:479-83 [DOI] [PubMed] [Google Scholar]
- 17. Friedman RM, Yeh A, Gutman P, Contente S, Kenyon K. Reversion by deletion of transforming oncogene following interferon-beta and retinoic acid treatment. J Interferon Cytokine Res. 1997;17:647-51 [DOI] [PubMed] [Google Scholar]
- 18. Samid D, Chang EH, Friedman RM. Biochemical correlates of phenotypic reversion in interferon-treated mouse cells transformed by a human oncogene. Biochem Biophys Res Commun. 1984;119:21-8 [DOI] [PubMed] [Google Scholar]
- 19. Contente S, Attard FA, Yeh TA, Buchhagen DL, Friedman RM. Deregulated expression of interferon regulatory factor-1 in oncogene-transformed mouse fibroblasts. J Interferon Cytokine Res. 2003;23:639-47 [DOI] [PubMed] [Google Scholar]
- 20. Zlatanova JS, Srebreva LN, Banchev TB, Tasheva BT, Tsanev RG. Cytoplasmic pool of histone H1 in mammalian cells. J Cell Sci. 1990;96(Pt 3):461-8 [DOI] [PubMed] [Google Scholar]
- 21. Hsu LW, Chen CL, Nakano T, et al. The role of a nuclear protein, histone H1, on signalling pathways for the maturation of dendritic cells. Clin Exp Immunol. 2008;152:576-84 [DOI] [PMC free article] [PubMed] [Google Scholar]
- 22. Burrows JF, Kelvin AA, McFarlane C, et al. USP17 regulates Ras activation and cell proliferation by blocking RCE1 activity. J Biol Chem. 2009;284:9587-95 [DOI] [PMC free article] [PubMed] [Google Scholar]
- 23. Singh AK, Sidhu GS, Friedman RM, Maheshwari RK. Mechanism of enhancement of the antiviral action of interferon against herpes simplex virus-1 by chloroquine. J Interferon Cytokine Res. 1996;16:725-31 [DOI] [PubMed] [Google Scholar]
- 24. Yeh TJ, Contente S, Friedman RM. Transformation of revertant murine cells by 5-azacytidine results in rapid inhibition of lysyl oxidase expression. Acta Microbiol Immunol Hung. 2005;52:433-42 [DOI] [PubMed] [Google Scholar]