

Abstract
The deregulated presence or absence of microRNAs (miRNAs) might play an important role in molecular pathways leading to neoplastic transformation. At present, it is also thought that the approaches to interfere miRNA functions should be helpful for developing novel therapeutic opportunities for human cancer. In this study, we provide evidence that the anticancer agent benzyl isothiocyanate (BITC) has the ability to modulate the level of miRNAs such as miR-221 and miR-375, known to be abnormally expressed in pancreatic cancer patients. Interestingly, ectopic expression of miR-375 or the enforced silencing of miR-221 in cultured pancreatic cancer cells attenuates cell viability and sensitizes antiproliferative action of BITC. We also show that the expression of putative tumor suppressor miR-375 is more abundant in nonpathological mice pancreata than those with KrasG12D-driven pancreatic intraepithelial neoplasia (PanIN). To the contrary, the expression of oncogenic miR-221 is significantly elevated in the mouse pancreas with PanIN lesions. Although miR-375 has been shown to be aberrantly expressed in pancreatic cancer patients, there has not been a comprehensive study to investigate the molecular pathways targeted by this miRNA in pancreatic cancer cells. Further analysis by gene expression microarray revealed that IGFBP5 and CAV-1, potential biomarkers of pancreatic cancer, were significantly downregulated in cells transfected with miR-375. Correlatively, elevated expression of IGFBP5 and CAV-1 was evident in the mouse pancreas with preneoplastic lesions in which the expression of miR-375 wanes. Taken together, our findings suggest that anticancer agent BITC might target the expression of miR-221 and miR-375 to switch hyperproliferative pancreatic cancer cells to a hypoproliferative state.
Keywords: microRNAs, pancreatic intraepithelial neoplasia, pancreatic cancer, benzyl isothiocyanate, antiproliferative effect, IGFBP5
Introduction
The expression of microRNA (miRNA) signatures as well as individual miRNAs was observed to be connected with the diagnosis of a variety of human cancers including pancreatic carcinoma.1-12 Pancreatic cells often become malignant during tumorigenesis when cells gain traits such as the ability to evade apoptosis, to replicate without bound, and to engage in persistent angiogenesis.13-16 The emerging roles of miRNAs as oncogenes or tumor suppressors are prevalent in the literature.2-4,8-12 Precisely, miRNAs may be considered as promising molecular targets for therapy of human pancreatic cancer.
Previous studies in our laboratory and others17,18 demonstrate that benzyl isothiocyanate (BITC), a prototypical member of the isothiocyanate (ITC) family, inhibits proliferation of human pancreatic cancer cells by causing cell cycle arrest and inducing apoptosis. In general, the molecular mechanisms controlling the chemosensitivity of anticancer agents generally involve multiple signal transduction pathways. The modulation of drug sensitivity in relation to these pathways has been extensively investigated at the DNA, RNA, and protein levels. However, a small number of studies have been conducted on the regulatory influences of miRNAs on drug potency in human cancer cells.19-26 In this context, Blower et al.19 suggested the potential role of miRNAs, such as let-7i, miR-16, and miR-21, in the anticancer drug response when tested in NCI-60 human cancer cell lines. Previously, the chemopreventive action of curcumin, a major component of turmeric, has been shown to be mediated by the upregulation of miR-22.22 Scott et al.23 demonstrated a functional link between histone deacetylase inhibition and the presence of miR-27a/27b miRNA. In addition, all-trans retinoic acid (ATRA) treatment of leukemic cells resulted in the differential expression of a number of miRNAs, including let-7 and the miR-16 family.24
Large high-throughput studies in patients with pancreatic cancer revealed that a restricted number of miRNAs were altered in pancreatic ductal adenocarcinoma (PDAC) compared to adjacent benign pancreatic tissue or normal pancreas.5-7 The comparison between the results obtained by several groups revealed that oncogenic miR-221 is a commonly upregulated miRNA in PDAC patients, whereas putative tumor suppressor miR-375 is generally downmodulated. Here, we showed that miR-375 was remarkably upregulated, whereas the expression level of miR-221 was diminished because of BITC treatment of cultured pancreatic cancer cells. Furthermore, our data on conditional KrasG12D mouse model suggest the important role of these miRNAs in the progression of pancreatic intraepithelial neoplasia.
Results
Anticancer agent BITC modulates miRNAs implicated with pancreatic cancer
Previous reports reveal that the chemopreventive agent BITC has the potency to inhibit the growth of pancreatic cancer cells by exerting antiproliferative effects in vitro.17,18,27 However, these effects can be mediated by the crossover of multiple signaling pathways. BITC might behave as an agent that is capable of intervening simultaneously at several targets in the carcinogenic process. Correlatively, miRNAs can have multiple target genes and can decrease the levels of genes with various biological functions. On this basis, we were primarily interested to assess whether the chemopreventive agent BITC has the ability to alter the level of expression of deregulated miRNAs associated with pancreatic cancer patients.5-7 Among the aberrantly expressed miRNAs, the ratio of miR-221:miR-375 is thought to bear high discriminatory potential in distinguishing tumor from normal tissue.28 Initial studies were carried out in PDAC cells BxPC-3 and CFPAC-1. As shown by the miRNA q-PCR assay in Figure 1A, mature miR-375 (underexpressed in pancreatic cancer patients) was remarkably upregulated (4.6- to 9-fold) because of BITC treatment of cultured pancreatic cancer cells. To the contrary, the expression level of oncogenic miR-221 (overexpressed in pancreatic tumor samples) was noted to be diminished (41%-43%) under identical conditions (Fig. 1B). Correlatively, under identical conditions of BITC treatment, pancreatic cancer cells undergo apoptosis as reported earlier.17,27 However, the status of other oncogenic miRNAs such as miR-21 (Fig. 1C) and miR-155 (not shown) remains unaltered in BITC-treated cells when compared to control. In contrast to miR-375, the levels of putative tumor suppressor miR-148a and miR-148b were not elevated in BITC-exposed pancreatic cancer cells (not shown). It is noteworthy that the ratio of miR-221:miR-375 is thought to bear high discriminatory potential in distinguishing HNSCC tumor from normal tissue.28 In that respect, we speculate that perhaps the ability of BITC to modulate this ratio might be linked with its antiproliferative action. In line with our observation, previous reports on the ability of anticancer agents such as curcumin or EGCG to modulate miRNAs in neoplastic cells are available in the literature.19,21-26
Figure 1.
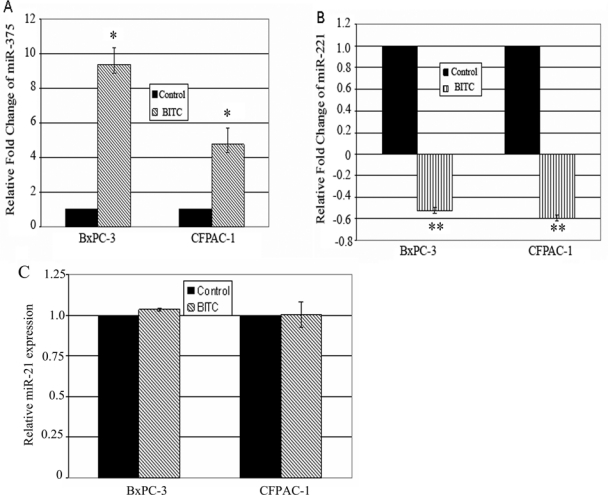
Comparative studies on miR-375 (A), miR-221 (B), and miR-21 (C) expression levels in BITC- and vehicle-treated (control) pancreatic cancer cells as determined by quantitative real-time polymerase chain reaction. CFPAC-1 and BxPC-3 cells were treated with 2.5 and 5 µM BITC, respectively, for 24 hours. miRNA expression was determined in total RNA fractions by ΔΔCT method. For relative quantitation, miRNA expression level in control cells was set at 1. Data represent mean ± SD (n = 3). *P < 0.0005 and **P ≤ 0.0002 (control v. BITC).
Inhibition of oncogenic miR-221 or exogenous expression of miR-375 affects survival of pancreatic cancer cells
In order to assess whether knockdown of oncogenic miR-22112,31 would influence pancreatic cancer cell survival, we ectopically overexpressed miR-221 inhibitor in pancreatic ductal carcinoma cells CFPAC-1. Because of miR-221 inhibitor transfection, CFPAC-1 cells exhibited a significantly lower survival rate than that of cells transfected with inhibitor negative control (Fig. 2A, panel II v. panel I). As shown in Figure 2C, clonogenic cell survival assay27,32 demonstrated approximately 60% inhibition of colony formation in miR-221 inhibitor transfected cells. We also evaluated clonal cell growth of transfected cells in the presence of BITC and observed that decreased expression of miR-221 can significantly diminish colony formation (Fig. 2A, panel IV) compared to cells transfected with inhibitor negative control (Fig. 2A, panel III) after BITC treatment. Of note, the inhibition of clonogenic cell survival of CFPAC-1 cells reached the highest level (~80%) when miR-221 inhibitor and BITC were employed together (Fig. 2C). These changes in the number of colonies were correlated with alteration in the size and morphology of the colonies (Fig. 2B).
Figure 2.
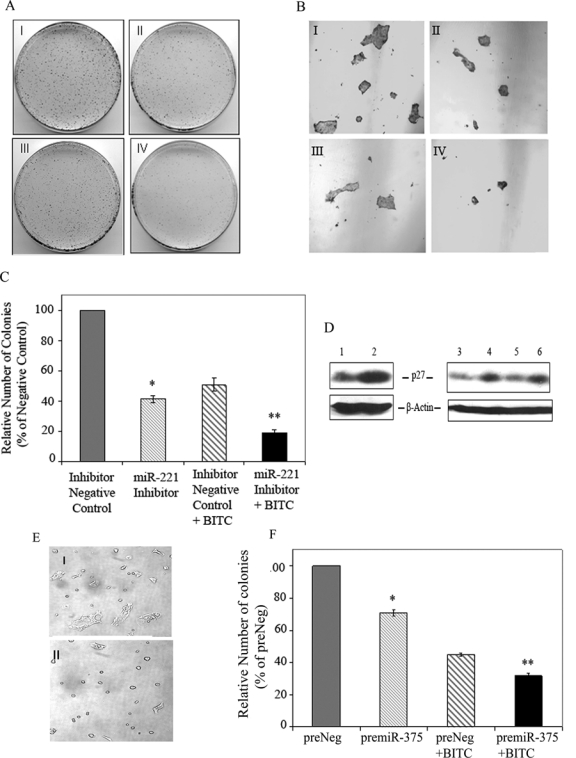
Overexpression of miR-221 inhibitor or pre–miR-375 sensitizes antiproliferative action of BITC. (A) Clonogenic cell survival assay. Forty-eight hours posttransfection, CFPAC-1 cells were plated and allowed to grow overnight. The next day, cells were either treated with vehicle solvent (DMSO) or 2.5 µM BITC for 24 hours and plated for clonogenic cell survival assay. I: inhibitor negative control; II: miR-221 inhibitor; III: inhibitor negative control + BITC; IV: miR-221 inhibitor + BITC. Representative data from 3 experiments are shown. (B) 4x magnification to show differences in colonies as shown in panel A (I-IV). (C) Bar graph represents mean ± SD of colony count. The number of colonies formed by cells transfected with inhibitor negative control was set at 100%. *P = 0.0001 compared with inhibitor negative control transfected cells. **P = 0.0003 compared with BITC-treated inhibitor negative control transfected cells. (D) Effect of silencing of miR-221 or BITC treatment on p27kip1 expression in pancreatic cancer cells by Western blot analysis. Lanes 1 and 2: CFPAC-1 cells transfected with negative control and miR-221 inhibitor oligo, respectively; lane 3: control BxPC-3; lane 4: BITC-treated BxPC-3; lane 5: CFPAC-1 control; lane 6: BITC-treated CFPAC-1 cells. (E and F) Exogenous expression of miR-375 affects cell morphology and proliferation of pancreatic cancer cells. Seventy-two hours posttransfection, BxPC-3 cell morphology was visualized, and photographs of the plates were captured in Bright field using a Nikon Eclipse E600 microscope (Tokyo, Japan). I: preNeg; II: pre–miR-375. (F) Clonogenic cell survival assay. Transfection of 140 nM pre–miR-375 and the respective negative control oligos (Ambion) was carried out in CFPAC-1 cells using DharmaFECT2 transfection reagent. Forty-eight hours posttransfection, cells were plated and subjected to BITC treatment as well as clonogenic assay as described above. The number of colonies formed by cells transfected with preNeg was set at 100%. *P < 0.0002 compared with preNeg control. **P < 0.0005 compared with BITC-treated preNeg control transfected cells.
Previously, the oncogenic role of miR-221 was supported by the identification of cell cycle regulatory molecule CDKN1/p27kip1 as one of its targets.12 In our study, we further pursued the effect of overexpression of miR-221 inhibitor on p27kip1 level in CFPAC-1 cells. As evident in Figure 2D, transfection of miR-221 inhibitor can indeed upregulate p27kip1 level (lane 2). Besides, the level of p27kip1 protein is elevated following BITC treatment in pancreatic cancer cells (Fig. 2D, lanes 4 and 6). Notably, under identical conditions, BITC can also attenuate the level of miR-221 (Fig. 1B).
Because miR-375 is underexpressed in pancreatic cancer,5,7 we also explored whether exogenously expressed miR-375 would diminish pancreatic cancer cell survival in vitro. Pancreatic cancer cells BxPC-3 transfected with pre–miR-375 for 72 hours exhibited distinct morphology such as round-shaped cells (Fig. 2E, panel II). However, such changes were rarely noted in cells transfected with negative control (Fig. 2E, panel I). Next, we wanted to determine whether clonal cell growth could be manipulated by enforced overexpression of miR-375 in pancreatic cancer cells. Accordingly, pre–miR-375 as well as the respective negative control (preNeg) was transfected into ductal adenocarcinoma CFPAC-1 cells. Clonogenic cell survival assay17,32 was employed to determine the long-term survival ability of CFPAC-1 cells following transfection. Colony count revealed that the proliferation potential of pre–miR-375 transfected cells was reduced to the extent of about 30% when compared to that of preNeg control (Fig. 2F). Furthermore, we investigated whether ectopic expression of miR-375 can augment the chemosensitivity of anticancer agent BITC to pancreatic cancer cells. Interestingly, pre–miR-375 transfection in combination with BITC treatment further compromised clonogenic cell survival compared to preNeg and BITC together (Fig. 2F).
Exogenous expression of miR-375 alters expression of IGFBP5 and CAV-1 genes in vitro
In order to understand the mechanism of miR-375–mediated antiproliferative action in pancreatic cancer cells, the gene expression microarray analysis on CFPAC1 pancreatic cancer cells was carried out at 72 hours posttransfection with control or pre–miR-375. Overexpression of miR-375 was verified by qRT-PCR analysis (not shown). Because of ectopic expression of miR-375, 593 genes were differentially expressed by >1.5-fold in CFPAC-1 cells compared with control transfected cells (Suppl. Table S1). Subsequent addition and trim by P value overlap analysis revealed the diminishment of a set of genes involved with diverse biological functions such as signal transduction, cell growth, cell cycle, and transcription according to Gene Ontology (GO) classification (Table 1). Notably, putative targets of miR-375 (as predicted in MicroRNA.org) such as MEST (mesoderm-specific transcription factor) and KIAA1191 (hypothetical protein) mRNA were decreased. Interestingly, for the first time, we observed downregulation of CAV-1 and IGFBP5 genes following miR-375 overexpression. CAV-1 gene encodes for Caveolin-1, a main component of the caveolae plasma membranes, and is a versatile signaling molecule.33 IGFBP5 is a member of a family of IGF-binding proteins, which are known to influence the activity of IGFs.34 Although a few reports suggest a possible link between these genes and pancreatic cancer,35,36 studies to unveil their roles in the progression of pancreatic cancer are needed.
Table 1.
Ectopic Expression of miR-375 in CFPAC-1 Pancreatic Cancer Cells Downregulates Genes Implicated with Diverse Biological Function
| Gene symbol | Fold change | Description | Function in Gene Ontology (GO) biological process |
|---|---|---|---|
| IGFBP5 | −2.11991 | Insulin-like growth factor binding protein 5 | Regulation of cell growth; signal transduction |
| BCAT1 | −1.79703 | Branched chain aminotransferase 1 | G1/S transition of mitotic cell cycle; metabolic process; cell proliferation |
| ZNF487 | −1.68404 | Zinc finger protein 487 | DNA-dependent regulation of transcription |
| CLDN1 | −1.66203 | Claudin 1 | Cell adhesion; calcium-independent cell-cell adhesion |
| MEST | −1.65555 | Mesoderm-specific transcript homolog | Mesoderm development |
| LAMC2 | −1.64453 | Laminin, γ 2 transcript variant 1 | Cell adhesion; epidermis development |
| CAV-1 | −1.61781 | Caveolin-1 | Vesicle organization and biogenesis |
| KIAA1191 | −1.57812 | KIAA1191 transcript variant 1 | Hypothetical protein |
| HSP90AA1 | −1.54495 | Heat shock protein 90-kDa α (cytosolic), class A member 1 | Protein folding; mitochondrial transport; response to stress; response to unfolded protein; signal transduction |
| DERL1 | −1.52736 | Der1-like domain family, member 1 | Protein transport; intracellular transport of viral proteins in host cell; endoplasmic reticulum–associated protein catabolic process; unfolded protein response; retrograde protein transport; endoplasmic reticulum to cytosol |
| DND1 | −1.52343 | Dead-end homolog 1 | Multicellular organismal development |
| CALU | −1.51118 | Calumenin | Biological process |
| MS4A10 | −1.50771 | Membrane-spanning 4 domains, subfamily A, member 10 | Signal transduction |
On this basis, we further validated the downregulation of CAV-1 and IGFBP5 genes in pre–miR-375 transfected cells by real-time qRT-PCR analysis. As shown in Figure 3A and 3B, levels of both IGFBP5 and CAV-1 mRNA were attenuated to the extent of 4− and 2−fold, respectively, in CFPAC-1 cells because of exogenous expression of miR-375.
Figure 3.
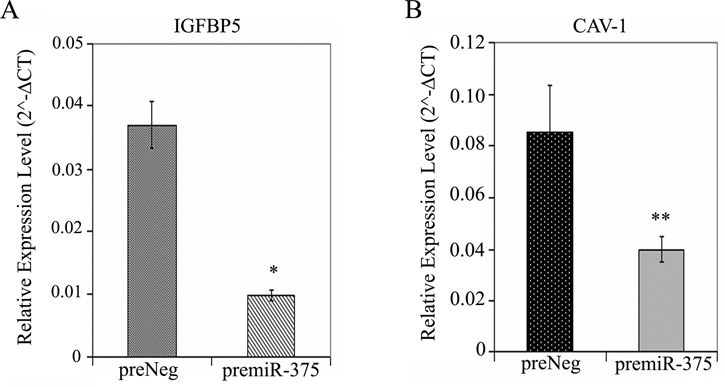
Inverse relationship between IGFBP5/CAV-1 gene expression and miR-375 level in pancreatic cancer cells. (A and B) TaqMan gene expression analysis. At 72 hours posttransfection with pre–miR-375 or respective negative control oligos, total RNA was isolated from CFPAC-1 cells, and comparative real-time qPCR was performed to quantitate the expression of IGFBP5 and CAV-1 genes using human GAPDH as control. Y-axis represents 2−ΔCT value. Data represent mean ± SD (n = 3). *P = 0.0003 and **P = 0.0133 (preNeg v. premiR-375).
Differential expression of putative tumor suppressor miR-375 and oncogenic miR-221 in nonpathological mouse pancreas and pancreas from PDX1-Cre+;KrasG12D+ mouse model
At present, it is generally accepted that PDACs arise from gradual progression of precursor lesions called pancreatic intraepithelial neoplasia (PanIN). The preclinical study of PanINs has recently been made possible by the generation of genetically modified animal models,29 which recapitulate human PanINs on genetic and histomorphological levels. In order to comprehend either the mechanism of action or the therapeutic potential of these miRNAs in pancreatic cancer, their expression levels need to be validated in a preclinical mouse model. For this purpose, in our laboratory, we developed PanIN in genetically engineered compound mutant mice29 by PDX1-Cre–mediated expression of a knockin mutant allele of KRAS with a glycine–to–aspartic acid substitution from its endogenous locus. The single Lox site left by excision recombination was detected by multiplex PCR30 as shown in Figure 4A. PCR of DNA isolated from the pancreas of mice crossed between LSL-KrasG12D and PDX1-Cre indicated the presence of the recombined allele (Fig. 4A, lanes 2 and 4). However, the recombined allele was correlatively present in the enlarged pancreas as presented in Figure 4B (panel II). Unrecombined mouse pancreas DNA neither contained rearranged allele (Fig. 4A, lanes 1 and 3) nor the enlarged pancreas (Fig. 4B, panel I). In addition, normal characteristics of the pancreas were present in these mice. Panels I and IV of Figure 4C demonstrate H&E staining of nonpathological pancreata with normal acinar structure, normal ducts, normal islets, and normal stroma. To the contrary, the pancreata of compound mutant mice could develop ductal lesions identical to all 3 stages of human PanINs. Panel II of Figure 4C indicates the presence of both PanIN1 and PanIN2 grades in the pancreas of mutant mice as evidenced by minimal to moderate nuclear atypia. In addition, these mice also developed PanIN3 lesions (Fig. 4C, panels III and V) as indicated by mitosis, enlarged pleomorphic nuclei, nuclear clearing with abnormal distribution of chromatin, nuclear angulation, and cribriform pattern (Fig. 4C, inset of panel III). Furthermore, in some regions of these pancreatic tissue sections, there was evidence of invasive ductal carcinoma (Fig. 4C, panel VI) as indicted by invasive islands (Fig. 4C, inset of panel VI) without basement membrane, invaded pancreatic stroma, and desmoplastic reaction.
Figure 4.
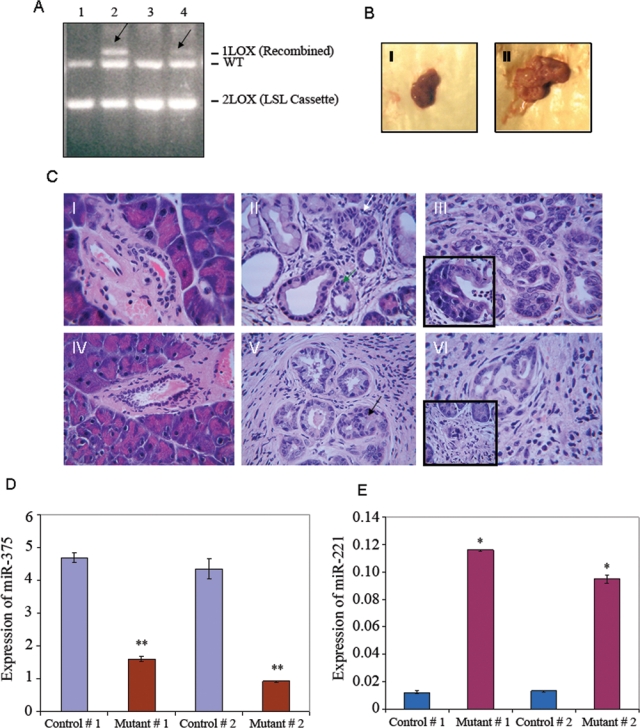
Alteration of levels of miR-221 and miR-375 in the pancreas of mice after targeted expression of KrasG12D. (A) Multiplex PCR of pancreatic DNA of 9-month-old control and PDX-1-Cre+;LSL-KrasG12D+ mice. Lanes 1 and 3: pancreas without rearranged allele (2 Lox); lanes 2 and 4: pancreas with recombined allele (1 Lox). Arrows indicate 650-bp recombined allele. (B) Pancreas from a 9-month-old PDX-1-Cre;LSL-KrasG12D mouse with recombined allele (II) is larger in size than a respective control (I). (C) Induction of PanINs and PDAC after targeted expression of KrasG12D in mouse pancreas. I-VI: H&E staining of paraffin-embedded pancreas tissue sections; I and IV: wild-type pancreas; II, III, V, and VI: pancreas of compound mutant mice; II: mPanIN1 (white arrow) and mPanIN2 (green arrow) lesions; III: mPanIN3 lesion (inset shows cribriform); V: mPanIN3 lesion (black arrow) with ductal carcinoma; VI: pancreatic adenocarcinoma (inset presents invasive island). (D and E) Quantitation of miR-375 and miR-221 by qRT-PCR in pancreas tissue of control and compound mutant mice. Relative amount of miRNAs was presented as 2−ΔCT value using SnoR135 as control. Columns: mean ± SD (n = 3). * and **P values < 0.0002 (control v. mutant).
Because the expression ratio of miR-221:miR-375 might be predictive for the progression of human cancer,28 we sought to determine the expression levels of these miRNAs in the abovementioned pancreatic cancer mouse model that recapitulate the human disease. As evident from Figure 4D, our qRT-PCR analysis clearly demonstrates significant diminishment (~3- to 4-fold) of miR-375 expression in PanINs when compared with a pancreas without any PanIN. To the other end, miR-221 expression was significantly higher (>10-fold) in PanIN than nonpathological controls (Fig. 4E). Our data on the expression of miR-221 and miR-375 are quite concordant with the findings in human pancreatic cancer patients. Indeed, the expression of miR-375 is decreased while the level of miR-221 is elevated in PanIN lesions when compared with a nonpathological pancreas.
Recapitulation of in vitro inverse relationship between miR-375 level and IGFBP5/CAV-1 expression in KrasG12D knockin mouse model
Because the expression of miR-375 is inversely related to the progression of pancreatic cancer in the mouse model (Fig. 4D) and its overexpression leads to downmodulation of potential biomarkers such as IGFBP5 and CAV-1 (Fig. 3A and 3B), we sought to determine the status of these genes in normal mouse pancreas and PanIN tissues. Interestingly enough, we observed that CAV-1 gene expression was significantly elevated in the pancreas of compound mutant mice with PanIN compared to controls (Fig. 5A). We also noted that Caveolin-1 protein is remarkably upregulated in mouse PanIN tissue (Fig. 5B, lanes 4-7) compared to nonpathological controls (Fig. 5B, lanes 1-3). Similarly, an elevated level of IGFBP5 protein is noted in mouse PanIN tissues (Fig. 5C, lanes 2, 4, and 5) compared to controls (Fig. 5C, lanes 1 and 3). Moreover, BITC indeed can downmodulate IGFBP5 protein in cultured pancreatic cancer cells. Cumulatively, it is apparent that both IGFBP5 and CAV-1 gene expression maintain an inverse relationship with miR-375. Our observation is in conformity to previous findings,35,36 which suggested the possible role of Caveolin-1 and IGFBP5 in pancreatic cancer cell growth and diagnosis.
Figure 5.
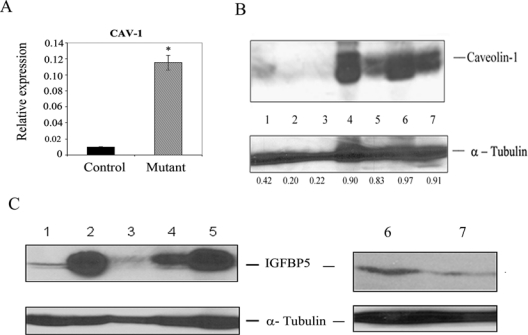
Level of CAV-1 gene and Caveolin-1/IGFBP5 proteins in mouse pancreatic tissues. (A) Quantitation of CAV-1 gene expression by qPCR in pancreas tissue of control and compound mutant mice using mouse GAPDH as reference. *P < 0.0001 (control v. mutant). (B and C) Measurement of Caveolin-1 (B) in mouse pancreatic tissues and IGFBP5 (C) proteins in mouse pancreatic tissues and in CFPAC-1 cells. Total proteins isolated from pancreata of mice or CFPAC-1 cells were subjected to immunoblot analysis using Caveolin-1 or IGFBP5 antibodies. (B) Lanes 1-3: pancreas with unrearranged allele (no PanIN lesion); lanes 4-7: pancreas with recombined allele demonstrating PanIN lesions. The bands of Caveolin-1 and tubulin in each lane were scanned, and the signals were quantitated13 using Scion Image for Windows software (Scion Corporation, Frederick, MD). The numbers beneath the bands of the tubulin panel represent the value of ratio between signal intensities of Caveolin-1 and tubulin. (C) Lanes 1 and 3: pancreas with unrearranged allele (no PanIN lesion); lanes 2, 4, and 5: pancreas with recombined allele demonstrating PanIN lesions; lanes 6 and 7: DMSO control and BITC-treated CFPAC-1 cells, respectively.
Discussion
The combined bioinformatics predictions on collected microarray data enabled scientists to hypothesize that miRNAs play an essential role in the biological processes necessary for the transformation of normal cells to malignancy. It has been shown, thus, that miRNAs behave as both tumor suppressors and oncogenic entities.1-8,37 In the present study, we report for the first time that the expression of putative oncogenic miRNAs such as miR-221 and tumor suppressor miR-375 can be altered upon BITC treatment of PDAC cells. Although miR-375 was initially shown to be expressed in pancreatic islets,38 it is worth mentioning that in situ analyses revealed its presence also in pancreatic ductal epithelium.39 In line with this, we also noted the expression of miR-375 in pancreatic ductal carcinoma cells, albeit at a lower extent. The lower threshold might be due to epigenetic inactivation of miR-375 gene as observed in the case of gastric carcinoma cells,40 and BITC might relieve this repression. Alternatively, it is tempting to speculate that BITC-mediated diverse signaling could be due to its interaction with the limited set of miRNAs. Similar to retinoic acid–mediated transcriptional regulation of let-7 miRNA,24 it is possible that BITC might modulate miR-375 or miR-221 expression through the alteration of transcription factor(s) binding to the upstream genomic region of these miRNAs. Future studies are warranted to investigate the interaction between BITC and miRNAs that might provide us with new insight regarding the anticancer effect of this multitarget compound.
Another important aspect of our investigation is the underexpression of miR-375 with simultaneous overexpression of miR-221 in KrasG12D-driven PanIN/PDAC developed in the pancreatic cancer mouse model. Indeed, our observation implicating the association between expression of miR-221 and miR-375 with the pancreatic cancer premalignant lesion PanIN is intriguing and should be further studied using human tissues from pancreatic tumors or chronic pancreatitis. Previous studies using archival pancreatic tumor tissues and pancreatic cancer cell lines have discovered a number of genetic as well as biochemical abnormalities, which are common in this carcinoma. In particular, mutations in the K-Ras oncogene at codon 12 (Gly to Asp) occur in 75% to 90% of pancreatic adenocarcinomas.30,41 The aberrant K-Ras signaling is thought to promote the neoplastic phenotype through the activation of a variety of cellular processes including cellular proliferation, survival, migration, and metabolism.42 At present, it is generally accepted that PDACs arise from gradual progression of precursor lesions, PanIN.29,43 The preclinical study of PanINs has recently been made possible by the generation of genetically modified animal models, which recapitulate human PanINs on a genetic and histomorphological level. Our observation indicating the decreased level of miR-375 in mPanIN or ductal carcinoma than the nonpathological mouse pancreas is quite concordant with previous findings, which documented underexpression of this miRNA in pancreatic cancer patients.5-7 Moreover, similar to pancreatic cancer patients, our qRT-PCR analysis revealed significant elevation of oncogenic miR-221 expression in the mouse pancreas with activated KrasG12D allele compared to normal pancreas. Interestingly, the exogenous expression of miR-375 or antagomir miR-221 significantly reduced pancreatic cancer cell viability. Notably, the ability of BITC to attenuate the expression of oncogenic miR-221 bears significance from a therapeutic standpoint because the prevailing data in the literature strongly argue that miR-221 influences cell proliferation/apoptotic pathways in a variety of cancer cells.12,31 Importantly, the manipulation of the level of miR-221 by forced expression of anti–miR-221 makes pancreatic cancer cells amenable to enhanced sensitivity to BITC. In this context, it is worth mentioning that similar increased sensitivity of pancreatic adenocarcinoma cells to gemcitabine was noted due to antisense inhibition of miR-221.44 In our studies, antagomir-mediated suppression of miR-221 resulted in a correlative upregulation of p27kip1, a regulator of cell cycle progression. Of note, a natural polyphenolic acid–mediated G2-M phase arrest of breast cancer cells45 was observed to be associated with upregulation of p27kip1. We and others have previously demonstrated the ability of BITC to induce G2-M arrest in pancreatic cancer cells.17,18 It is possible that BITC-mediated mitotic arrest might be the outcome of downregulation of miR-221 (Fig. 1B) and consequent stabilization of the cell cycle regulatory protein, p27kip1 (Fig. 1D). Previously, the oncogenic role of miR-221 was established by the discovery of its target mRNA, p27kip1.12 Indeed, in vivo upregulation of p27 by intratumoral knockdown of miR-221 and miR-222 in prostate tumor xenografts significantly reduces tumor growth.31 In line with our in vitro observation, a recent study also revealed that the expression of p27kip1 progressively decreased in patients with preneoplastic lesion PanIN and pancreatic cancer.46 The loss of p27 expression might be associated with an aggressive phenotype of human pancreatic cancer. In all, the significance of our observation entails in its reverse implications: that intervening miR-221 along with re-expression of miR-375 might be beneficial to reduce pancreatic tumor burden.
Although our studies suggest that re-expression of miR-375 provides an antiproliferative advantage to pancreatic cancer cells, the underlying mechanism is still unclear. Our gene expression microarray data revealed 593 genes to be upregulated or downregulated 1.5-fold or greater in miR-375 transfected cells. Among the downregulated genes, IGFBP5 and CAV-1 are of particular interest because of their potential link with the aggressiveness of pancreatic cancer.34,35 In this study, we have further documented that miR-375 overexpression reduces the IGFBP5 and CAV-1 mRNA levels in cultured pancreatic cancer cells. Future studies are required to elucidate whether these genes are a direct target of miR-375. Most likely, these molecules might be indirect targets of miR-375 because bioinformatics searches do not indicate that IGFBP5 and CAV-1 contain putative miR-375 binding sites in the 3′-UTR of these genes. Also, we cannot exclude the possibility that other mRNAs (listed in Table 1) downregulated by exogenous miR-375 could serve as candidate targets. Of note, bioinformatics studies (MicroRNA.org) predict mRNA-encoding mesoderm-specific transcription factor (MEST) as potential targets.
More importantly, we extended our in vitro studies to conditional KrasG12D pancreatic cancer mouse model. It is intriguing that the levels of both CAV-1 and IGFBP5 expression were elevated (Fig. 5A and 5B) when miR-375 expression wanes in pancreatic cancer lesions in compound mutant mice (Fig. 4D). The combination of genetic and protein analysis data presented in this report suggests that IGFBP5/CAV-1 expression might be developed as biomarkers during the progression of pancreatic neoplasm and be the potential molecular targets. Although our studies follow many interesting leads, future studies are definitely warranted to link the distorted expression of miR-375/miR-221 as well as IGFBP5/CAV-1/p27 with distinct PanIN grades.
To summarize, the translational relevance of our observation is 2-fold: 1) miR-221:miR-375 ratio might have an important implication in distinguishing PanIN from the normal pancreas; and 2) anticancer agent BITC might target to perturb this ratio to switch hyperproliferative pancreatic cancer cells to a hypoproliferative state (Fig. 6). Overall, our investigation directed to reprogram miRNA networks in pancreatic cancer holds the potential of elucidating important therapeutic targets.47
Figure 6.
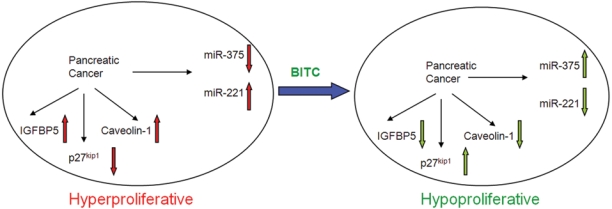
Schematic illustration of speculative cross-regulation between anticancer agent BITC and miR-375/miR-221 in pancreatic cancer. BITC exposure switches hyperproliferative pancreatic cancer cells to a hypoproliferative state by downmodulating oncogenic miR-221 and upregulating putative tumor suppressor miR-375. Elevated level of miR-375 is accompanied by diminished expression of IGFBP5 and Caveolin-1 (apparent biomarkers of pancreatic cancer). To the other end, miR-221 downregulation can induce the level of p27kip1 protein, which is a negative regulator of cell cycle. A concerted effect of BITC-mediated knockdown of miR-221 and elevation of miR-375 might be favorable for the inhibition of pancreatic cancer growth.
Materials and Methods
Cells and culture conditions
Human pancreatic adenocarcinoma cells BxPC-3 and CFPAC-1 were obtained from the American Type Culture Collection (ATCC, Manassas, VA) and maintained according to the protocols provided. Unless otherwise stated, CFPAC-1 and BxPC-3 cells were treated with 2.5 and 5 µM BITC (LKT Laboratories, St. Paul, MN), respectively, for 24 hours.
Development of mouse PanIN
Animal experiments were approved by the Institutional Animal Care and Use Committee of Case Western Reserve University. Conditional LSL-KrasG12D (+/−) (Strain code O1XJ6) and PDX-1-Cre (Strain code O1XL5) transgenic mouse strains were obtained from the National Cancer Institute Mouse Models of Human Cancers Consortium (NCI MMHCC, Frederick, MD). These mice were maintained as heterozygotes and genotyped according to the protocol provided by the MMHCC repository. To direct the mutation to pancreatic progenitor cells, LSL-KrasG12D mice, in which the KrasG12D mutation is silenced by a floxed STOP cassette, are crossed with PDX-1-Cre mice, which express Cre recombinase under the pancreas-specific promoter PDX-1.29 LSL-KrasG12D and PDX-1-Cre positive mice were crossed, and pancreata were harvested at 9 months. Each harvested pancreas was divided into 4 parts. For RNA isolation, one part was immersed in RNAlater solution (Ambion, Austin, TX), the second part was fixed in formalin, and the third and fourth parts were snap frozen for genotyping and protein extraction, respectively. For verification of Cre-mediated recombination, DNA isolated from the mouse pancreas was subjected to KrasG12D conditional multiplex PCR analysis using the following 3 primers flanking the Lox-STOP-Lox cassette30 (http://web.mit.edu/jacks-lab/protocols_table.html): primer 1: 5′ GTC TTT CCC CAG CAC AGT GC 3′; primer 2: 5′ CTC TTG CCT ACG CCA CCA GCT C 3′; and primer 3: 5′ AGC TAG CCA CCA TGG CTT GAG TAA GTC TGC A 3′. Thermal cycle conditions were 95°C for 2 minutes and then 34 cycles at 95°C for 30 seconds, 61°C for 30 seconds, and 72°C for 45 seconds, followed by 1 hold at 72°C for 10 minutes and cooled to 4°C. Wild-type KRAS, LSL cassette (unrearranged allele), and recombined allele (1 Lox) were detected as approximately 620 bp, 500 bp, and 650 bp, respectively. The successful recombination resulted in all 3 bands as PCR products. Five mice with a successful recombination event along with their littermate controls were used for this study.
Histological evaluation
Formalin-fixed paraffin-embedded tissues were sectioned (5 µm) and subjected to H&E staining. Subsequently, H&E-stained slides were examined blindfold by a pathologist to detect the presence of mPanIN lesions and PDAC. Pathological evaluations of mPanINs and PDAC were performed in accordance with the consensus criteria for mouse models of pancreatic cancer.29,43
Real-time reverse transcription PCR analysis
The expression of mature miRNAs and of U48 RNA, as housekeeping gene, was analyzed using TaqMan miRNA Assays (Applied Biosystems, Foster City, CA). Total RNA was isolated using Trizol reagent (Invitrogen, Carlsbad, CA) from control, BITC-treated cells as well as from harvested mouse pancreas tissue. Comparative real-time qPCR was performed in triplicates using 10 ng total RNA. The assays were performed on the real-time PCR detection system according to the manufacturer’s instructions. miRNA expression was measured using the CT (threshold cycle) method. CT values were normalized to the reference CT values for RNU48 (human)/SnoR135 (mouse), and relative expression levels were calculated using 2−ΔΔCT value, where ΔΔCT = ΔCT treated − ΔCT control and ΔCT = CT miRNA – CT reference.48
Transfection of miRNA oligos
Cells were plated at a density of 1.0 × 10⁵ cells/mL in T75 flasks and incubated overnight at 37°C.8 The following day, cells were transfected with 40 nM miR-221 miRIDIAN miRNA hairpin inhibitor (Dharmacon, Lafayette, CO) or 140 nM pre–miR-375 (Ambion) and their appropriate negative controls, using the DharmaFECT2 transfection reagent in accordance with the manufacturer’s protocol (Dharmacon).
Clonogenic cell survival assay
Control and BITC-treated transfected cells were seeded (20,000 cells/10-cm dish). The cells were allowed to grow for an additional 2 weeks. Medium was changed every 4 days. The cells were then fixed with 4% paraformaldehyde solution (Electron Microscopy Sciences, Hatfield, PA) and stained with crystal violet for visualization and photography.27,32
Western blot analysis
Immunoblotting was performed with p27kip1 (BD Biosciences, Franklin Lakes, NJ), Caveolin-1 (R&D Systems, Minneapolis, MN), and IGFBP5 (Cayman Chemical, Ann Arbor, MI) primary antibodies as described previously.8,13,14,16 Immunodetection with β-actin or α-tubulin antibody (Sigma, St. Louis, MO) served as a protein loading control.
Comparative gene expression analysis
Total RNA was extracted from control and pre–miR-375 transfected CFPAC-1 cells. Approximately 1 µg of total RNA was amplified in preparation for use on the latest vintage of Affymetrix Whole Transcript ST 1.0 Microarray (Santa Clara, CA). Affymetrix kits and protocols were used throughout the sample preparation process. Briefly, 1 µg of RNA was reverse transcribed using random primers and SuperScript II enzyme (Invitrogen). Second-strand synthesis was carried out using RNase H and DNA polymerase I enzymes. A second round of first-strand cDNA synthesis followed by cRNA synthesis was carried out yielding cRNA/cDNA hybrids. The cRNA is hydrolyzed, and the cDNA is cleaned up. Single-stranded cDNA is then fragmented and labeled. Labeled cDNA was added with carrier molecules, buffers, and control spikes to make a hybridization cocktail. Samples were hybridized to Affymetrix human ST 1.0 arrays containing more than 33,000 probe sets. Expression signals were generated using proprietary software algorithms contained within Affymetrix Expression Console (EC) software. Criteria for changed expression were 3-fold, as follows: 1) data were subjected to quantile normalization using an EC feature called robust multichip analysis (RMA); 2) data were exported from EC as tab-delimited text files containing log2-transformed signals, and signal log ratios were generated between binary paired files, and these were converted into fold changes; and 3) data were imported into Microsoft Access (Redmond, WA) and queried for fold changes whose absolute values were greater than or equal to 1.5. Select genes that met these criteria were imported into PathwayStudio 6.0 (Ariadne Genomics, Rockville, MD). Functional annotation groupings were assigned to the list of imported genes. A Fisher test was employed to assess whether the imported list constituted an enrichment in the number of representatives of the annotation groups that might be expected from random selection of probe identifications. These listings were trimmed based upon 3 criteria: 1) for P value, a cutoff of 0.05 was used; 2) number of genes from a particular category had to be ≥2; and 3) subjective cut based on the process that is pertinent to this study.
TaqMan gene expression assay
All reagents, primers, and probes (predesigned, preoptimized) were obtained from Applied Biosystems. GAPDH was used to normalize all RNA samples. Reverse transcriptase reactions and real-time PCR were performed according to the manufacturer’s protocols. All RT reactions, including no-template controls and RT-minus controls, were run in a GeneAmp PCR 9700 Thermocycler (Applied Biosystems). Gene expression levels were quantified using the ABI Prism 7900HT Sequence detection system (Applied Biosystems). Comparative real-time PCR was performed in triplicate, including no-template controls. Relative expression was calculated using the comparative CT method.
Supplementary Material
Acknowledgments
The authors thank B. Smith and K. Haas for technical assistance. They also thank the members at the Histology and Gene Expression Microarray Core Facilities of Case Comprehensive Cancer Center.
Footnotes
The author(s) declared no potential conflicts of interest with respect to the authorship and/or publication of this article.
This work was supported by the National Institutes of Health [grant numbers CA137476 (A. Basu), CA109181, CA149785 (S. Haldar)].
References
- 1. Bartel DP. MicroRNAs: genomics, biogenesis, mechanism, and function. Cell. 2004;116:281-97 [DOI] [PubMed] [Google Scholar]
- 2. Croce CM. Causes and consequences of microRNA dysregulation in cancer. Nat Rev Genet. 2009;10:704-14 [DOI] [PMC free article] [PubMed] [Google Scholar]
- 3. Negrini M, Nicoloso MS, Calin GA. MicroRNAs and cancer: new paradigms in molecular oncology. Curr Opin Cell Biol. 2009;21:470-9 [DOI] [PubMed] [Google Scholar]
- 4. Dalmay T, Edwards DR. MicroRNAs and the hallmarks of cancer. Oncogene. 2006;25:6170-5 [DOI] [PubMed] [Google Scholar]
- 5. Bloomston M, Frankel WL, Petrocca F, et al. MicroRNA expression patterns to differentiate pancreatic adenocarcinoma from normal pancreas and chronic pancreatitis. JAMA. 2007;297:1901-8 [DOI] [PubMed] [Google Scholar]
- 6. Szafranska AE, Davison TS, John J, et al. MicroRNA expression alterations are linked to tumorigenesis and non-neoplastic processes in pancreatic ductal adenocarcinoma. Oncogene. 2007;26:4442-52 [DOI] [PubMed] [Google Scholar]
- 7. Lee EJ, Gusev Y, Jiang J, et al. Expression profiling identifies microRNA signature in pancreatic cancer. Int J Cancer. 2007;120:1046-54 [DOI] [PMC free article] [PubMed] [Google Scholar]
- 8. Basu A, Jiang X, Negrini M, Haldar S. MicroRNA-mediated regulation of pancreatic cancer cell proliferation. Oncol Lett. 2010;1:565-8 [DOI] [PMC free article] [PubMed] [Google Scholar]
- 9. Kent OA, Mendell JT. A small piece in cancer puzzle: microRNAs as tumor suppressors and oncogenes. Oncogene. 2006;25:6188-96 [DOI] [PubMed] [Google Scholar]
- 10. Cimmino A, Calin GA, Fabri M, et al. miR-15 and miR-16 induce apoptosis by targeting BCL2. Proc Natl Acad Sci U S A. 2005;102:13944-9 [DOI] [PMC free article] [PubMed] [Google Scholar]
- 11. Zhao JJ, Lin J, Yang H, et al. MicroRNA-221/222 negatively regulates estrogen receptor α and is associated with tamoxifen resistance in breast cancer. J Biol Chem. 2008;283:31079-86 [DOI] [PMC free article] [PubMed] [Google Scholar] [Retracted]
- 12. Fornari F, Gramantieri L, Ferracin M, et al. miR-221 controls CDKN1C/p57 and CDKN1B/p27 expression in human hepatocellular carcinoma. Oncogene. 2008;27:5651-61 [DOI] [PubMed] [Google Scholar]
- 13. Basu A, Castle VP, Bouziane M, Bhalla K, Haldar S. Crosstalk between extrinsic and intrinsic cell death pathways in pancreatic cancer: synergistic action of estrogen metabolite and ligands of death receptor family. Cancer Res. 2006;66:4309-18 [DOI] [PubMed] [Google Scholar]
- 14. Qanungo S, Das M, Haldar S, Basu A. Epigallocatechin-3-gallate induces mitochondrial membrane depolarization and caspase-dependent apoptosis in pancreatic cancer cells. Carcinogenesis. 2005;26:958-67 [DOI] [PubMed] [Google Scholar]
- 15. Dhar A, Mehta S, Dhar G, et al. Crocetin inhibits pancreatic cancer cell proliferation and tumor progression in a xenograft mouse model. Mol Cancer Ther. 2009;8:315-23 [DOI] [PubMed] [Google Scholar]
- 16. Basu A, Haldar S. 2-Methoxyestradiol mediated signaling network in pancreatic cancer. Front Biosci. 2009;14:2170-8 [DOI] [PubMed] [Google Scholar]
- 17. Basu A, Haldar S. Dietary isothiocyanate mediated apoptosis of human cancer cells is associated with Bcl-xL phosphorylation. Int J Oncol. 2008;33:657-63 [PubMed] [Google Scholar]
- 18. Srivastava SK, Singh SV. Cell cycle arrest, apoptosis induction and inhibition of nuclear factor kappa B activation in anti-proliferative activity of benzyl isothiocyanate against human pancreatic cancer cells. Carcinogenesis. 2004;25:1701-9 [DOI] [PubMed] [Google Scholar]
- 19. Blower PE, Chung J-H, Verducci JS, et al. MicroRNAs modulate the chemosensitivity of tumor cells. Mol Cancer Ther. 2008;7:1-9 [DOI] [PubMed] [Google Scholar]
- 20. Dai Z, Barbacioru C, Huang Y, Sadee W. Prediction of anticancer drug potency from expression of genes involved in growth factor signaling. Pharm Res. 2006;23:336-49 [DOI] [PubMed] [Google Scholar]
- 21. Dai Z, Huang Y, Sadee W. Growth factor signaling and resistance to cancer chemotherapy. Curr Top Med Chem. 2004;4:1347-56 [DOI] [PubMed] [Google Scholar]
- 22. Sun M, Estrov Z, Ji Y, et al. Curcumin (diferuloylmethane) alters the expression profiles of microRNAs in human pancreatic cancer cells. Mol Cancer Ther. 2008;7:464-73 [DOI] [PubMed] [Google Scholar]
- 23. Scott GK, Mattie MD, Berger CE, et al. Rapid alteration of microRNA levels by histone deacetylase inhibition. Cancer Res. 2006;66:1277-81 [DOI] [PubMed] [Google Scholar]
- 24. Garzon R, Pichiorri F, Palumbo T, et al. MicroRNA gene expression during retinoic acid-induced differentiation of human acute promyelocytic leukemia. Oncogene. 2007;26:4148-57 [DOI] [PubMed] [Google Scholar]
- 25. Weidhaas JB, Babar I, Nallur P, et al. MicroRNAs as potential agents to alter resistance to cytotoxic anticancer therapy. Cancer Res. 2007;67:11111-6 [DOI] [PMC free article] [PubMed] [Google Scholar]
- 26. Tsang WP, Kwok TT. Epigallocatechin gallate up-regulation of miR-16 and induction of apoptosis in human cancer cells. J Nutr Biochem. 2010;21:140-6 [DOI] [PubMed] [Google Scholar]
- 27. Basu A, Haldar S. Antiproliferative and proapoptotic effects of benzyl isothiocyanate on human pancreatic cancer cells is linked to death receptor activation and RasGAP/Rac1 down modulation. Int J Oncol. 2009;35:593-9 [DOI] [PubMed] [Google Scholar]
- 28. Avissar M, Christensen BC, Kelsey KT, et al. MicroRNA expression is predictive of head and neck squamous cell carcinoma. Clin Cancer Res. 2009;15:2850-5 [DOI] [PMC free article] [PubMed] [Google Scholar]
- 29. Hingorani SR, Petricoin EF, Maitra A, et al. Preinvasive and invasive ductal pancreatic cancer and its early detection in the mouse. Cancer Cell. 2003;4:437-50 [DOI] [PubMed] [Google Scholar]
- 30. Gidekel Friedlander SY, Chu GC, Snyder EL, et al. Context-dependent transformation of adult pancreatic cells by oncogenic K-Ras. Cancer Cell. 2009;16:379-89 [DOI] [PMC free article] [PubMed] [Google Scholar]
- 31. Mercatelli N, Coppola M, Bonci D, et al. The inhibition of the highly expressed miR-221 and miR-222 impairs the growth of prostate carcinoma xenografts in mice. PLoS One. 2008;3:1-10 [DOI] [PMC free article] [PubMed] [Google Scholar]
- 32. Munshi A, Hobbs M, Meyn RE. Clonogenic cell survival assay. Methods Mol Med. 2005;110:21-8 [DOI] [PubMed] [Google Scholar]
- 33. Williams TM, Lisanti MP. Caveolin-1 in oncogenic transformation, cancer, and metastasis. Am J Physiol Cell Physiol. 2005;288:C494-506 [DOI] [PubMed] [Google Scholar]
- 34. Beattie J, Allan GJ, Lochrie JD, Flint DJ. Insulin-like growth factor-binding protein-5 (IGFBP-5): a critical member of the IGF axis. Biochem J. 2006;395:1-19 [DOI] [PMC free article] [PubMed] [Google Scholar]
- 35. Tanase CP. Caveolin-1: a marker for pancreatic cancer diagnosis. Expert Rev Mol Diagn. 2008;8:395-404 [DOI] [PubMed] [Google Scholar]
- 36. Johnson SK, Haun RS. Insulin-like growth factor binding protein-5 influences pancreatic cancer cell growth. World J Gastroenterol. 2009;15:3355-66 [DOI] [PMC free article] [PubMed] [Google Scholar]
- 37. Steele R, Mott JL, Ray RB. MBP-1 upregulates miR-29b, which represses Mcl-1, collagens, and matrix metalloproteinase-2 in prostate cancer cells. Genes Cancer. 2010;1:381-7 [DOI] [PMC free article] [PubMed] [Google Scholar]
- 38. +Poy MN, Eliasson L, Krutzfeldt J, et al. A pancreatic islet-specific microRNA regulates insulin secretion. Nature. 2004;432;226-30 [DOI] [PubMed] [Google Scholar]
- 39. Lynn FC, Skewes-Cox P, Kosaka Y, et al. MicroRNA expression is required for pancreatic islet cell genesis in the mouse. Diabetes. 2007;56:2938-45 [DOI] [PubMed] [Google Scholar]
- 40. Tsukamoto Y, Nakada C, Noguchi T, et al. MicroRNA-375 is downregulated in gastric carcinomas and regulates cell survival by targeting PDK1 and 14-3-3ζ. Cancer Res. 2010;70:2339-49 [DOI] [PubMed] [Google Scholar]
- 41. Jones S, Zhang X, Parsons DW, et al. Core signaling pathway in human pancreatic cancers revealed by global genomic analyses. Science. 2008;321:1801-6 [DOI] [PMC free article] [PubMed] [Google Scholar]
- 42. Shields JM, Pruitt K, McFall A, et al. Understanding Ras: ‘it ain’t over till it’s over’. Trends Cell Biol. 2000;10:147-54 [DOI] [PubMed] [Google Scholar]
- 43. Hruban RH, Adsay NV, bores-Saavedra J, et al. Pathology of genetically engineered mouse models of pancreatic exocrine cancer: consensus report and recommendations. Cancer Res. 2006;66:95-106 [DOI] [PubMed] [Google Scholar]
- 44. Park JK, Lee EJ, Esau C, et al. Antisense inhibition of microRNA-21 or -221 arrests cell cycle, induces apoptosis, and sensitizes the effects of gemcitabine in pancreatic adenocarcinomas. Pancreas. 2009;38:190-9 [DOI] [PubMed] [Google Scholar]
- 45. Hsu JD, Kao SH, Ou TT, et al. Gallic acid induces G2/M phase arrest of breast cancer cell MCF-7 through stabilization of p27 (kip1) attributed to disruption of p27(Kip1)/Skp2 complex. J Agric Food Chem. Epub 2011 Feb 7 [DOI] [PubMed] [Google Scholar]
- 46. Karamitopolou E, Zlobec I, Tomillo L, et al. Differential cell cycle and proliferation marker expression in ductal pancreatic adenocarcinoma and pancreatic intraepithelial neoplasia (PanIN). Pathology. 2010;42:229-34 [DOI] [PubMed] [Google Scholar]
- 47. Garzon R, Marcucci G, Croce CM. Targeting microRNAs in cancer: rationale, strategies and challenges. Nat Rev Drug Discov. 2010;9:775-89 [DOI] [PMC free article] [PubMed] [Google Scholar]
- 48. Livak KJ, Schmittgen TD. Analysis of relative gene expression data using real-time quantitative PCR and the 2[-Delta Delta C[T]] method. Methods. 2001;25:402-8 [DOI] [PubMed] [Google Scholar]
Associated Data
This section collects any data citations, data availability statements, or supplementary materials included in this article.