Abstract
An all-by-all comparison of all the publicly available protein sequences from plants has been performed, followed by a clusterization process. Within each of the 1064 resulting clusters—containing sequences that are orthologous as well as paralogous—the sequences have been submitted to a pyramidal classification and their domains delineated by an automated procedure à la PRODOM. This process provides a means for easily checking for any apparent inconsistency in a cluster, for example, whether one sequence is shorter or longer than the others, one domain is missing, etc. In such cases, the alignment of the DNA sequence of the gene with that of a close homologous protein often reveals (in 10% of the clusters) probable sequencing errors (leading to frameshifts) or probable wrong intron/exon predictions. The composition of the clusters, their pyramidal classifications, and domain decomposition, as well as our comments when appropriate, are available from http://chlora.infobiogen.fr:1234/PHYTOPROT.
At this time, the current version of the GOLD database (Kyrpides 1999) reports sequencing projects in no less than 33 eukaryotic genomes (including the human and mouse genomes), among which four are now completed. The sequencing of eight genomes from plants is currently in progress, whereas that of Arabidopsis thaliana has been recently released (The Arabidopsis Genome Initiative 2000). As is well known, the precise annotation of eukaryotic sequences, and in particular the identification of their genes, is a difficult task because of the segmentation of genes into exons and introns. In the case of A. thaliana for example, detailed comparisons of several gene prediction programs (Pavy et al. 1999; Rouzé et al. 1999) indicated clearly that a fully automated procedure for the annotation of genomic sequences remains a remote goal.
One simple and obvious way to help predict a eukaryotic gene structure is to compare its sequence with that of a homologous protein (Birney et al. 1996; Halperin et al. 1999; Gotoh 2000) or cDNA (Mott 1997; Florea et al. 1998) or with protein profiles and hidden Markov model profiles (Birney and Durbin 2000; Gotoh 2000). Because protein sequences are better conserved than their genomic counterparts, it is probably more efficient to align the genomic sequence of interest with protein(s) rather than cDNA(s). In such a case, it is clearly essential to find orthologous and/or paralogous protein sequences that are as close as possible to the probe, which can be easily performed through a BLAST or PSI-BLAST search (Altschul et al. 1997). If, however, the study aims at a systematic checking of numerous gene sequences whose structures have been automatically predicted with programs such as GENEMARK (Bodorovsky and McIninch 1993; Lukashin and Bodorovsky 1998) or GENSCAN (Burge and Karlin 1997), then some kind of automation becomes necessary. This automation can be achieved—at least partly—by considering the modular nature of proteins. The fact that most proteins are built up of domains is amply documented, and several databases have been set up to try and build a consistent classification of protein domains (Sonnhammer and Kahn 1994; Sonnhammer et al. 1997; Gracy and Argos 1998; Apweiler et al. 2000). Suppose that we have at hand: (1) a collection of conceptual protein sequences, that is, protein sequences derived from the translation of predicted genes; (2) a series of clusters where each cluster contains a probe sequence of collection 1 and other protein sequences similar—and presumably homologous—to that very sequence, and (3) for each cluster, a decomposition of its sequences into domains. Then it is easy to compare the domain structure of the probe sequence with that of its homologs. If the gene prediction is erroneous or if its sequence is not correct (e.g., one or more exons missing, errors leading to a frameshift and a premature stop codon) then the domain pattern of the probe sequence will be different from that of its closest homologs, which will suggest further examination of the gene sequence—for instance by aligning it with an homologous protein sequence. Clearly, there will be cases in which the differences in the domain patterns are genuine (e.g., see Gouzy et al. 1999) but, as will be shown, this simple procedure proved to be efficient in pinpointing probable sequence or annotation errors in genomic sequences from plants.
In the work reported here, we proceeded in five successive steps: (1) All the protein sequences from plants were extracted from SwissProt release 37 and TrEMBL release 9, those annotated as fragments being excluded; (2) an all-by-all comparison of these sequences was performed with the program LASSAP (Glemet and Codani 1997) by use of the Smith-Waterman algorithm (Smith and Waterman 1981); (3) clusters of orthologs and paralogs were built through a single-linkage procedure, based on a pairwise Z-value threshold (Comet et al. 1999); (4) in each cluster, the sequences were classified by means of the pyramidal algorithm (Aude et al. 1999) and their domains delineated with the program XDOM (Gouzy et al. 1997); (5) each cluster was finally checked individually for inconsistencies in the domain patterns; if a protein looked suspect, the DNA sequence of its predicted gene was aligned with its closest homologous protein sequence with the program FRAMEALIGN from the GCG suite. When the alignment pointed to a probable sequencing or annotation error, a comment was added in the header of the cluster. On the whole, ∼10% of the clusters contain such a comment.
A user-friendly interface has been developed to enable interested users to browse among the clusters, display the pyramidal classifications or the domain decompositions and have access to the above comments. It is accessible from http://chlora.infobiogen.fr:1234/PHYTOPROT.
RESULTS AND DISCUSSION
Clusters of Orthologs and Paralogs
The all-by-all comparison of 14,723 protein sequences from plants (SwissProt 37 and TrEMBL 9) followed by a single-linkage clustering step (see Methods) resulted in the production of 1064 clusters containing two proteins or more. As already observed in similar studies on other organisms (Tatusov et al. 1997; Yona et al. 1998; e.g., see http://www.protomap.cs.huji.ac.il) the largest cluster (1437 proteins) is most heterogeneous and is built up mainly by proteins such as kinases and ATP-binding proteins. The second largest cluster (327 members) contains proteins that are more specific to plants such as napin, mabinlin, cruciferin, glutelin, and other seed-storage proteins.
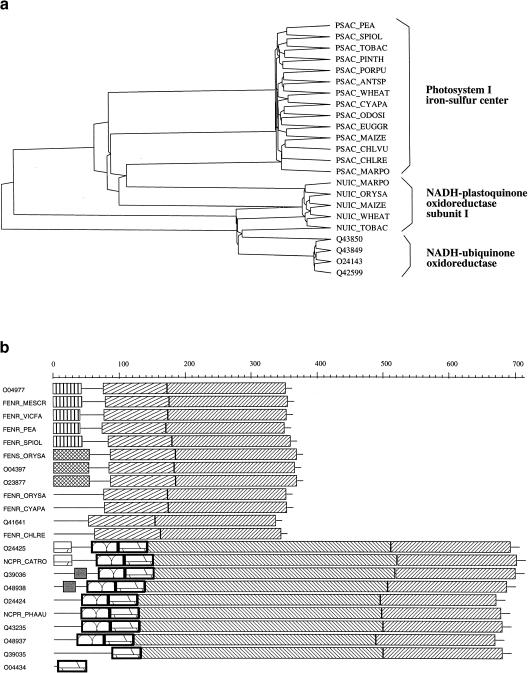
The pyramidal classification (Aude et al. 1999) and the domain decomposition (Gouzy et al. 1997) in each cluster proved of definite help in breaking some clusters into subfamilies. As an example, cluster 119 is composed of 23 proteins that all belong to the so-called 4Fe-4S bacterial-type ferredoxin family. Their pyramidal classification (Fig. 1a) enables a clear partitioning into three coherent subfamilies. It may happen, however, that all the pairwise Z-scores within a cluster are so high that the pyramid is totally flat, even if the proteins belong to different subfamilies. In such a case, the domain patterns of the proteins are often useful for delineating subfamilies; this is exemplified by Figure 1b, which shows that cluster 130 is actually composed of two subfamilies. In such cases, we added a comment in the header of the cluster. Note that in those clusters that contain multidomain proteins, a given protein may well belong simultaneously to two or more subfamilies. We intend to address this problem by using a procedure such as GeneRAGE (Enright and Ouzounis 2000) in forthcoming releases of PHYTOPROT.
Figure 1.
(a) Pyramidal classification of 23 proteins that belong to the 4Fe-4S bacterial-type ferredoxin family (cluster 119). The classification enables a clear partitioning into three coherent families. (b) Schematic representation of the various domains found in cluster 130 as displayed by XDOM. Two subfamilies are clearly recognizable. (Top) Ferredoxin-NADP reductase subfamily; (bottom) NADPH-cytochrome P450 reductase subfamily. Sequence O04434 was a fragment and not labeled as such in TrEMBL.
The complete sequencing of the A. thaliana genome has been released (The Arabidopsis Genome Initiative 2000), and it is premature to discuss in detail the content and the features of the clusters. From now on, rather, we shall focus on the fact that such clusters are useful to pinpoint probable sequencing or annotation errors.
Search for Anomalies within Clusters
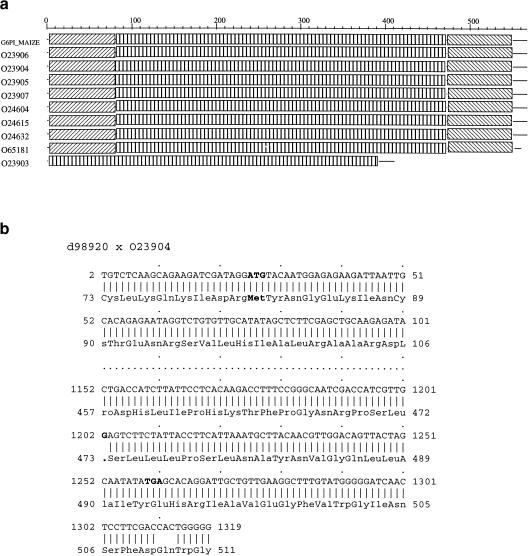
One obvious case of concern occurs when one sequence in a given cluster is much shorter (or longer) than its orthologs (or paralogs). Such a situation is shown at the bottom of Figure 1b where O04434 is clearly an outsider. This particular case is trivial and happened simply because O04434 was a fragment and not labeled as such in TrEMBL (its complete sequence is now available in the last release of SPTrEMBL). A more interesting and more common situation is depicted in Figure 2a. Here the cluster (108) is composed exclusively of glucose-6-phosphate isomerases, a multigenic family in which all the proteins are extremely similar (only part of the cluster is shown here, see http://chlora.infobiogen.fr:1234/PHYTOPROT for a complete description). It appears that the conceptual protein trembl:023903 lacks both its amino and carboxyl termini. An alignment of its cDNA sequence (embl: d98920) with the protein sequence O23904 (Fig. 2b) reveals two points of interest: (1) the first ATG codon of embl:d98920 at position 26 corresponds to Met-81 of trembl:O23904, whereas the short nucleotide sequence upstream of this ATG aligns perfectly with the corresponding amino-terminal sequence of 023904. Thus it is highly probable that the cDNA embl:d989020 is truncated at it 5′ end. In addition, the 3′ end of the cDNA aligns perfectly with the carboxy-terminal sequence of O23904 provided that the G at position 1202 is removed. Thus, G1202 is probably a sequencing error that results in a false TGA stop codon and a premature ending of the protein. Of course, it is possible that the sequence may be correct and correspond to a pseudogene. Whatever the conclusion, a re-examination of the genomic sequence seems appropriate.
Figure 2.
(a) Partial XDOM representation of cluster 108. The protein O23903 seems to lack both its amino and carboxyl termini. (b) Alignment of the cDNA sequence of O23903 (embl:d98920) with O23904. The short nucleotide sequence upstream of the nucleotide sequence ATG aligns perfectly with the amino terminus of O23904. By removal of the G 1202 nucleotide, the cDNA aligns perfectly with the carboxyl terminus of O23904.
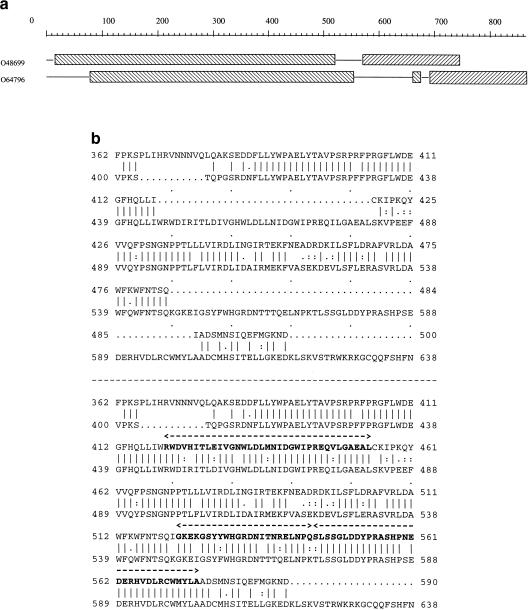
The decomposition of the proteins into domains also enables the visualization of probable false intron/exon predictions. In a cluster (864) composed of two hypothetical sequences from A. thaliana that are decomposed by XDOM into two main domains (Fig. 3a), the distance between these domains in O48699 is shorter than that in O64796. The alignment of the two conceptual protein sequences (Fig. 3b, top) indeed shows two long insertions in O64796. These insertions, however, almost perfectly match three ORFs in the gene sequence of O48699 (Fig. 3b, bottom) that were considered as being part of introns. Here, it is highly probable that three exons have been missed by the prediction program in the gene sequence of O48699.
Figure 3.
(a) XDOM representation of cluster 864. The distance between the two main domains is shorter in O48699 than in O647965. (b) The protein alignment shows two long insertions in O64796. The prediction programs have probably missed three exons in the gene sequence of O48699 as explained in the text (the missing exons are shown in boldface).
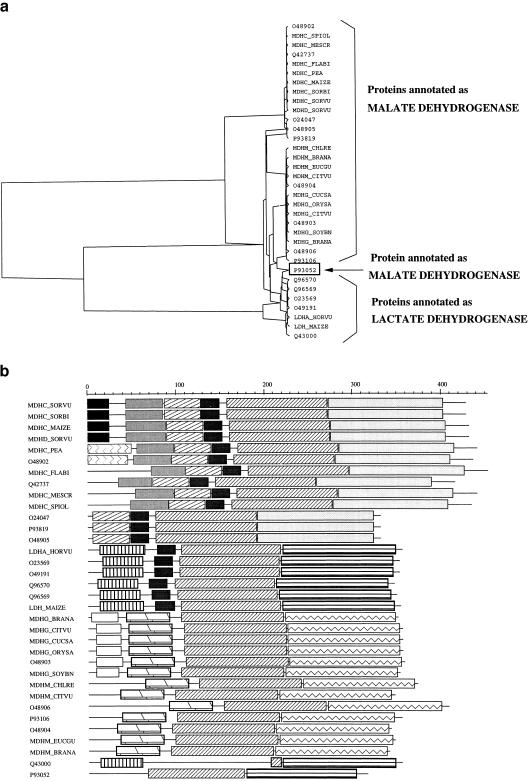
Some of the clusters are more complex and in such cases, both the pyramidal and domain representations can be useful to pinpoint doubtful automatic annotation. For example, cluster 76 is composed of 34 proteins (27 malate dehydrogenases and 7 lactate dehydrogenases). The two representations (Fig. 4a,b) show three subfamilies: Two of them contain malate dehydrogenases, and the third contains the lactate dehydrogenases. As shown by the pyramidal classification, the protein P93052 annotated as a malate dehydrogenase is in fact classified within the lactate dehydrogenase subfamily. Apparently it makes the link between the two subsets. The XDOM representation reveals that its carboxyl terminus is also similar to that of the lactate dehydrogenase subfamily. Indeed, a BLAST comparison of P93052 against the nr databank at NCBI shows that the first seven hits are proteins annotated as malate dehydrogenase which probably explains the genomic (and TrEMBL) annotation. However, it should be noted that these seven proteins come from prokaryotic organisms, whereas all the significant hits with eukaryotic proteins are indeed annotated as lactate dehydrogenases. Therefore, we suggest that the protein P93052 is in fact a (eukaryotic) lactate dehydrogenase, not a (prokaryotic) malate dehydrogenase.
Figure 4.
(a) Pyramidal classification of cluster 76 composed of 27 proteins annotated as malate dehydrogenases and 7 as lactate dehydrogenases. P93052 makes the link between the two subsets. (b) The domain decomposition of the proteins also classifies P93052 (bottom) as a lactate dehydrogenase.
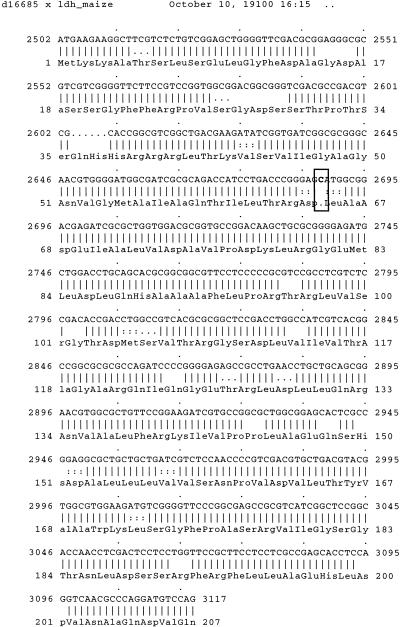
The XDOM representation (Fig 4b) shows another anomaly. The protein Q43000 seems to lack two inner domains that are present in other proteins of the same subfamily. The cDNA (embl: d16685) of Q43000 aligns perfectly with the protein LDH MAIZE except for an extra base at position 2688 (Fig. 5). The resulting frameshift, however, does not lead to a stop codon up to the end of the first exon. Thus, the resulting conceptual protein has the same length as the others, but not the same domains. This example shows a probable sequencing error that is certainly hardly detected by automated procedures.
Figure 5.
The cDNA of Q43000 (embl:d16685) aligns perfectly with the protein LDH MAIZE except for an extra base at position 2688. This frameshift explains the difference between the two proteins (see Fig. 4b).
Although the above three examples are characteristic, we found a number of other discrepancies within the clusters. On the whole, ∼10% of the clusters deserved a comment. Most of them point to probable truncations at the 5′ or 3′ extremities of the predicted genes (resulting from incomplete cDNAs or frameshifts), the others occur mainly from probable intron/exon prediction errors. All the clusters, their pyramidal classification, their domain patterns, and our comments on possible errors are available from http://chlora.infobiogen.fr:1234/PHYTOPROT.
Conclusion
Although the use of protein similarities to help gene prediction is not new, here, we show that systematic protein sequence comparisons and single-linkage clusterings supplemented by a graphical representation of the domains that compose the proteins provide a valuable tool to pinpoint probable errors in gene annotations. The procedure, admittedly, is not fully automatic as each cluster and its domain pattern must be examined individually, but we do not know of any safe and sound automated protocol to annotate correctly a genomic sequence.
Although the PHYTOPROT database should prove useful for the annotation of plant genomes—particularly that of A. thaliana—the present release is outdated and needs an update. Some of the comments we made are now irrelevant because the predicted errors were corrected in databank entries (satisfactorily enough, all the corrections that have been made are consistent with our annotations). In December 2000, the sequence of the A. thaliana genome became available (The Arabidopsis Genome Initiative 2000). Altogether, the five chromosomes are predicted to contain ∼25,500 genes. In addition, the SWALL databank from EBI (www.ebi.ac.uk) holds ∼20,000 nonpartial protein sequences from plants. The all-by-all comparisons of these 45,000 sequences, requiring 109 pairwise alignments (a highly CPU-demanding and lengthy process), is currently being undertaken at the Infobiogen resource center. The resulting clusters, their pyramidal classifications, and the domain decompositions of the proteins will be made available to the community as soon as possible (www.infobiogen.fr). The users will be given the choice to query either the Arabidopsis × Arabidopsis clusters (all-by-all comparisons of only the A. thaliana sequences) or the plants × plants clusters (all-by-all comparisons of the currently available 45,000 sequences from plants, including A. thaliana). In addition, we shall develop an interface allowing the comparison between a new protein sequence and the cluster database, together with the automatic visualization of its classification and domain decomposition within the cluster it belongs to if appropriate.
METHODS
The all-by-all comparison of 14,723 protein sequences from plants was performed with the package LASSAP (Glemet and Codani 1997) using its parallelized version of the Smith-Waterman algorithm and run on a multiprocessor SUN Sparc server 4500.
For each pairwise comparison, a conservative estimate of its Z-value (Lipman et al. 1984) was computed as described by Comet et al. (1999). Briefly, let Z(A,B) be the Z-value for two sequences A and B where A was the sequence that was shuffled during the Monte-Carlo process, and Z(B,A) the Z-value in which B was shuffled. In principle, Z(A,B) and Z(B,A) should be equal or at least close to one another. In some cases, however, particularly when one of the two sequences has a biased amino-acid composition, Z(A,B) can be largely different from Z(B,A). Therefore, our conservative approach was to systematically calculate Z(A,B) and Z(B,A) for each pairwise comparison and to keep Z‘(A,B) = min[Z(A,B),Z(B,A)] as the Z-value.
Each sequence in a given cluster is linked to at least another sequence in the same cluster by a Z-value greater than a given threshold. Therefore, the choice of the threshold value is of critical importance. Following a previous study of five complete genomes (Comet et al. 1999), the Z-value threshold was set to 14. The connective clusters, however, can be easily and quickly rebuilt with other thresholds if necessary. In addition, the use of a threshold makes sense only if the Z-values are known with sufficient accuracy, which will itself depend on the number N of sequence shufflings. Here we used the fact that the standard deviation of Z can be estimated by the relation ς(Z) = k.Z.N−1/2 (Comet et al. 1999). For each comparison, the number of shufflings was accordingly adjusted so that ς(Z) > 1.3. As a consequence, the number of shufflings N varied between 30 (Z < 6) and 600 (Z > 30) (Aude 1999).
The pyramidal classifications were computed and drawn with the programs available from http://www.genetique.uvsq.fr/Pyramids. The domain representations of the sequences were obtained through XDOM, available from http://protein.toulouse.inra.fr/prodom/xdom/welcome.html.
Acknowledgments
We are indebted to Drs. J.J. Codani and E. Glemet for their participation in the massive sequence comparisons and to J. Gouzy for useful discussions about XDOM.
The publication costs of this article were defrayed in part by payment of page charges. This article must therefore be hereby marked “advertisement” in accordance with 18 USC section 1734 solely to indicate this fact.
Footnotes
E-MAIL louis@genetique.uvsq.fr; FAX 33 01 39254569.
Article published on-line before print: Genome Res., 10.1101/gr. 177601.
Article and publication are at http://www.genome.org/cgi/doi/10.1101/gr.177601.
REFERENCES
- Altschul SF, Madden TL, Schäffer AA, Zhang J, Zhang Z, Miller W, Lipman DJ. Gapped BLAST and PSI-BLAST: A new generation of protein database search programs. Nucleic Acids Res. 1997;25:3389–3402. doi: 10.1093/nar/25.17.3389. [DOI] [PMC free article] [PubMed] [Google Scholar]
- Apweiler R, Attwood TK, Bairoch A, Bateman A, Birney E, Biswas M, Bucher P, Cerutti L, Corpet F, Croning MD, et al. InterPro—An integrated documentation resource for protein families, domains and functional sites. Bioinformatics. 2000;16:1145–1150. doi: 10.1093/bioinformatics/16.12.1145. [DOI] [PubMed] [Google Scholar]
- The Arabidopsis Genome Initiative. Analysis of the genome sequence of the flowering plant Arabidopsis thaliana. Nature. 2000;408:796–815. doi: 10.1038/35048692. [DOI] [PubMed] [Google Scholar]
- Aude JC, Diaz-Lazcoz Y, Codani JJ, Risler JL. Applications of the pyramidal clustering method to biological objects. Comput Chem. 1999;23:303–315. doi: 10.1016/s0097-8485(99)00006-6. [DOI] [PubMed] [Google Scholar]
- Birney E, Durbin R. Using Genewise in the Drosophila annotation experiment. Genome Res. 2000;10:547–548. doi: 10.1101/gr.10.4.547. [DOI] [PMC free article] [PubMed] [Google Scholar]
- Birney E, Thompson JD, Gibson TJ. PairWise and SearchWise: Finding the optimal alignment in a simultaneous comparison of a protein profile against all DNA translation frames. Nucleic Acids Res. 1996;24:2730–2739. doi: 10.1093/nar/24.14.2730. [DOI] [PMC free article] [PubMed] [Google Scholar]
- Bodorovsky M, McIninch J. GENMARK: Parallel gene recognition for both DNA strands. Comput Chem. 1993;17:123–133. [Google Scholar]
- Burge C, Karlin S. Prediction of complete gene structures in human genomic DNA. J Mol Biol. 1997;268:78–94. doi: 10.1006/jmbi.1997.0951. [DOI] [PubMed] [Google Scholar]
- Comet JP, Aude JC, Glémet E, Risler JL, Hénaut A, Slonimski PP, Codani JJ. Significance of Z-value statistics of Smith-Waterman scores for protein alignments. Comput Chem. 1999;23:317–331. doi: 10.1016/s0097-8485(99)00008-x. [DOI] [PubMed] [Google Scholar]
- Enright A, Ouzounis CA. GeneRAGE: A robust algorithm for sequence clustering and domain detection. Bioinformatics. 2000;16:451–457. doi: 10.1093/bioinformatics/16.5.451. [DOI] [PubMed] [Google Scholar]
- Florea L, Hartzell G, Zhang Z, Rubin GM, Miller W. A computer program for aligning a cDNA sequence with a genomic DNA sequence. Genome Res. 1998;8:967–974. doi: 10.1101/gr.8.9.967. [DOI] [PMC free article] [PubMed] [Google Scholar]
- Glemet E, Codani JJ. LASSAP, a large scale sequence comparison package. Comput Appl Biosci. 1997;13:137–143. doi: 10.1093/bioinformatics/13.2.137. [DOI] [PubMed] [Google Scholar]
- Gotoh O. Homology-based gene structure prediction: Simplified matching algorithm using a translated codon (tron) and improved accuracy by allowing for long gaps. Bioinformatics. 2000;16:190–202. doi: 10.1093/bioinformatics/16.3.190. [DOI] [PubMed] [Google Scholar]
- Gouzy J, Corpet F, Kahn D. Whole genome protein domain analysis using a new method for domain clustering. Comput Chem. 1999;23:333–340. doi: 10.1016/s0097-8485(99)00011-x. [DOI] [PubMed] [Google Scholar]
- Gouzy J, Eugène P, Greene EA, Kahn D, Corpet F. XDOM, a graphical tool to analyse domain arrangements in protein families. Comput Applic Biosci. 1997;13:601–608. doi: 10.1093/bioinformatics/13.6.601. [DOI] [PubMed] [Google Scholar]
- Gracy J, Argos P. Automated protein sequence database classification. Bioinformatics. 1998;14:174–187. doi: 10.1093/bioinformatics/14.2.174. [DOI] [PubMed] [Google Scholar]
- Halperin E, Faigler S, Gill-More R. FramePlus: Aligning DNA to protein sequences. Bioinformatics. 1999;15:867–873. doi: 10.1093/bioinformatics/15.11.867. [DOI] [PubMed] [Google Scholar]
- Kyrpides NC. Genomes OnLine Database (GOLD 1.0): A monitor of complete and ongoing genome projects world-wide. Bioinformatics. 1999;15:773–774. doi: 10.1093/bioinformatics/15.9.773. [DOI] [PubMed] [Google Scholar]
- Lipman DJ, Wilbur WJ, Smith TF, Waterman MS. On the statistical significance of nucleic acid similarities. Nucleic Acids Res. 1984;12:215–226. doi: 10.1093/nar/12.1part1.215. [DOI] [PMC free article] [PubMed] [Google Scholar]
- Lukashin AV, Bodorovsky M. GeneMark.hmm: New solutions for gene finding. Nucleic Acids Res. 1998;26:1107–1115. doi: 10.1093/nar/26.4.1107. [DOI] [PMC free article] [PubMed] [Google Scholar]
- Mott R. EST-GENOME: A program to align spliced DNA sequences to unspliced genomic DNA. Comput Appl Biosci. 1997;13:477–478. doi: 10.1093/bioinformatics/13.4.477. [DOI] [PubMed] [Google Scholar]
- Pavy N, Rombauts S, Déhais P, Mathé C, Ramana DVV, Leroy P, Rouzé P. Evaluation of gene prediction software using a genomic data set: Application to Arabidopsis thaliana sequences. Bioinformatics. 1999;15:887–899. doi: 10.1093/bioinformatics/15.11.887. [DOI] [PubMed] [Google Scholar]
- Rouzé P, Pavy N, Rombauts S. Genome annotation: Which tools do we have for it? Curr Opin Plant Biol. 1999;2:90–95. doi: 10.1016/S1369-5266(99)80019-3. [DOI] [PubMed] [Google Scholar]
- Smith TF, Waterman MS. Identification of common molecular subsequences. J Mol Biol. 1981;147:195–197. doi: 10.1016/0022-2836(81)90087-5. [DOI] [PubMed] [Google Scholar]
- Sonnhammer ELL, Kahn D. Modular arrangement of proteins as inferred from analysis of homology. Protein Sci. 1994;3:482–492. doi: 10.1002/pro.5560030314. [DOI] [PMC free article] [PubMed] [Google Scholar]
- Sonnhammer ELL, Eddy SR, Durbin R. Pfam: A comprehensive database of protein domain families based on seed alignments. Proteins. 1997;28:405–420. doi: 10.1002/(sici)1097-0134(199707)28:3<405::aid-prot10>3.0.co;2-l. [DOI] [PubMed] [Google Scholar]
- Tatusov RL, Koonin EV, Lipman DJ. A genomic perspective on protein families. Science. 1997;278:631–637. doi: 10.1126/science.278.5338.631. [DOI] [PubMed] [Google Scholar]
- Yona G, Linial N, Tishby N, Linial M. A map of the protein space: An automatic classification of all protein sequences. Proc Int Conf Intell Syst Mol Biol. 1998;8:395–406. [PubMed] [Google Scholar]


