

Abstract
Long terminal repeat (LTR) retrotransposons have been shown to make up much of the maize genome. Although these elements are known to be prevalent in plant genomes of a middle-to-large size, little information is available on the relative proportions composed by specific families of elements in a single genome. We sequenced a library of randomly sheared genomic DNA from maize to characterize this genome. BLAST analysis of these sequences demonstrated that the maize genome is composed of diverse sequences that represent numerous families of retrotransposons. The largest families contain the previously described elements Huck, Ji, and Opie. Approximately 5% of the sequences are predicted to encode proteins. The genomic abundance of 16 families of elements was estimated by hybridization to an array of 10,752 maize bacterial artificial chromosome (BAC) clones. Comparisons of the number of elements present on individual BACs indicated that retrotransposons are in general randomly distributed across the maize genome. A second library was constructed that was selected to contain sequences hypomethylated in the maize genome. Sequence analysis of this library indicated that retroelements abundant in the genome are poorly represented in hypomethylated regions. Fifty-six retroelement sequences corresponding to the integrase and reverse transcriptase domains were isolated from ∼407,000 maize expressed sequence tags (ESTs). Phylogenetic analysis of these and the genomic retroelement sequences indicated that elements most abundant in the genome are less abundant at the transcript level than are more rare retrotransposons. Additional phylogenies also demonstrated that rice and maize retrotransposon families are frequently more closely related to each other than to families within the same species. An analysis of the GC content of the maize genomic library and that of maize ESTs did not support recently published data that the gene space in maize is found within a narrow GC range, but does indicate that genic sequences have a higher GC content than intergenic sequences (52% vs. 47% GC).
The genome size of many plant species differs as a result of variable amounts of repetitive DNA. Maize is a moderately large plant genome of 2.3–2.7×10⁹ bp (Arumuganathan and Earle 1991). A significant portion of the maize genome comprises repetitive sequences (Hake and Walbot 1980). Most of these sequences are retroelements, mobile DNA elements that transpose via RNA intermediates using reverse transcriptase (Bennetzen 2000). Retrovirus-like retrotransposons containing long terminal repeats (LTRs) have been found in many plant species, often at a very high abundance (Flavell et al. 1992; Voytas et al. 1992; SanMiguel et al. 1996; Kumar and Bennetzen 1999). Non-LTR retroelements, such as long-interspersed nuclear elements (LINEs) and short-interspersed nuclear elements (SINEs) have also been identified in plants (Kumar and Bennetzen 1999). Abundant LINE and SINE elements, however, have not been identified in maize, although they may make up a small percentage of other plant genomes (Leeton and Smyth 1993; Yoshioka et al. 1993; The Arabidopsis Genome Initiative 2000). In contrast, the repetitive fraction of the human genome comprises, for the most part, SINE and LINE elements, whereas LTR retrotransposons are less abundant (International Human Genome Sequencing Consortium 2001). The mammalian SINEs and LINEs consist of only a few different families (International Human Genome Sequencing Consortium 2001). Most plant genomes appear to contain a rich mixture of abundant LTR-containing retroelement families (SanMiguel et al. 1996; Kumar and Bennetzen 1999). Five major classes together compose 25% of the maize genome (SanMiguel et al. 1996). Other plant retroelement families may be found in copy numbers varying from five to 50,000 (for review, see Bennetzen 1996). In plant species with smaller genomes, such as Arabidopsis, retrotransposons make up a very small percentage of the genome, perhaps <5%, and have a clear tendency toward clustering in the gene-poor pericentromeric regions (The Arabidopsis Genome Initiative 2000). Many questions still remain about the distribution of genes and repetitive sequences in plants with genomes less compact than Arabidopsis.
Many approaches have been taken to characterize genome structure, with
particular attention paid to regions that are believed to be rich in
genes. One of the earliest techniques involved the isolation of
isochores, compositionally homogenous DNA segments of >300 kb, that
can be subdivided based on GC content. The AT-rich isochores L1 and L2
constitute nearly  of most mammalian genomes, yet data
suggested that most of the genes are found in the most GC-rich fraction
of the genome, in the isochore family H3 (Bernardi 1989). More
recently, fluorescent in situ hybridization (FISH) has been used to
investigate the distribution of repetitive elements in plant genomes
(Pearce et al. 1996; Heslop-Harrison et al. 1997). Analysis of the DNA
sequence is a more direct approach. An analysis of the entire yeast
genome has been used recently to disprove previously held beliefs about
a link between gene density and silent-site GC content (Bradnam et al.
1999). The recent initial analysis of the human genome sequence has
also challenged the strict isochore hypothesis (International Human
Genome Sequencing Consortium 2001). As more genomes and genomic regions
are sequenced, analyses based on these sequences will provide the most
robust data about genome structure and organization.
of most mammalian genomes, yet data
suggested that most of the genes are found in the most GC-rich fraction
of the genome, in the isochore family H3 (Bernardi 1989). More
recently, fluorescent in situ hybridization (FISH) has been used to
investigate the distribution of repetitive elements in plant genomes
(Pearce et al. 1996; Heslop-Harrison et al. 1997). Analysis of the DNA
sequence is a more direct approach. An analysis of the entire yeast
genome has been used recently to disprove previously held beliefs about
a link between gene density and silent-site GC content (Bradnam et al.
1999). The recent initial analysis of the human genome sequence has
also challenged the strict isochore hypothesis (International Human
Genome Sequencing Consortium 2001). As more genomes and genomic regions
are sequenced, analyses based on these sequences will provide the most
robust data about genome structure and organization.
A detailed structural analysis of the maize genome remains to be performed. The frequency and distribution of many repetitive sequences has not been determined, nor is it known how these sequences are organized with respect to genes. To this end, we used a sample-sequencing strategy combined with hybridization to a bacterial artificial chromosome (BAC) library to study the composition, structure, and arrangement of the maize genome. Genomic sample sequencing is a rapid means of assessing genome organization (Brenner et al. 1993; Elgar et al. 1999). Sequence analysis of a library of randomly generated small maize genomic DNA clones demonstrates a large number of clones with similarity to retrotransposons. We were able to classify and quantify these sequences and families of sequences using repetitive elements of maize described previously. A comparative analysis of related grass species allowed us to trace the origin of these families of elements and the timing of their amplification in the maize genome. These DNA sequences were then used to determine the abundance and distribution of these elements in the maize genome by hybridization to a collection of BAC clones representing a 0.6× coverage of the maize genome. An analysis of the transcriptional activity of the different retrotransposon families was performed by searching a large collection of expressed sequence tags (ESTs) for conserved domains of the pol gene.
RESULTS
Sample Sequencing Indicates the Maize Genome is Highly Repetitive
A library (the cne1g library) of small-insert genomic DNA was prepared using nebulized maize total genomic DNA from the inbred line B73. After joining forward and reverse sequences from each clone, the total number of sequences was 2157, representing 1.41×10⁶ bp (GenBank accession numbers BH126890–BH130375). These genomic survey sequences, which presumably represent an unbiased sample of the maize genome, were analyzed by comparison with the public sequence databases as both nucleotide and amino acid translations using BLASTN and BLASTX. For further identification of genic sequences, we compared the sequences with the DuPont EST database, which contained more than one million plant EST sequences at the time of the analysis. The cne1g library was compared with full-length DNA sequences of retroelements isolated from the Adh-1 region (SanMiguel et al. 1996; Tikhonov et al. 1999). The cne1g sequences were also compared with one another in a low stringency sequence assembly; sequences with >80% identity over 100 bp were classified as related. Together, the BLAST results and sequence assembly allowed us to estimate the abundance of different repeats in the maize genome; this is, in essence, an electronic slot blot (Table 1).
Table 1.
BLAST Results of Small Insert Maize Library “cne1g”
| Category | Homology | # of sequences | % of total | 95% C.I.a | Element type | Size of element (LTR)b |
|---|---|---|---|---|---|---|
| Retroelement-related sequences | Ji | 203 | 9.4 | 8.25–10.71 | copia | 8.3 kb (1.1 kb) |
| Opie | 154 | 7.1 | 6.13–8.30 | copia | 9.0 kb (1.1 kb) | |
| Prem-2 | 35 | 1.6 | 1.17–2.25 | copia | 9.4 kb (1.3 kb) | |
| Victim | 4 | 0.2 | 0.00–0.42 | copia | 5.4 kb (100 bp) | |
| Fourf | 8 | 0.4 | 0.09–0.70 | copia | 6.8 kb (1.1 kb) | |
| Hopscotch | 1 | 0.0 | 0.00–0.19 | copia | 4.8 kb (230 bp) | |
| Huck | 231 | 10.7 | 9.47–12.08 | gypsy | 11–12 kb (1.61 kb) | |
| Grande1–4 | 85 | 3.9 | 3.20–4.85 | gypsy | 13.7 kb (600 bp) | |
| Cinful | 76 | 3.5 | 2.82–4.39 | gypsy | 8.5 kb (600 bp) | |
| ‘ANLI’ retro | 67 | 3.1 | 2.45–3.93 | gypsy | Unknown | |
| Tekay | 26 | 1.2 | 0.82–1.76 | gypsy | 12 kb (3.2 kb) | |
| Milt | 15 | 0.7 | 0.42–1.14 | gypsy | 4.7 kb (700 bp) | |
| Reina | 0 | 0.0 | 0.00–0.14 | gypsy | 5.4 kb (300 bp) | |
| Magellan | 0 | 0.0 | 0.00–0.14 | gypsy | 5.7 kb (340 bp) | |
| Zeon-1 | 103 | 4.8 | 3.95–5.76 | — | 7.3 kb (650 bp) | |
| Prem-1 | 53 | 2.5 | 1.88–3.20 | LTR only | Unknown (1–1.6) | |
| Cin1 | 11 | 0.5 | 0.19–0.84 | LTR only | Unknown (700 bp) | |
| Kake | 4 | 0.2 | 0.00–0.42 | — | 5.9 kb (170 bp) | |
| Other retrotransposons | 151 | 7.0 | 6.00–8.16 | — | ||
| LINEs | 3 | 0.1 | 0.00–0.37 | |||
| Unknown repeats | Repeat–22kD zein region | 92 | 4.3 | 3.49–5.20 | ||
| Repeat–19 kD zein region | 16 | 0.7 | 0.46–1.20 | |||
| Repeat–unknown | 196 | 9.1 | 7.95–10.37 | |||
| Other dispersed repeats | DNA transposons | 26 | 1.2 | 0.82–1.76 | ||
| MITEs | 15 | 0.7 | 0.42–1.14 | |||
| Tandemly repetitive sequences | Knob repeats | 42 | 1.9 | 1.44–2.62 | ||
| Ribosomal DNA | 39 | 1.8 | 1.33–2.46 | |||
| Centromeric repeats | 10 | 0.5 | 0.14–0.79 | |||
| Other | Chloroplast DNA | 37 | 1.7 | 1.25–2.36 | ||
| Similarity to genes | 117 | 5.4 | 4.55–6.46 | |||
| Unknown | 337 | 15.6 | 14.15–17.22 |
C.I., 95% confidence interval for estimate of the percentage of the genome comprised by each class.
The size of the known retroelements and LTRs was determined from GenBank accessions.
Several retrotransposons that are completely or partially characterized in the literature were found at high frequency in the cne1g library. These highly abundant sequences included Huck, Cinful, Ji, Opie (SanMiguel et al. 1996), Prem-2 (Mascarenhas and Turcich 1994), Zeon (Hu et al. 1995), Grande (GenBank accession no. X82087), and Prem-1 (Turcich and Mascarenhas 1994). Homologies to these elements were based on comparisons at the nucleotide level. A sequence was classified as a known element if it has a BLAST E-value of less than 10−5. Sequences with multiple homologies below an E-value of less than 10−5 were classified based on the best-scoring homolog in the databases. The Ji and Prem-2 elements are very similar (SanMiguel et al. 1996) and so we observed many sequences with very high scores to both. To a lesser extent, Ji/Prem-2 is similar to the Opie family. This group of sequences was the only abundant Ty1/copia-like group of retrotransposons found in maize. Huck, Grande, and Cinful are more diverse from one another and represent the most abundant Ty3/gypsy elements. The assembly of our sequences identified an additional abundant gypsy-like family related to Tekay (GenBank accession no. AF050455). We called this family of elements ANLI because of similarity to retroelements from both Ananas (GenBank accession no. CAA73042) and Lilium (GenBank accession no. 226407). The divergence within this family is higher than within any of the major families of maize. Many of the retroelements described previously and characterized in maize did not appear to be major components of the maize genome; such was the case for Hopscotch (White et al. 1994), Stoner (Marillonnet and Wessler 1998), Magellan, Reina, Fourf, Kake, Victim, and Milt (SanMiguel et al. 1996; Tikhonov et al. 1999). A repetitive sequence that represents 0.14% of the genome had a 95% probability of being found in our sample of 2157 sequences. For a repetitive element of 5 kb in length, this corresponds to a copy number of 700 in a genome of 2.5×10⁹ bp. A sequence that represents 0.03% of the genome (for the same size of 5 kb that would be 150 copies) had a 50% probability of being observed in the same sample.
One category included a variety of DNA sequences similar to retrotransposons from other organisms but not yet described for maize (“other retroelements”; Table 1). The homology, usually to retroelement pol genes, was revealed at the protein level (BLASTX). These sequences most likely represent novel but rare maize elements because homology comparisons should have identified any highly abundant elements. Some of these sequences, however, could include internal domains for Prem-1, a highly abundant element for which only the LTRs have been described (Turcich and Mascarenhas 1994). Only three sequences were found with significant homology to LINE retroelements.
Another 5% of the library was classified by homology to previously sequenced genomic regions, some of which had homology to unclassified retrotransposons. Significant similarity to the non-zein-encoding regions of the 22 kD zein cluster (AF031569) and 19 kD zein gene (X58700) was found in 92 and 16 sequences, respectively (Table 1). This suggests that these genomic regions contain several repeated elements, although not yet well characterized. Nine percent of the library was classified as unknown repeats because the sequences showed either similarity to a range of other maize genomic sequences in GenBank or to other sequences in the cne1g library. These are presumably repetitive elements that have not been described previously or we were unable to classify more precisely. Known tandem repeats such as knob, centromeric and ribosomal sequences constitute another 4% of the library. Several sequences with similarity to MITEs (miniature inverted-repeat transposable elements) and transposons were identified, but were not common in the library. Sequences with similarity either by BLASTX to known or predicted genes or by BLASTN to maize ESTs represented 5.4% of the library. This observation is consistent with models of the maize genome that predict a small proportion of the maize genome is devoted to the genic regions (Flavell et al. 1974).
Fifteen percent of the library was “unknown”; these sequences had no homology in the BLAST analysis to retrotransposons, genes, any known structural elements, or to chloroplast and mitochondrial DNA. Classification of these sequences awaits further characterization of the grass genomes.
GC Content in Genic and Nongenic Regions of the Maize Genome
One of the basic structural features of a genome is its GC content, a measurement of total guanine and cytosine compared with adenine and thymine. The GC content was determined for the random genomic library cne1g, for a large collection of EST sequences, and for maize-coding sequences in GenBank. A GC content of 49.5% has been reported for maize based on bouyant density and Tm (Hake and Walbot 1980). We calculated an average GC content of 47% for the cne1g library (Fig. 1). To compare the coding regions to total genomic sequence, the same calculation was performed on maize-coding sequences from GenBank. These sequences were 50% GC (Fig. 1). We also analyzed the GC content of 103,802 maize EST sequences (5.6×10⁷ bp) from the DuPont EST collection, and a subset of these sequences (3.4×10⁶ bp), including only those ESTs that had homology (E<10−4) to protein sequences in GenBank. The GC contents of the Dupont BLAST-ESTs and the GenBank sequences have a bimodal distribution that has been noted in previous analyses (Carels and Bernardi 2000). This bimodality, however, may be an artifact of the small number of maize sequences in GenBank; the complete collection of Dupont ESTs is not bimodal (Fig. 1). The random set of ESTs, which includes 5′ and 3′ UTRs, is 52% GC; ESTs with BLAST results to the protein databases average 54% and their GC content was not significantly affected if only longer coding regions were considered (assembled sequences greater than 1kb). Although some ESTs of maize were up to 70% GC rich, this appeared to be a small fraction of the total (Fig. 1). Overall, genic regions in maize are more (52%) GC-rich than total genomic sequence (47%). This is even more visible when one looks at the mode of the two distributions (42% for the genomic library and 50% for the EST collection). We computed the GC content for the 73% of the genomic sequences that were recognized as dispersed repetitive (excluding chloroplast, knob, ribosomal and centromeric sequences, genic regions, and unknown sequences); the average for this repetitive fraction was 48%. The average GC content of the retroelement-related sequences only (representing 57% of the cne1g library) was also 48%. Sequences classified as belonging to the Huck class of retrotransposons contributed to a great extent to the non-normal GC content distribution observed in the cne1g library. Their average GC content was 60%, with 61% of the Huck sequences making up 58% of all cne1g sequences with GC content of more than 60%. Among the major classes of repeats, Huck was under-represented, whereas knob repeats were over-represented within the sequences found in the major peak around 42% GC content.
Figure 1.

Distribution of GC content in maize genomic and genic sequences. GC content was calculated for sequences from the cne1g maize random genomic library, for maize-coding sequences present in GenBank, for a random set of maize EST sequences from the DuPont database, and for a subset of the DuPont EST sequences that have high BLAST homologies. The relative abundance of sequences was plotted with bins of 1% GC content. The scales on y-axes refer to the total number of base pairs in each GC-content bin; DuPont ESTs are plotted according to the left y-axis, all other data refer to values on the right y-axis.
Hybridization to BAC Clones Determines Abundance and Distribution of Retrotransposon Families
Fragments from the cne1g library representing diverse retroelements were hybridized to an array of BAC clones to estimate the abundance and distribution of these elements. For probes, we chose 12 clones from the cne1g library that were representative of all of the major classes of known retrotransposons. In addition, to check that our approach had not underestimated the representation of some repetitive classes, rare retroelement clones were selected that had few homologs in the cne1g library (labeled Copia # and Gypsy # elements in column 1 of Table 2). With the exception of G-6l19 and G-6d16, this second class of clones was homologous to retroelements from other species and therefore represented novel retroelements in the maize genome. Both groups of probes were hybridized to an array of 10,752 maize BAC clones. The average insert size of these BACs is 155 kb, and therefore represented a 0.6× genomic equivalent of the maize genome. A subset of 652 BAC clones was scored for the abundant sequences (>10% positive BACs), and all 10,752 BAC clones were scored for the rare sequences (<10% positive BACs, Table 2). All calculations take into account that 12% of the BAC library contains no or small inserts, as estimated by fingerprinting data (K. Fengler and M. Morgante, unpubl.), and none of the calculations include clones that contain chloroplast DNA. In general, there was a concordance between the abundance in the sequenced library and the frequency of hybridization to the BACs. Furthermore, these results confirm earlier findings that high-copy repetitive sequences are found throughout the maize genome (Edwards et al. 1996). The most frequently occurring element from hybridization data was also Huck (Table 2), which identified most of the BAC clones that contained other dispersed repeats. The high frequency observed for Huck relative to the proportion estimated from sequence data may result from a higher frequency of solo LTRs than intact elements, as has been recently demonstrated for the BARE-1 element in barley (Vicient et al. 1999; Shirasu et al. 2000). In the case of Prem-1, the sequence abundance was definitely underestimated as it was derived only from homology to the LTRs, as the internal domain of the element has not been described. In total, only 9% of the BAC clones were negative for all probes tested and putatively contained nonrepetitive inserts. It was later determined (E. Ananiev, pers. comm.) that ∼0.3% of the library clones putatively correspond to mitochondrial DNA, thereby not contributing significantly to the fraction of BAC clones that do not hybridize to repeats.
Table 2.
Distribution of Retroelements in the Maize Genome
| Elementa | % of sequences in cne1g library | % of BACs positive for elementb |
|---|---|---|
| Huck G-5n6 (LTR) | 10.7 | 80.5 |
| Grande G-6k8 (pol) | 3.9 | 64.5 |
| Ji G-6d24 (pol) | 9.4 | 65.9c |
| Prem-2 G-6d24 (pol) | 1.6 | 65.9c |
| Prem-1 G-1f15 (LTR) | 2.5 | 60.5 |
| Opie G-2a19 (pol) | 7.1 | 64.6 |
| Zeon-1 G-6o11 (LTR/gag) | 4.8 | 46.2 |
| Hopscotch | 0 | n.d. |
| Magellan | 0 | n.d. |
| Cinful G-2f14 (pol) | 3.5 | 26.0 |
| Milt | 0.7 | n.d. |
| Cin1 | 0.5 | n.d. |
| Reina | 0 | n.d. |
| Tekay G-3p17 (LTR) | 1.2 | 10.8 |
| Fourf | 0.4 | n.d. |
| Kake | 0.2 | n.d. |
| Victim | 0.2 | n.d. |
| ‘ANLI’ G-5n7 (pol) | 3.1 | 36.4 |
| Copia G-6l19 (pol/LTR) | 0.3 | 5.6 |
| Copia G-1e23 (pol) | 0.05 | 0.2 |
| Copia G-5e19 (pol) | 0.05 | 0.4 |
| Copia G-10d11 (pol) | 0.05 | 1.5 |
| Gypsy G-6d16 (pol) | 0.09 | 5.8 |
| Copia G-3n4 (pol) | 0.5 | 4.8 |
Letters in parentheses indicate region of element used as probe. LTR, long terminal repeat; pol, polyprotein; gag, gag polyprotein.
All calculations are corrected for the estimated 12% of BAC clones that contain no insert of maize genomic DNA. n.d., Not determined.
The Prem-2 and Ji families cross-hybridize.
The pattern of hybridization to gridded BAC clones using retroelement probes indicated that these repetitive elements are present in most regions of the maize genome. We looked at the distribution of different repetitive families in the maize genome using two different approaches.
In one analysis we considered all pairwise combinations of the most abundant retrotransposons and tested whether any pair of retroelement probes demonstrated independence in their hybridization patterns to the arrayed set of 652 BACs. If genomic clustering of families of retrotransposons occurs, the distribution may appear nonrandom between the BAC clones. In this case, certain retroelement families would co-localize to some BAC clones more frequently. For each pair of elements, we computed a Pearson correlation coefficient (1 or 0 for the presence or absence of a certain retrotransposon; Table 3) and a 2×2 χ2 for independence (Table 3). The χ2 test assumes that the a priori probability of each BAC carrying a certain repetitive element is the same and equal to the frequencies presented in Table 2. This assumption is clearly not correct as the BACs have different sizes and this will bias the distribution of repeats toward co-localization on the same BACs. Despite this bias, the tests can indicate the relative extent of clustering for each pair of elements. The coincidence of elements on BAC clones was highly significant when the lower estimate for empty clones, derived from fingerprint analyses, was used (12%). We performed a second calculation using as a proportion of empty clones the percentage of BACs that didn't hybridize to any retroelement probe (22%); this produced generally lower correlations but still higher ones for the most abundant elements. The strongest evidence of clustering was obtained in both cases for the elements Grande and Opie, whereas Prem-1 demonstrated more frequent clustering with the less abundant elements (Zeon-1 and ANLI). This may indicate insertion preferences or reflect the timing of different retroelement amplifications in the maize genome. Either event could produce the nested insertions of retrotransposons that have been described in maize (San Miguel et al. 1996).
Table 3.
Coincidence of Retrotransposon Hybridization to BACsa
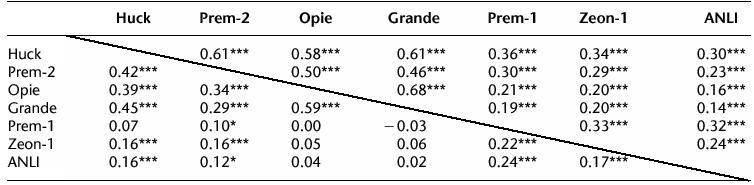 |
A set of 652 BACs was scored for the presence or absence of each of the listed retrotransposon families, using the same probes listed in Table 2. The coincidence of each pair of families is indicated in the table as a value for the Pearson correlation coefficient. The values above the diagonal were calculated with the assumption that 12% of the BAC clones had no insert (estimated from fingerprinting data; see text for details), while the values below the diagonal assume that a maximum 22% of the clones had no insert (assuming that all BACs not hybridizing to any repeat had no insert). The significance of each comparison was also determined by an independence chi-square test and is indicated next to the correlation coefficient: * is significant at 5%; ** is significant at 1%; and *** is significant at 0.1%.
The second analysis was performed on the 652 BAC clones scored for the repetitive elements by comparing the number of hybridizing retroelements with either the number of bands produced in a fingerprinting reaction (the number of bands is proportional to the insert size; K. Fengler and M. Morgante unpubl.) (Fig. 2A) or the insert size, as estimated from a NotI digest (Fig. 2B; a subset of 173 BACs). In both cases, there was a direct relationship between the insert size of the BACs and the number of retroelements that hybridized. BACs that did not hybridize to the most common repeats contained small inserts. This indicated that retroelements are randomly distributed, with few large regions of the maize genome devoid of the most abundant retroelement families.
Figure 2.

Number of hybridizing repetitive elements versus BAC clone size and complexity. BACs (652) from a high-density array were scored for the presence or absence of seven common retroelements (Huck, Prem-2, Opie, Grande, Prem-1, Zeon-1, and ANLI). (A) Repetitive elements versus number of BAC fingerprint bands. The 652 BACs were subjected to a fingerprinting reaction and the number of bands were counted and plotted; the diagonal line indicates the best-fit line for the data, with R2=0.6927 (P=0.000). (▴) BACs that are positive for the centromeric CentC repeat; (⋄) BACs that are positive for the knob 180 bp repeat. (B) Repetitive elements versus BAC clone size. A subset of the 652 BAC clones was sized by pulsed field gel analysis.
During the course of this analysis, we noticed that several BAC clones containing either knob (Dennis and Peacock 1984) or centromeric (CentC; Ananiev et al. 1998a) tandem repeats also hybridized to some retrotransposon probes. Table 4 reports the occurrence of retrotransposons on 22 centromeric BACs and on five knob BACs that were present in the set of 652 that was scored for the different probes reported in Table 2. Huck was present in all centromeric BACs, mostly accompanied by Grande and also Opie. Knob BACs either did not contain any retrotransposons (in a single case) or contained from four to six different elements. Prem-1 and Prem-2 were always represented in these BACs.
Table 4.
Occurrence of Retrotransposons in Centromere- and Knob-Repeat Containing BACsa
The Abundance of Related Retroelements Is Similar in Other Zea Species
Clones from the cne1g library were arrayed on nylon filters and probed using total labeled genomic DNA from four different Zea species, Tripsacum dactyloides (a relative of the Zea family), and Sorghum bicolor (Fig. 3A,B). Because the cne1g library was sequenced, it was possible to determine the hybridization intensity for each specific and known nucleotide sequence. Probing the library with the DNA from which the library was made, maize inbred line B73, indicated that only a small proportion of the library hybridized strongly with high-copy sequences. Thirty-seven of the 100 most intense spots were the knob 180-bp tandem repeat; 27 were the common retrotransposon Huck; 14 were Opie or Prem-2; and three encoded Grande family members. Of the remaining 19 intensely hybridizing spots, 10 had similarity to a range of maize genomic sequences, two were unknown sequences, four had low-scoring similarities to retrotransposons, two were rRNA sequences and one had high similarity to the centromeric tandem repeat CentC. Lack of a strong hybridization signal may not accurately reflect a low copy number for retrotransposon families because of sequence divergence among family members. Hybridization with Sorghum DNA produced only a few positives; the nucleotide sequence demonstrated that these clones contained rRNA sequences or chloroplast DNA that are both highly conserved among the grasses (Cordesse et al. 1993; Maier et al. 1995). Only the knob repeats produced an intense hybridization pattern in Tripsacum. Almost all other clones gave weak hybridization signals in this species, indicating either a lower copy number of repeats or a high level of sequence divergence. The hybridization patterns for Zea perennis, Zea luxurians, Zea diploperennis and Zea mays (inbred line B73) gave quite similar results. Comparisons between species were made for each clone by plotting the intensity of hybridization as measured by a phosphorimager (Fig. 3C). Z. diploperennis and Z. luxurians produced very similar hybridization patterns, whereas Z. perennis had a lower signal intensity for the knob sequences than other clones.
Figure 3.


Hybridization of genomic DNA to gridded small-insert library. (A) Phylogenetic tree demonstrating relationship of species for which genomic DNA was used as probes for the small insert library. The tree is based on data from Hilton and Gaut (1998). The branch lengths indicate time since divergence with time estimates denoted above. (B) Examples of hybridization patterns for 108 clones spotted in a nonregular duplicate arrangement. The center spot of each 5×5 grid contains λ DNA, which was not included in the probe mixture. (C) Pairwise comparisons of hybridization data to the cne1g library for the Zea probes: Z. luxurians, Z. diploperennis, Z. mays (B73), and Z. perennis. Each clone is plotted according to hybridization intensity in two species. Clones containing knob repeats are indicated by open triangles. The correlation coefficient R is shown either for all clones or for those containing knob repeats only.
We used dot-blots to quantitatively assess the relative abundance of several families of retrotransposons in the genomes of Z. perennis, Z. luxurians, Z. diploperennis, Z.mays (inbred line B73), Sorghum, and Tripsacum. Using genome size estimates from http://www.rbgkew.org.uk/cval/database1.html, genomic DNAs were spotted in a dilution series with equivalent numbers of copies, from 64 to 40,000 genomes. Similarly, PCR products of ∼1 kb, derived from Prem-2, Zeon-1, ANLI, Huck-2, Opie-2, and the low-copy uncharacterized gypsy element Gypsy 6d16 from Table 2 were spotted in a dilution series representing 4×10⁴ to 6.25×10⁸ copies. Individual PCR products representing these elements were then radiolabeled and used as DNA probes. Signal intensities were then compared to determine the copy number per genome for each element. Two different wash conditions, a low stringency (1× SSC at 65°C) and a high stringency (0.1× SSC at 65°C) were compared to determine how much of the difference in signal was attributable to sequence divergence (Table 5). Relative abundances of the different families are in fairly good accordance with the abundance estimates derived from Table 2, and with those described more generally in similar dot-blot experiments (Bennetzen et al. 1994). The copy number of most of these elements doubles under low stringency hybridizations (1× SSC; Table 5), possibly indicating the presence of extended and overlapping divergent families of retroelements and explaining at least partly the fact that estimates based on hybridization tend to be higher than those based on sequence analysis (Table 1). Opie (and the cross-hybridizing Ji family) and Huck have inserted multiple times from 0.2 to 5 million years ago (SanMiguel et al. 1998), allowing for significant diversification since the time of insertion. Zeon-1 appears to triple in copy number under lower stringency, and SanMiguel et al. (1998) have estimated that that is the oldest of the elements that we assayed. The data suggest that Huck is extremely abundant in the genome when the LTR region of this element was used as a probe. The copy number given here for Huck reflects the number of LTRs, so the number of entire elements should be exactly half. Excessive numbers of LTRs, however, may be a feature of complex plant genomes (Vicient et al. 1999) and 85% of the LTR-retrotransposons found in humans consist only of an isolated LTR (International Human Genome Sequencing Consortium 2001). Overall, the amplification of these retroelements in the Zea species may predate the most recent common ancestor because the same elements have successfully invaded all of these genomes to a similar extent. The elements Huck and Opie are present in high copy number in the distant maize relative Tripsacum, especially at low stringency, and thus their amplification may at least partly predate the split between the Tripsacum and Zea genera.
Table 5.
Estimated Copies per Genome of Several Maize Retrotransposons
| Element or species | Copy # Estimate 0.1X SSCb | Copy # Estimate 1.0X SSCb |
|---|---|---|
| ANLIa | ||
| Zea mays | 9400–20,100 | 17,300–47,500 |
| Zea diploperennis | 4800–10,300 | 6500–18,000 |
| Zea luxurians | 10,300–21,900 | 17,300–47,500 |
| Zea perennis | 10,850–23,450 | 12,250–33,950 |
| Tripsacum | 200–500 | 1400–3900 |
| Sorghum bicolor | 400–800 | 200–500 |
| Zeon-1a | ||
| Zea mays | 6200–12,000 | 12,900–32,400 |
| Zea diploperennis | 1500–2800 | 3800–9500 |
| Zea luxurians | 9000–17,500 | 20,200–50,800 |
| Zea perennis | 3900–7700 | 10,900–27,300 |
| Tripsacum | 500–1100 | 600–1600 |
| Sorghum bicolor | 100–300 | 300–900 |
| Prem-2a | ||
| Zea mays | 19,100–59,300 | 34,800–124,000 |
| Zea diploperennis | 4800–14,500 | 10,300–36,800 |
| Zea luxurians | 19,700–61,200 | 34,000–121,100 |
| Zea perennis | 13,300–41,700 | 21,700–77,400 |
| Tripsacum | 600–1800 | 1200–4100 |
| Sorghum bicolor | 0 | 800–2900 |
| Gypsy 6d16a | ||
| Zea mays | 2100–5000 | 2800–9000 |
| Zea diploperennis | 300–800 | 800–2500 |
| Zea luxurians | 3900–9000 | 5400–17,300 |
| Zea perennis | 2100–5300 | 3200–9800 |
| Tripsacum | 0 | 100–300 |
| Sorghum bicolor | 0 | 0–200 |
| Huck-2a | ||
| Zea mays | 165,700–236,000 | 286,100–515,300 |
| Zea diploperennis | 73,500–104,800 | 113,500–204,800 |
| Zea luxurians | 246,900–351,800 | 404,000–727,700 |
| Zea perennis | 70,700–101,200 | 174,700–314,300 |
| Tripsacum | 35,600–50,800 | 79,100–142,400 |
| Sorghum bicolor | 0 | 100–300 |
| Opie-2a | ||
| Zea mays | 64,500–130,600 | 90,400–337,200 |
| Zea diploperennis | 27,000–100,500 | 53,300–108,000 |
| Zea luxurians | 58,500–118,300 | 86,600–323,000 |
| Zea perennis | 32,900–66,500 | 57,100–212,500 |
| Tripsacum | 1000–2000 | 9800–36,600 |
| Sorghum bicolor | 0 | 100–400 |
Spotted DNAs were the same regions noted in Table 2.
The copy number per genome is given as a range based on the minimum and maximum estimates from the dilution series. Signals were determined by phosphorimager.
Hypomethylated Regions Contain Few Members of Abundant Retroelement Families
Repetitive DNA in plants is often methylated, whereas single or low-copy sequences such as genes are usually hypomethylated (Bennetzen et al. 1994). Rabinowicz et al. (1999) demonstrated that many repeated DNA sequences in maize can be excluded from small-insert DNA libraries using bacterial restriction-modification systems to select against methylated DNA sequences. We tested this approach by sequencing additional clones from the same ligation mixture used to construct the cne1g library described above. This ligation mix was used to transform Escherichia coli strain DH5α (MrcA, MrcB, MrcC, Mrr). Because the restriction systems for methylated DNA are intact in this strain, cloned DNA fragments containing methylated inserts are less likely to survive the cloning process. One difficulty that we encountered was that the library was also enriched for plastid sequences and clones without inserts because these sequences passed through the screen untouched (data not shown). This enrichment demonstrated the efficiency of the selection procedure. Excluding plastid contaminants, we obtained sequence from 129 clones and performed BLAST analysis as described above. These clones were richer in genes and sequences that are unknown, and depleted in the highly abundant retrotransposon families that represented ∼50% of the cne1g library (Table 6). The percentage of other classes of sequences, including knob repeats and low-copy retrotransposon-related sequences was nearly identical between the two libraries. The difference in BLAST results between the two libraries demonstrated that most of the highly abundant repeats are methylated in the maize genome, whereas genes and other low-copy sequences are less methylated.
Table 6.
BLAST Results of cne2x Library Selected for Hypomethylated Sequences
| Category | Number of cne2x sequences | Percent of cne2x library | Percent of cne1g library |
|---|---|---|---|
| Unknown | 63 | 60% | 16% |
| Gene | 14 | 13% | 5% |
| Repetitive or unknown retroelement | 13 | 12% | 25% |
| Known retroelement | 8 | 8% | 48% |
| Knob repeat | 4 | 4% | 2% |
| Other | 2 | 3% | 4% |
Low-Copy Retroelements Are Expressed, Abundant Elements Are Not
Most retrotransposons found in EST libraries are low-copy in genomic sequences; similarly, elements abundant in genomic sequences are infrequently found among EST libraries. We searched the DuPont collection of maize ESTs, which at the time of the analysis comprised 407,000 sequences that originated from poly-A+ RNA. Sequences homologous to the reverse transcriptase or integrase domain of LTR-retrotransposons were identified by BLAST analysis. Using a gypsy integrase domain, we recovered 23 ESTs. Using a gypsy reverse transcriptase domain, 22 homologous ESTs were identified (phylogenetic data not shown). Eleven ESTs were identified with homology to a copia reverse transcriptase domain. Sequences were translated and trimmed, proteins aligned, and phylogenetic analyses were performed using genomic and EST sequences as well as published retroelements from maize and other plant species (Fig. 4A,B). For comparison, known retroelement sequences were extracted from the nucleotide sequence of the maize Adh-1 region (SanMiguel et al. 1996; GenBank accession no. AF123535). Distance and parsimony algorithms produced similar trees (data not shown). Phylogenetic analysis of the EST and genomic retrotransposon sequences indicated that for both gypsy- and copia-type retroelements, sequences identified from the ESTs libraries are distinct from the high-copy sequences identified in small-insert genomic library (Fig. 4A,B). Very similar results were obtained for the gypsy-type even when the reverse transcriptase domain was used for the analysis (data not shown). For example, the most common elements, Huck, Ji, Opie, and Grande have very few related sequences in the EST database. The majority of the EST sequences were most closely related either to themselves, to retroelements known to be low copy in the genome, such as Tekay, Reina, Fourf, Victim, and Hopscotch, or to retroelements from other species. Several clades solely comprised sequences derived from the genomic sequences, suggesting that these may be uncharacterized, moderately abundant elements that are also not represented in the EST collection.
Figure 4.


Phylogenetic analysis of LTR-retrotransposon sequences in maize ESTs and genomic sequences. All DNA sequences were translated into proteins and trimmed, and phylogenetic analyses were performed using the neighbor-joining algorithm from distance matrices according to Kimura's two-parameter method. Branch lengths are proportional to genetic distance. Bootstrap values >50 are indicated as a percentage of 1000 replicates. Maize genomic sequences from the cne1g genomic library are indicated by a yellow box to the right of the sequence; maize cDNA sequences from the DuPont database by a red box; previously described maize retroelements by a blue box; and retroelements from other species by a green box. (A) Gypsy-related sequences. Predicted proteins were homologous to a 132-amino acid region of the integrase domain. (B, next page) Copia-related sequences. Predicted proteins were homologous to a 92-amino acid region of the reverse transcriptase domain.
The phylogenetic analysis indicated that numerous retroelements are shared between the maize and rice genomes. Rice genomic survey sequences obtained from BAC-end sequences (http://www.genome.clemson.edu/) were screened by BLAST for homology to known maize retrotransposons. Additional phylogenetic analyses were performed on these sequences and sequences representative of all main lineages from the maize phylogeny described above. Known retroelements from other plant species were identified in the public databases and included in the analysis. As described above, gypsy- and copia-type retroelement sequences were analyzed separately (Fig. 5A,B). The phylogenetic trees demonstrated that for multiple retrotransposon families, rice and maize retroelements have their most close relative in a heterologous species, that is, members belonging to different maize lineages are more divergent than elements from rice. The highly abundant Prem-2, Ji, and Opie copia families, however, are closer to each other than to any rice element as well as some of the subfamilies in the deeply branched Tekay/ANLI gypsy group. The branch lengths separating different pairs of closest rice and corn elements are mostly similar in both the gypsy and copia classes.
Figure 5.


Phylogenetic analysis of LTR-retrotransposon sequences in rice and maize. All DNA sequences were translated into proteins and trimmed to the respective domains, and phylogenetic analyses were performed using the neighbor-joining algorithm from distance matrices according to Kimura's two-parameter method. Branch lengths are proportional to genetic distance. Bootstrap values >50 are indicated as a percentage of 1000 replicates. Maize sequences are indicated by a yellow box to the right of the sequence; rice sequences by a gray box; maize retroelements described previously by a blue box; and retroelements from other species by a green box. The maize sequences were a subset of those in Fig. 4, chosen to represent the major clades on the trees in Fig. 4. Rice sequences with a number preceded by a00 or b00 are from the Clemson University Genome Center (http://www.genome.clemson.edu/); for display purposes, the Clemson sequence identifier OSJNB has been removed from these sequence names. (A) Gypsy-related sequences. Predicted proteins were homologous to a 132-amino acid region of the integrase domain. (B) Copia-related sequences. Predicted proteins were homologous to a 92-amino acid region of the reverse transcriptase domain.
DISCUSSION
The large number of characterized individual maize retroelements was critical for defining the various families of elements found in our analysis. Many maize retroelement families are closely related and elements appear to amplify in waves over evolutionary time (SanMiguel et al. 1998). Therefore, the maize genome contains a collection of elements or families of elements varying in age and relationship (SanMiguel et al. 1998). Because of the close relationship between some families, it was not always possible to definitively categorize the sequences in the cne1g library. Characterization of retrotransposons of moderate abundance and, in particular, their LTRs that have no uniformly recognizable features, awaits further sequencing of maize genomic regions. In our analysis, the most common retroelements in maize only cross-hybridize with the closest wild relatives in the same genus. If species-specific retroelement families are found generally in plant species, identifying such families and calculating their abundance will require a combination of sample sequencing from the genome as well as sequencing and expert annotation of large chromosomal regions. Sample sequencing of other plant genomes will provide estimates of gene density, but classifying nongenic sequences will be difficult if intact repetitive elements from these plant species have not been described. For example, Mao et al. (2000) analyzed 73,000 BAC-end sequences to determine that 4.5% of the rice genome is comprosed of transposable elements; lacking a set of distinct and well-characterized rice elements, these sequences could only be characterized into broadly defined categories (e.g., gypsy- or copia-like). Within the complete sequence of subgenomic regions (e.g., some BAC-sized contigs), it is likely that examples of the most common genome-specific retroelements will be found, as demonstrated by the analysis of the Adh-1 region of maize (SanMiguel et al. 1996). Alternatively, it may be possible to isolate individual intact elements from tandem repeats (Ananiev et al. 1998b).
The sequence-based analysis described in this paper demonstrates that at least 57% of the maize genome is composed of several classes of LTR retrotransposons. C0t analysis of maize indicates a complex genome composition (Hake and Walbot 1980): 20% high-copy repetitive DNA (8×10⁵ copies); 40% moderate-copy repetitive DNA (1000 copies); ∼27% unique DNA. Recent data from the maize Adh-1 region found that 60% of a 280-kb region comprised retrotransposons (SanMiguel et al. 1996). The abundant elements from the Adh-1 region, which were estimated by hybridization to constitute >50% of the maize genome (SanMiguel et al. 1996), are the same elements found in our broad genomic analysis. We found that the major gypsy and copia families of LTR retrotransposons make up ∼23 and 19% of the maize genome, respectively, whereas at least an additional 15% of the maize genome has more distant homology to both classes of LTR retrotransposons. Almost 15% of the genome appears to be made of yet to be characterized repetitive elements. When other known repeat types such as tandem repeats and DNA transposons are added, the fraction of the genome that appears to be repetitive sums to 77%. In the remaining fraction, in addition to the chloroplast DNA, we find about 16% of sequences that remain uncharacterized; this portion may include genic noncoding sequences, such as promoters and regulatory sequences, introns, and untranslated 5′ and 3′ ends of genes. Given that the identifiable protein-encoding regions only comprised 5% of our sample, it would be surprising if the genic noncoding sequences were more than 5%–10% of the genome. Therefore, approximately one third to one half of the maize single/low-copy fraction is of unknown origin and function. These sequences could include highly degenerated retrotransposons, novel retrotransposon LTRs, or noncoding sequences of structural importance. The maize genome is ∼2.5×10⁹ bp, making it a moderately sized plant genome, but it remains to be seen if the composition of the maize genome is representative of other plant species with similarly sized genomes. Presumably, the wide range of genome sizes in plants results from varying success rates of retrotransposons that flourish in different genomes.
We found that retrotransposons are distributed in a more-or-less random fashion in the maize genome. The arrangement or distribution of genes within the repetitive DNA that constitutes a large fraction of the genome, however, is still a point of discussion. One model favors the presence of gene-rich regions; the other predicts that genes are more-or-less uniformly dispersed among the repetitive DNA. Gill et al. (1996) reported on the presence of gene-rich regions in wheat, and other groups have detected a higher than expected gene density in small regions of barley and other grasses (Panstruga et al. 1998; Feuillet and Keller 1999). Additionally, clustered retrotransposon regions should be expected given the finding that retroelements preferentially insert into existing retroelements (San Miguel et al. 1996; Suoniemi et al. 1997). On the other hand, Tikhonov et al. (1999), Chen et al. (1998), and Llaca and Messing (1998) sequenced syntenic regions of rice, sorghum, and maize (Adh-1, Sh1-a2, zein genes) and demonstrated genome expansion by retrotransposon insertion into intergenic spaces. Based on the distribution of the most abundant repeats in BAC clones and on the correlation observed between the size of the BACs and the number of different repetitive elements, we conclude that repeats are, in general, randomly distributed in the genome. This is consistent with early studies using C0t analysis that found 76% of unique DNA is within 5 kb of repetitive DNA (Hake and Walbot 1980) and more limited studies that also indicated a random distribution of repetitive sequences in the maize genome (Edwards et al. 1996). Furthermore, hybridization of common retrotransposons to BAC clones indicated a paucity of large genomic regions (>50–100 kb) devoid of these repetitive sequences. The Huck element alone (or at least its LTRs) is present in the vast majority of BACs of average size and is missing from only very few BACs containing other abundant repetitive elements. Although local distributions of genes may tend toward gene-rich or gene-poor, there is no evidence for a systematically skewed distribution of retroelements in maize. In wheat, in situ hybridization used to visualize transcription foci in interphase nuclei showed a distribution consistent with evenly distributed genes on the chromosome (Abranches et al. 1998). Maize and other Gramineae genomes may have similar distributions of genes and retroelements.
We observed that retrotransposons have successfully invaded even heterochromatic regions constituted by tandemly arranged repeats such as centromeres and knobs, in agreement with previous studies (Ananiev et al. 1998a; Ananiev et al. 1998b). A smaller number of families seem to have invaded centromeres than knobs. Huck, Grande, and Opie were found intermixed with the centromeric CentC tandem repeat. Huck and Prem-2 were the only elements that Ananiev et al. (1998a) found in cosmids from the chromosome 9 centromere. All seven abundant retrotransposons that were probed on the BACs were on the other hand found in the knob-repeat containing BACs, with up to six different elements within the length of a BAC, whereas analysis of chromosome 9 cosmids had revealed the presence of only Grande, Zeon, and Prem-2 (Ananiev et al. 1998b). This may indicate a preferential localization of particular retrotransposon families in centromeric and knob regions, although we cannot exclude the possibility that complex repeat hybridization patterns in knob-containing BAC clones may occur as a result of rare chimeric BAC clones.
The GC-content of maize genic regions is higher than the average for the genome, and, in contrast to previous reports, there is a wide distribution of GC-contents for individual genes. Isopycnic gradient centrifugation has been used to putatively separate a gene-rich fraction from a gene-poor fraction in maize (Carels et al. 1995; Barakat et al. 1997). This analysis suggests that the putative gene-rich fraction of the Gramineae genomes is characterized by a GC content within a range of 1% variability (Carels et al. 1995; Barakat et al. 1997) in fragments of size 100–200 kb. Furthermore, this model shows that the Gramineae genomes are composed of genes clustered with specific families of transposons or retrotransposons, with gene clusters separated by gene-empty regions of unknown repeated sequences that make up most of the genome of the Gramineae (Barakat et al. 1998). As discussed above, our data indicate that the abundant gypsy- and copia-like families of retrotransposons are distributed throughout the maize genome. We have shown that the Huck family of retroelements has a markedly different GC content with respect to the rest of the genome and contributes to the non-normality of the GC content distribution in the genomic sequences. We have also shown, however, that Huck is extremely frequent and dispersed in the genome, as well as associated with all other abundant classes of repeats. It is therefore unlikely that its distribution could justify the observations of the Bernardi group. We have demonstrated that maize-coding sequences have highly variable GC-content. Although the Bernardi laboratory has published similar data on a small set of maize genes (Carels and Bernardi 2000), this group is still publishing the conflicting claim that nuclear genes in Gramineae are found in a 1%–2% GC range (Barakat et al. 2000).
Minimal cross-hybridization between maize clones and Sorghum genomic DNA indicated that retrotransposons that are common in maize have become prevalent only since Sorghum and maize diverged. An alternate possibility is that highly repetitive sequences have been removed from the Sorghum genome (Bennetzen and Kellogg 1997). Sequence analysis of some of these maize elements has demonstrated that many of these subfamilies have expanded substantially in the last three million years (SanMiguel et al. 1998). The hybridization patterns using diverse Zea genomes as probes to cultivated maize clones suggest that most of the repetitive elements may have been present in proportions seen in modern maize at the time of divergence of these species. Hybridization with Tripsacum, which is supposed to have separated from the progenitor of Zea species ∼5 million years ago, indicates that there is little sequence homology at the nucleotide level between more divergent genomes and the Zea species. The knob repeats, however, were strikingly similar between Tripsacum and Zea mays; it is possible that these repeats have been maintained by concerted evolution and meiotic drive (Buckler et al. 1999). Therefore, the repetitive component of the maize genome appears to have changed radically in recent evolutionary history, while the underlying or basal genome has not changed as dramatically. This is in sharp contrast to the similarly sized human genome, where very little amplification of repetitive elements has been observed in the last 25 million years together with a general steady decline in activity since the mammalian radiation, leading to the filling of the genome with ancient transposons (International Human Genome Sequencing Consortium 2001).
The phylogenetic analysis of maize genomic and EST sequences indicates that high-copy maize retrotransposons are not expressed, whereas rare retroelements are expressed. Furthermore, high-copy retroelements are predominantly located outside of hypomethylated regions (Rabinowicz et al. 1999; this study). These regions contain more rare and diverse retroelement families. We examined more than 400,000 EST sequences and were able to identify a small set of retroelement cDNAs derived from these rare families. Given the portion of the maize genome composed by the high-copy retroelements, it is remarkable that so few of these elements were represented in the EST sequences. Conversely, in the copia family there is evidence for considerable transcriptional activity of the very diverse group comprising Hopscotch, Victim, and Fourf, which is otherwise rare in the genome as shown for example by the genomic clone G-5e19 (Table 2). Expression of the low-copy retrotransposons may occur because these elements have escaped methylation and are therefore still active. The tobacco retrotransposon Tto1 is transcriptionally silenced when introduced into Arabidopsis at a high copy number (Hirochika et al. 2000). It has been demonstrated that the endogenous Arabidopsis retroelement Tar17 and silenced Tto1 transgenes become transpositionally and transcriptionally active, respectively, when placed in a hypomethylated ddm1 background (Hirochika et al. 2000). We have demonstrated that methylation occurs predominantly in high-copy retrotransposons, which therefore may suppress their expression. The phylogenetic analysis also shows that in general the gypsy class in maize is more diverse than the copia one. The Tekay/ANLI group in the gypsy class and the Hopscotch/Victim/Fourf group in the copia class in particular seem to be very diverse, with many deeply branched subfamilies.
We observed that the closest relative of many maize retrotransposons is found in rice rather than in other maize families. This relationship suggests either an ancient origin for many of the retrotransposon families (e.g., vertical transmission) or horizontal transmission, in which these retrotransposons have jumped the species-gap. In the latter case, numerous families of intact and functional elements would have been transferred. The differential amplification of some families may explain different genome sizes and repeat compositions. Retrotransposons from heterologous species may be opportunistic — if such an element is introduced into a novel genetic background, it may escape recognition, leading to unchecked amplification in the genome. Although horizontal transfer has been demonstrated between Drosophila species (Jordan and McDonald 1998; Terzian et al. 2000), data are inconclusive for plant species (Flavell 1992; Suoniemi et al. 1998). The observation that branch lengths separating rice from corn elements are usually similar, indicating a similar evolutionary distance, seems to argue against the horizontal transmission hypothesis and support the existence of a diverse group of retrotransposon families in the progenitor of both rice and maize. Some of these families would have then undergone differential amplification in the two species with further differentiation into subfamilies for the Prem-2/Ji/Opie copia group and the Tekay/ANLI gypsy group in maize. Pairs of rice and maize elements that are separated by shorter distances (if statistically significant), such as Fourf, could be indicative of either horizontal transmission or selective pressure for maintenance of movement activity. It will be interesting to compare retroelement sequences once more genomic sequences are available in both species as well as in both maize and rice ESTs. This would lead to a better understanding of the relative importance of vertical transmission, horizontal transmission, and selection for movement activity in relation to retrotransposon distribution and abundance in the two species.
The complexity of the maize genome, and probably also that of other plant species, is quite different from that of mammalian genomes. The dispersed repetitive fraction of the human genome, as estimated from the draft sequences, ranges from 35% (Venter et al. 2001) to 45% (International Human Genome Sequencing Consortium 2001). Our estimate for maize ranges from 64% to 73% (depending on whether the totally unknown repeats are considered or not). This may be a result of the different age of the repetitive fraction in the two genomes, with the younger maize repeats being easier to recognize and classify than the older human repeats. Mammalian genomes mostly comprise only a few types of repeats, such as SINEs and LINEs (International Human Genome Sequencing Consortium 2001); in contrast, plant genomes are a more complex mixture of diverse families of mostly LTR-containing retroelements. Even in the compact genome of Arabidopsis thaliana, where they make up <5% of the DNA, LTR-retrotransposons are represented by 70 different families, whereas in the human genome, 100 families are present (International Human Genome Sequencing Consortium 2001). These elements are highly heterogeneous and vary considerably in copy number in plants. The abundance, similarity, and length of the LTRs of these elements may pose considerable difficulties for whole-genome sequencing. Many of the repeats are recent in origin (SanMiguel et al. 1998) and highly similar in sequence, and will therefore be more difficult to assemble accurately in a whole genome sequencing effort. Furthermore, the wide distribution of repetitive elements will complicate efforts to isolate a gene-rich fraction of the genome simply by screening libraries for large-insert clones devoid of repeats. It may be possible to isolate a gene-enriched fraction of the genome by using methylation-sensitive host strains (Rabinowicz et al. 1999), but it remains to be seen how well this strategy would work on a larger scale, or how many of the unknown sequences are from genic regions.
METHODS
Materials
DNA was extracted from the following sources: maize inbred line B73, sorghum inbred line IS9203, Zea luxurians accession no. 11083 (Nicaragua), Zea perennis accession no. 9475 (Mexico), Zea diploperennis accession no. 9476 (Mexico), and Tripsacum dactyloides accession no. 2061 (Arkansas).
Construction of Maize Genomic Library
Five micrograms of maize (B73) genomic DNA was sheared according to the nebulization protocol of Wilson and Mardis (1997). DNA was precipitated and resuspended in 40 μL of TE. Fragment ends were repaired in a 50 μl reaction mix using cloned Pfu DNA polymerase (Stratagene) and 1× Pfu buffer (Stratagene), following the protocol suggested by the manufacturer. End-repaired nebulized DNA was electrophoresed on a 1% agarose gel. Fragments were selected in the size range of 0.8–1.2 kb and DNA was purified from the gel and ligated into pCR-Script (Stratagene) according to the manufacturer's instructions in a 10μL mix. One microliter of this ligation mix was electroporated into E. coli strain DH10β (mrcA, mrcB, mrcC, mrr) using ElectroMax electro-competent cells (Life Technologies). The average insert size after cloning was ∼1 kb, and inserts from 2632 clones were selected for sequencing from both directions.
Selection of Hypomethylated Sequences
One microliter of the ligation mix described above was used to transform E. coli strain DH5α (MrcA, MrcB, MrcC, Mrr) MAX efficiency competent cells (Life Technologies). Transformants (210) were selected for sequencing.
DNA Sequencing and Analysis
DNA for sequencing was prepared from selected transformants using the QIAprep 96 Turbo plasmid DNA isolation kit (QIAGEN). DNA sequencing was performed using an ABI 377 automated sequencer (Applied Biosystems Inc.), the PRISM Ready Reaction DyeDeoxy Terminator cycle sequencing kit (Applied Biosystems) and standard M13 forward and M13 reverse primers. Forward and reverse sequences were trimmed using Phred scores and assembled using the software package Phrap (P. Green, University of Washington) to join overlapping sequences from a single clone. Sequence data were evaluated using Consed (Gordon et al. 1998). BLAST searches (Altschul et al. 1997) were performed on DuPont servers using recent updates of GenBank. Perl scripts were used to calculate the GC content of selected sequences. Phylogenetic analyses were performed using PAUP* version 4.0 (Sinauer Associates). Before searching for retroelement sequences in the EST libraries, the libraries were screened to remove those with genomic contamination; sequences from libraries with a high level of matches to the cne1g genomic clones and a high content of chloroplast and ribosomal sequences were not used. Confidence intervals for abundance estimates of sequence classes were computed based on the binomial distribution and a sample size of 2157.
High-Density Grids and Hybridizations of BAC Clones
Genomic bacterial artificial chromosome (BAC) libraries of maize had been constructed previously from the public inbred Mo17 using partial HindIII digests (H. Shizuya and M. Morgante, unpubl.). In this study, we used a set of 10,752 clones representing ∼0.6 genome equivalents with an average insert size of 155 kb. Clones were gridded in duplicate onto Hybond N+ (Amersham) membrane in a 4×4 array of 384-well plates using a Q-bot robot (Genetix). DNA from arrayed bacterial clone colonies was immobilized on the membranes according to standard protocols (Dunham et al. 1999). Filters were hybridized with radiolabeled probes described in the text according to standard protocols (Sambrook et al. 1989).
Hybridization to Gridded Small-Insert Library
DNA from the maize small-insert library transformed into E. coli strain DH10β and described above was gridded at moderate density onto nylon membranes (Hybond N+, Amersham). DNA was saved from the sequencing template preparation in 96-well plates. These samples were gridded in duplicate in a 5×5 array of 96-well plates using a Flexys robot and λ DNA at 5 ng/μL was gridded in the center spot. DNA was fixed to the membrane by denaturing for 2 min in 0.5 M NaOH, 1.5 M NaCl, and neutralizing for 5 min in 1.5 M NaCl, 0.5 M Tris-HCl (pH 7.5). A total of 2688 clones were arrayed on the membranes. Zea species, Tripsacum, and sorghum genomic DNA was labeled with 32P by random priming (Amersham) and used to hybridize to the clones arrayed on membranes. Autoradiography images were recorded using a STORM PhosphorImager (Molecular Dynamics). Images were further processed and signal intensities determined using the image analysis software XdotsReader (Cose, Dugny, France) by averaging the signals from the two spots for each clone.
Insert Size Calculations for BAC Clones
BAC clones were digested with the restriction enzyme NotI, which releases the insert from the vector. Digested DNAs were run on a pulsed field gel and sized by comparison with a concatenated λ ladder (New England Biolabs). Fingerprinting reactions were performed by digesting BACs with both EarI and TaqI, and filling in the EarI ends with fluorescently labeled ddNTPs (M. Morgante, unpubl.). The reaction products were run on an ABI 377 and the bands analyzed using ABI GeneScan software (Applied Biosystems Inc.).
Dot Blots and Copy Number Calculations
Dot blots were prepared by applying dilution series of DNA to nylon filters. DNA concentrations of DNAs listed in Table 5 were measured by spectrophotometer and diluted to a predetermined number of copies per microliter using the number of base pairs per fragment or genome (using C-values from http://www.rbgkew.org.uk/cval/database1.html). Ten microliters of each sample was spotted onto the membranes and crosslinked by UV light. The dilution series for PCR products ranged from 4 × 10³ to 6.25×10⁷ copies per microliter. The dilution series for genomic DNAs ranged from 6.4 to 4×10³ copies per microliter. DNA hybridization probes were radioactively labeled with 32P by random priming and hybridized overnight in 0.5 M sodium phosphate, 7% SDS, 1% BSA, and 1 mM EDTA at 65°C. Calculations were performed by determining the hybridization intensity per copy of the repeat on the control spots. These values were calculated after subtracting both background and any cross-hybridization observed in other retroelements on the same blot. The copy number per genome was estimated by dividing the hybridization intensity per genome by the hybridization intensity per copy, with both values determined from the linear range of the dilution series.
Acknowledgments
We gratefully acknowledge the assistance of Maureen Dolan and the DuPont Genomics group for technical help. We also thank Mike Hanafey, Stanley Luck, and David Argentar for bioinformatics support. Tripsacum DNA was a kind gift of Brandon Gaut.
The publication costs of this article were defrayed in part by payment of page charges. This article must therefore be hereby marked “advertisement” in accordance with 18 USC section 1734 solely to indicate this fact.
Footnotes
E-MAIL michele.morgante@usa.dupont.com; FAX (302) 631-2607.
Article published on-line before print: Genome Res., 10.1101/gr.188201.
Article and publication are at http://www.genome.org/cgi/doi/10.1101/gr.188201.
REFERENCES
- Abranches R, Beven AF, Aragon-Alcaide L, Shaw PJ. Transcription sites are not correlated with chromosome territories in wheat nuclei. J Cell Biol. 1998;143:5–12. doi: 10.1083/jcb.143.1.5. [DOI] [PMC free article] [PubMed] [Google Scholar]
- Altschul SF, Madden TL, Schaffer AA, Zhang J, Zhang Z, Miller W, Lipman DJ. Gapped BLAST and PSI-BLAST: A new generation of protein database search programs. Nucleic Acids Res. 1997;25:3389–3402. doi: 10.1093/nar/25.17.3389. [DOI] [PMC free article] [PubMed] [Google Scholar]
- Ananiev EV, Phillips RL, Rines HW. Chromosome-specific molecular organization of maize (Zea maysL.) centromeric regions. Proc Natl Acad Sci. 1998a;95:13073–13078. doi: 10.1073/pnas.95.22.13073. [DOI] [PMC free article] [PubMed] [Google Scholar]
- ————— Complex structure of knob DNA on maize choromosome 9: Retrotransposon invasion into heterochromatin. Genetics. 1998b;149:2025–2037. doi: 10.1093/genetics/149.4.2025. [DOI] [PMC free article] [PubMed] [Google Scholar]
- Arumuganathan K, Earle ED. Nuclear DNA content of some important plant species. Plant Mol Biol Rep. 1991;9:208–218. [Google Scholar]
- Barakat A, Carels N, Bernardi G. The distribution of genes in the genomes of Gramineae. Proc Natl Acad Sci. 1997;94:6857–6861. doi: 10.1073/pnas.94.13.6857. [DOI] [PMC free article] [PubMed] [Google Scholar]
- Barakat A, Matassi G, Bernardi G. Distribution of genes in the genome of Arabidopsis thalianaand its implications for the genome organization of plants. Proc Natl Acad Sci. 1998;95:10044–10049. doi: 10.1073/pnas.95.17.10044. [DOI] [PMC free article] [PubMed] [Google Scholar]
- Barakat A, Gallois P, Raynal M, Mestre-Ortega D, Sallaud C, Guiderdoni E, Delseny M, Bernardi G. The distribution of T-DNA in the genomes of transgenic Arabidopsisand rice. FEBS Lett. 2000;471:161–164. doi: 10.1016/s0014-5793(00)01393-4. [DOI] [PubMed] [Google Scholar]
- Bennetzen JL, Schrick K, Springer PS, Brown WE, SanMiguel P. Active maize genes are unmodified and flanked by diverse classes of modified, highly repetitive DNA. Genome. 1994;37:565–576. doi: 10.1139/g94-081. [DOI] [PubMed] [Google Scholar]
- Bennetzen JL. The contributions of retroelements to plant genome organization, function and evolution. Trends Microbiol. 1996;4:347–353. doi: 10.1016/0966-842x(96)10042-1. [DOI] [PubMed] [Google Scholar]
- Bennetzen JL. Comparative sequence analysis of plant nuclear genomes. Microcolinearity and its many exceptions. Plant Cell. 2000;12:1021–1030. doi: 10.1105/tpc.12.7.1021. [DOI] [PMC free article] [PubMed] [Google Scholar]
- Bennetzen JL, Kellogg EA. Do plants have a one-way ticket to genome obesity? Plant Cell. 1997;9:1509–1514. doi: 10.1105/tpc.9.9.1509. [DOI] [PMC free article] [PubMed] [Google Scholar]
- Bernardi G. The isochore organization of the human genome. Annu Rev Genet. 1989;23:637–661. doi: 10.1146/annurev.ge.23.120189.003225. [DOI] [PubMed] [Google Scholar]
- Bradnam KR, Seoighe C, Sharp PM, Wolfe KH. G+C content variation along and among the Saccharomyces cerevisiaechromosomes. Mol Biol Evol. 1999;16:666–675. doi: 10.1093/oxfordjournals.molbev.a026149. [DOI] [PubMed] [Google Scholar]
- Brenner S, Elgar G, Sandford R, Macrae A, Venkatesh B, Aparicio S. Characterization of the pufferfish (Fugu) genome as a compact model vertebrate genome. Nature. 1993;366:265–268. doi: 10.1038/366265a0. [DOI] [PubMed] [Google Scholar]
- Buckler ES, IV, Phelps-Durr TL, Keith Buckler CS, Dawe RK, Doebley JF, Holtsford TP. Meiotic drive of chromosomal knobs reshaped the maize genome. Genetics. 1999;153:415–426. doi: 10.1093/genetics/153.1.415. [DOI] [PMC free article] [PubMed] [Google Scholar]
- Carels N, Barakat A, Bernardi G. The gene distribution of the maize genome. Proc Natl Acad Sci. 1995;92:11057–11060. doi: 10.1073/pnas.92.24.11057. [DOI] [PMC free article] [PubMed] [Google Scholar]
- Carels N, Bernardi G. Two classes of genes in plants. Genetics. 2000;154:1819–1825. doi: 10.1093/genetics/154.4.1819. [DOI] [PMC free article] [PubMed] [Google Scholar]
- Chen M, SanMiguel P, Bennetzen JL. Sequence organization and conservation in sh2/a1-homologous regions of sorghum and rice. Genetics. 1998;148:435–443. doi: 10.1093/genetics/148.1.435. [DOI] [PMC free article] [PubMed] [Google Scholar]
- Cordesse F, Cooke R, Tremousaygue D, Grellet F, Delseny M. Fine structure and evolution of the rDNA intergenic spacer in rice and other cereals. J Mol Evol. 1993;36:369–379. doi: 10.1007/BF00182184. [DOI] [PubMed] [Google Scholar]
- Dennis ES, Peacock WJ. Knob heterochromatin homology in maize and its relatives. J Mol Evol. 1984;20:341–350. doi: 10.1007/BF02104740. [DOI] [PubMed] [Google Scholar]
- Dunham I, Dewar K, Kim U-J, Ross MT. Bacterial cloning systems. In: Birren B, Green ED, Klapholtz S, Myers RM, Riethman H, Roskams J, editors. Genome analysis: A laboratory manual. 3, Cloning systems. Cold Spring Harbor, NY: Cold Spring Harbor Laboratory Press; 1999. [Google Scholar]
- Edwards KJ, Veuskens J, Rawles H, Daly A, Bennetzen JL. Characterisation of four dispersed repetitive DNA sequences from Zea maysand their use in constructing contiguous DNA fragments using YAC clones. Genome. 1996;39:811–817. doi: 10.1139/g96-102. [DOI] [PubMed] [Google Scholar]
- Elgar G, Clark MS, Meek S, Smith S, Warner S, Edwards YJ, Bouchireb N, Cottage A, Yeo GS, Umrania Y, Williams G, Brenner S. Generation and analysis of 25 Mb of genomic DNA from the pufferfish Fugu rubripesby sequence scanning. Genome Res. 1999;9:960–971. doi: 10.1101/gr.9.10.960. [DOI] [PMC free article] [PubMed] [Google Scholar]
- Feuillet C, Keller B. High gene density is conserved at syntenic loci of small and large grass genomes. Proc Natl Acad Sci. 1999;96:8265–8270. doi: 10.1073/pnas.96.14.8265. [DOI] [PMC free article] [PubMed] [Google Scholar]
- Flavell AJ. Ty1-copia group retrotransposons and the evolution of retroelements in the eukaryotes. Genetica. 1992;86:203–214. doi: 10.1007/BF00133721. [DOI] [PubMed] [Google Scholar]
- Flavell AJ, Smith DB, Kumar A. Extreme heterogeneity of Ty1-copia group retrotransposons in plants. Mol Gen Genet. 1992;231:233–242. doi: 10.1007/BF00279796. [DOI] [PubMed] [Google Scholar]
- Flavell RB, Bennett MD, Smith JB, Smith DB. Genome size and the proportion of repeated nucleotide sequence DNA in plants. Biochem Genet. 1974;12:257–269. doi: 10.1007/BF00485947. [DOI] [PubMed] [Google Scholar]
- Gill KS, Gill BS, Endo TR, Taylor T. Identification and high-density mapping of gene-rich regions in chromosome group 1 of wheat. Genetics. 1996;144:1883–1891. doi: 10.1093/genetics/144.4.1883. [DOI] [PMC free article] [PubMed] [Google Scholar]
- Gordon D, Abajian C, Green P. Consed: A graphical tool for sequence finishing. Genome Res. 1998;8:195–202. doi: 10.1101/gr.8.3.195. [DOI] [PubMed] [Google Scholar]
- Hake S, Walbot V. The genome of Zea mays, its organization and homology to related grasses. Chromosoma. 1980;79:251–270. [Google Scholar]
- Heslop-Harrison JS, Brandes A, Taketa S, Schmidt T, Vershinin AV, Alkhimova EG, Kamm A, Doudrick RL, Schwarzacher T, Katsiotis A, et al. The chromosomal distributions of Ty1-copiagroup retrotransposable elements in higher plants and their implications for genome evolution. Genetica. 1997;100:197–204. [PubMed] [Google Scholar]
- Hilton H, Gaut B. Speciation and domestication in maize and its wild relatives: Evidence from the globulin-1 gene. Genetics. 1998;150:863–872. doi: 10.1093/genetics/150.2.863. [DOI] [PMC free article] [PubMed] [Google Scholar]
- Hirochika H, Okamoto H, Kakutani T. Silencing of retrotransposons in Arabidopsis and reactivation by the ddm1mutation. Plant Cell. 2000;12:357–369. doi: 10.1105/tpc.12.3.357. [DOI] [PMC free article] [PubMed] [Google Scholar]
- Hu W, Das OP, Messing J. Zeon-1, a member of a new maize retrotransposon family. Mol Gen Genet. 1995;248:471–480. doi: 10.1007/BF02191647. [DOI] [PubMed] [Google Scholar]
- International Human Genome Sequencing Consortium Initial sequencing and analysis of the human genome. Nature. 2001;409:860–921. doi: 10.1038/35057062. [DOI] [PubMed] [Google Scholar]
- Jordan IK, McDonald JF. Evolution of the copia retrotransposon in the Drosophila melanogasterspecies subgroup. Mol Biol Evol. 1998;15:1160–1171. doi: 10.1093/oxfordjournals.molbev.a026023. [DOI] [PubMed] [Google Scholar]
- Kumar A, Bennetzen JL. Plant retrotransposons. Annu Rev Genet. 1999;33:479–532. doi: 10.1146/annurev.genet.33.1.479. [DOI] [PubMed] [Google Scholar]
- Leeton PR, Smyth DR. An abundant LINE-like element amplified in the genome of Lilium speciosum. Mol Gen Genet. 1993;237:97–104. doi: 10.1007/BF00282789. [DOI] [PubMed] [Google Scholar]
- Llaca V, Messing J. Amplicons of maize zein genes are conserved within genic but expanded and constricted in intergenic regions. Plant J. 1998;15:211–220. doi: 10.1046/j.1365-313x.1998.00200.x. [DOI] [PubMed] [Google Scholar]
- Maier RM, Neckermann K, Igloi GL, Kossel H. Complete sequence of the maize chloroplast genome: Gene content, hotspots of divergence and fine tuning of genetic information by transcript editing. J Mol Biol. 1995;251:614–628. doi: 10.1006/jmbi.1995.0460. [DOI] [PubMed] [Google Scholar]
- Mao L, Wood TC, Yu Y, Budiman MA, Tomkins J, Woo S-S, Sasinowski M, Presting G, Frisch D, Goff S, Dean RA, Wing RA. Rice transposable elements: A survey of 73,000 sequence-tagged connectors. Genome Res. 2000;10:982–990. doi: 10.1101/gr.10.7.982. [DOI] [PMC free article] [PubMed] [Google Scholar]
- Marillonnet S, Wessler SR. Extreme structural heterogeneity among the members of a maize retrotransposon family. Genetics. 1998;150:1245–1256. doi: 10.1093/genetics/150.3.1245. [DOI] [PMC free article] [PubMed] [Google Scholar]
- Mascarenhas JP, Turcich MP. in. In: Stephenson AG, Kao T-H, editors. Pollen-Pistil Interactions and Pollen Tube Growth. Rockville, MD: American Society for Plant Physiology; 1994. pp. 39–44. [Google Scholar]
- Panstruga R, Buschges R, Piffanelli P, Schulze-Lefert P. A contiguous 60 kb genomic stretch from barley reveals molecular evidence for gene islands in a monocot genome. Nucleic Acids Res. 1998;26:1056–1062. doi: 10.1093/nar/26.4.1056. [DOI] [PMC free article] [PubMed] [Google Scholar]
- Pearce SR, Harrison G, Li D, Heslop-Harrison J, Kumar A, Flavell AJ. The Ty1-copia group retrotransposons in Viciaspecies: Copy number, sequence heterogeneity and chromosomal localisation. Mol Gen Genet. 1996;250:305–315. doi: 10.1007/BF02174388. [DOI] [PubMed] [Google Scholar]
- Rabinowicz PD, Schutz K, Dedhia N, Yordan C, Parnell LD, Stein L, McCombie WR, Martienssen RA. Differential methylation of genes and retrotransposons facilitates shotgun sequencing of the maize genome. Nature Genet. 1999;23:305–308. doi: 10.1038/15479. [DOI] [PubMed] [Google Scholar]
- Sambrook J, Fritsch EF, Maniatis T. Molecular cloning: A laboratory manual. Cold Spring Harbor, NY: Cold Spring Harbor Laboratory Press; 1989. [Google Scholar]
- SanMiguel P, Tikhonov A, Jin YK, Motchoulskaia N, Zakharov D, Melake-Berhan A, Springer PS, Edwards KJ, Lee M, Avramova Z, Bennetzen JL. Nested retrotransposons in the intergenic regions of the maize genome. Science. 1996;274:765–768. doi: 10.1126/science.274.5288.765. [DOI] [PubMed] [Google Scholar]
- SanMiguel P, Gaut BS, Tikhonov A, Nakajima Y, Bennetzen JL. The paleontology of intergene retrotransposons of maize. Nature Genet. 1998;20:43–45. doi: 10.1038/1695. [DOI] [PubMed] [Google Scholar]
- Shirasu K, Schulman AH, Lahaye T, Schulze-Lefert P. A contiguous 66-kb barley DNA sequence provides evidence for reversible genome expansion. Genome Res. 2000;10:908–915. doi: 10.1101/gr.10.7.908. [DOI] [PMC free article] [PubMed] [Google Scholar]
- Suoniemi A, Tanskanen J, Schulman AH. Gypsy-like retrotransposons are widespread in the plant kingdom. Plant J. 1998;13:699–705. doi: 10.1046/j.1365-313x.1998.00071.x. [DOI] [PubMed] [Google Scholar]
- Suoniemi A, Schmidt D, Schulman AH. BARE-1 insertion site preferences and evolutionary conservation of RNA and cDNA processing sites. Genetica. 1997;100:219–230. [PubMed] [Google Scholar]
- Terzian C, Ferraz C, Demaille J, Bucheton A. Evolution of the Gypsy endogenous retrovirus in the Drosophila melanogastersubgroup. Mol Biol Evol. 2000;17:908–914. doi: 10.1093/oxfordjournals.molbev.a026371. [DOI] [PubMed] [Google Scholar]
- The Arabidopsis Genome Initiative Analysis of the genome sequence of the flowering plant Arabidopsis thaliana. Nature. 2000;408:796–815. doi: 10.1038/35048692. [DOI] [PubMed] [Google Scholar]
- Tikhonov AP, SanMiguel PJ, Nakajima Y, Gorenstein NM, Bennetzen JL, Avramova Z. Colinearity and its exceptions in orthologous adhregions of maize and sorghum. Proc Natl Acad Sci. 1999;96:7409–7414. doi: 10.1073/pnas.96.13.7409. [DOI] [PMC free article] [PubMed] [Google Scholar]
- Turcich MP, Mascarenhas JP. PREM-1, a putative maize retroelement has LTR (long terminal repeat) sequences that are preferentially transcribed in pollen. Sex Plant Reprod. 1994;7:2–11. [Google Scholar]
- Venter JC, Adams MD, Myers EW, Li PW, Mural RJ, Sutton GG, Smith HO, Yandell M, Evans CA, Holt RA, et al. The sequence of the human genome. Science. 2001;291:1304–1351. doi: 10.1126/science.1058040. [DOI] [PubMed] [Google Scholar]
- Vicient CM, Suoniemi A, Anamthawat-Jonsson K, Tanskanen J, Beharav A, Nevo E, Schulman AH. Retrotransposon BARE-1 and its role in genome evolution in the genus Hordeum. Plant Cell. 1999;11:1769–1784. doi: 10.1105/tpc.11.9.1769. [DOI] [PMC free article] [PubMed] [Google Scholar]
- Voytas DF, Cummings MP, Koniczny A, Ausubel FM, Rodermel SR. Copia-like retrotransposons are ubiquitous among plants. Proc Natl Acad Sci. 1992;89:7124–7128. doi: 10.1073/pnas.89.15.7124. [DOI] [PMC free article] [PubMed] [Google Scholar]
- White SE, Habera LF, Wessler SR. Retrotransposons in the flanking regions of normal plant genes: A role for copia-like elements in the evolution of gene structure and expression. Proc Natl Acad Sci. 1994;91:11792–11796. doi: 10.1073/pnas.91.25.11792. [DOI] [PMC free article] [PubMed] [Google Scholar]
- Wilson RK, Mardis ER. Shotgun sequencing. In: Birren B, Green ED, Klapholtz S, Myers RM, Roskams J, editors. Genome Analysis: A laboratory manual. 1, Analyzing DNA. Cold Spring Harbor, NY: Cold Spring Harbor Laboratory Press; 1997. [Google Scholar]
- Yoshioka Y, Matsumoto S, Kjima S, Ohshima K, Okada N, Machida Y. Molecular characterization of a short interspersed repetitive element from tobacco that exhibits sequences homology to specific tRNAs. Proc Natl Acad Sci. 1993;90:6562–6566. doi: 10.1073/pnas.90.14.6562. [DOI] [PMC free article] [PubMed] [Google Scholar]